Monday, January 28, 2013

QG3 Market Signal Service and video is now available

Potential Subscriber,

I am offering a market signal service to inform and educate traders with relevant technical analysis using the QG3, Elliot Wave, and Japanese Candlesticks.

Please watch the following video to better understand the QG3 and the service that I am offering. The video shows the basics of the QG3, 3 years of back testing in the gold market and current performance tracking.


If this method of technical market analysis appeals to you, for a monthly subscription fee of $20.00(USD) per month I will send you email updates on a regular basis (usually daily). This service will provide the following:

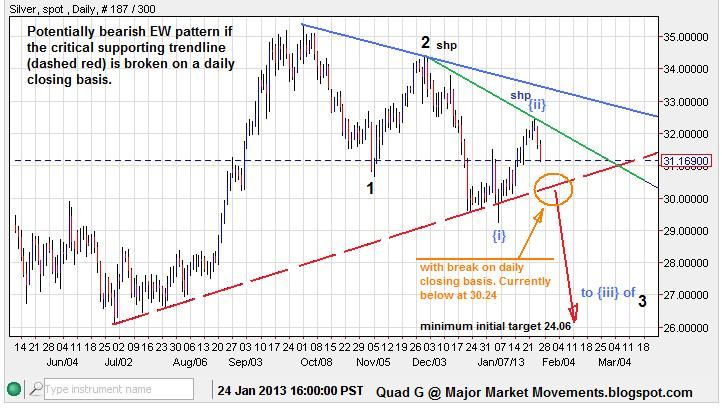
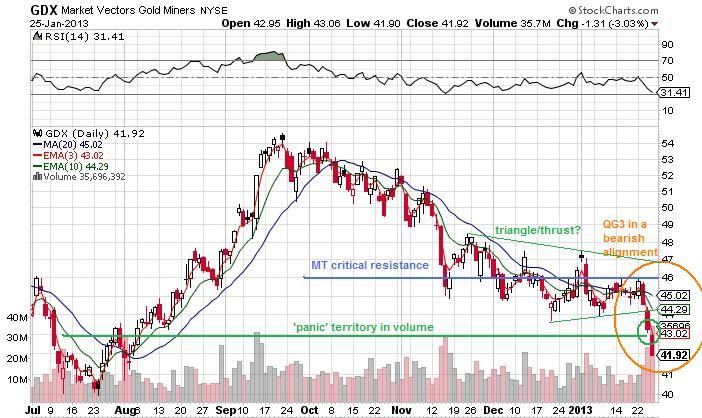
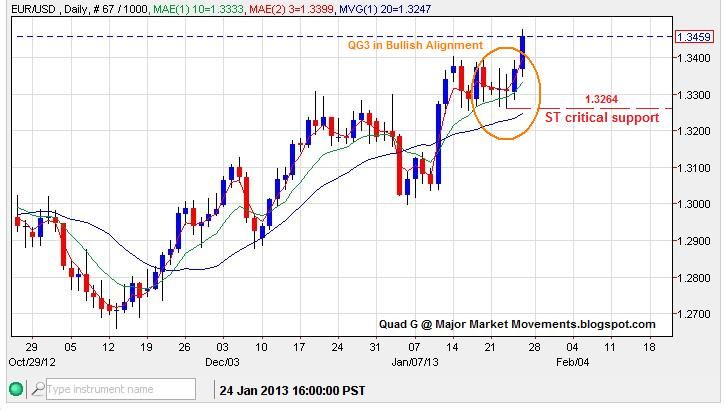
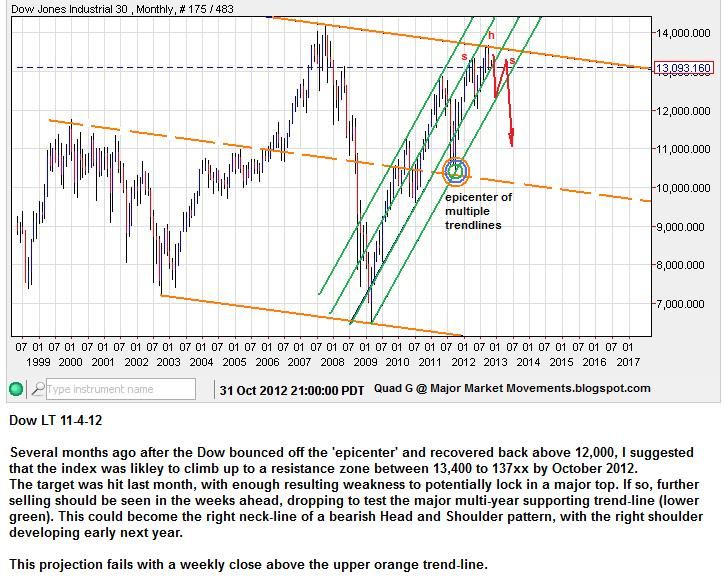
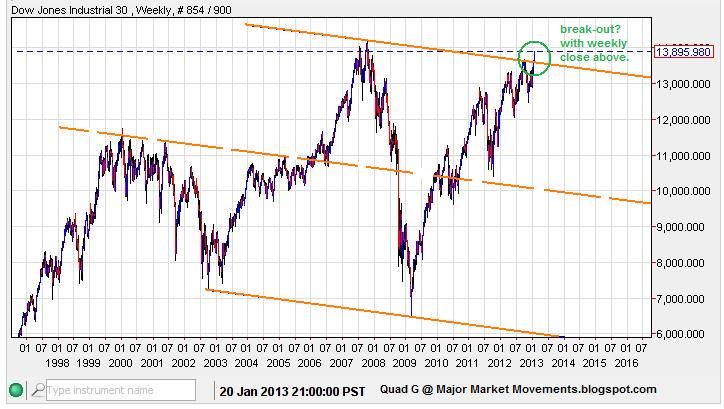
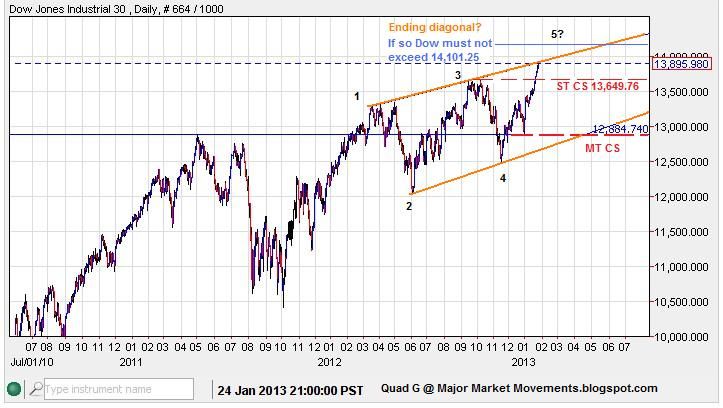
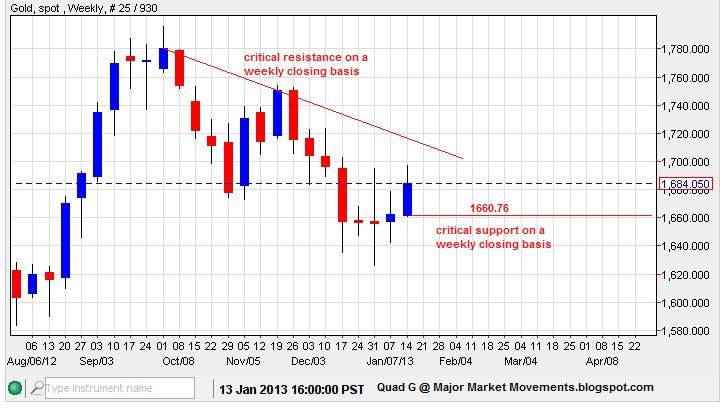
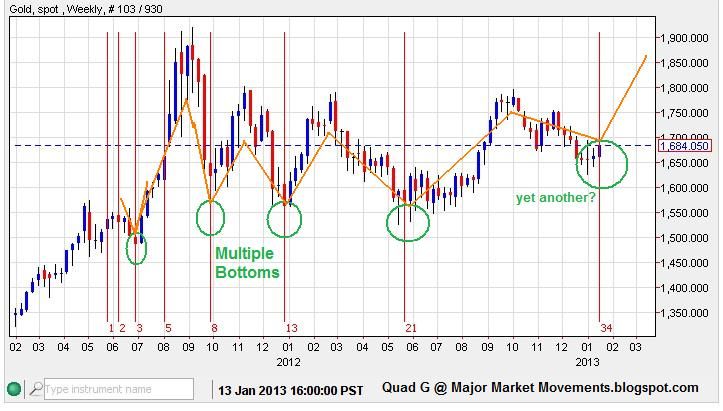
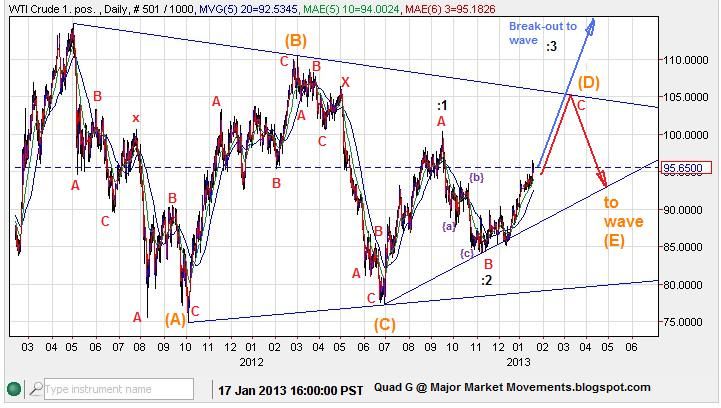
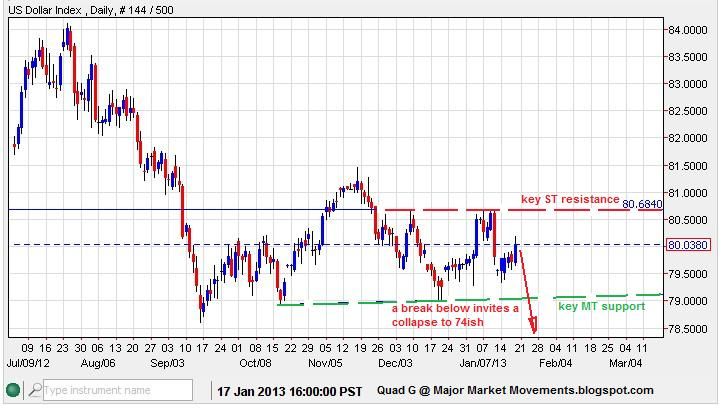
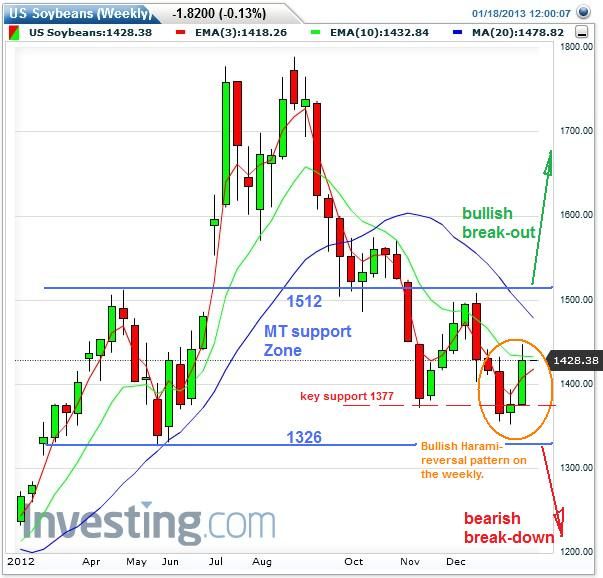
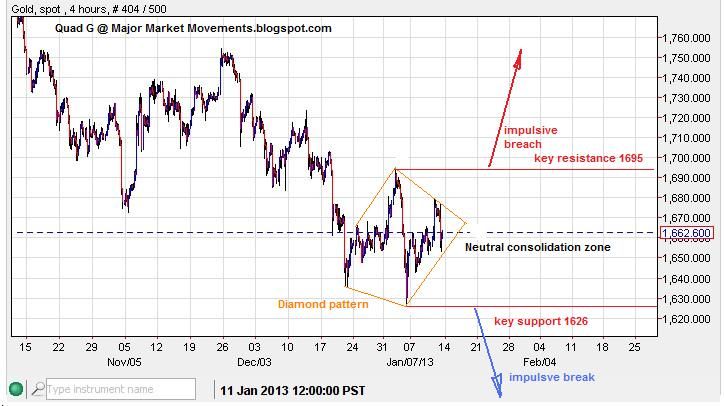
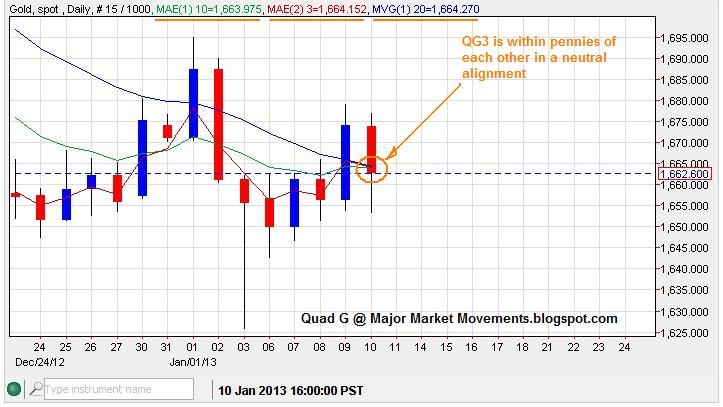
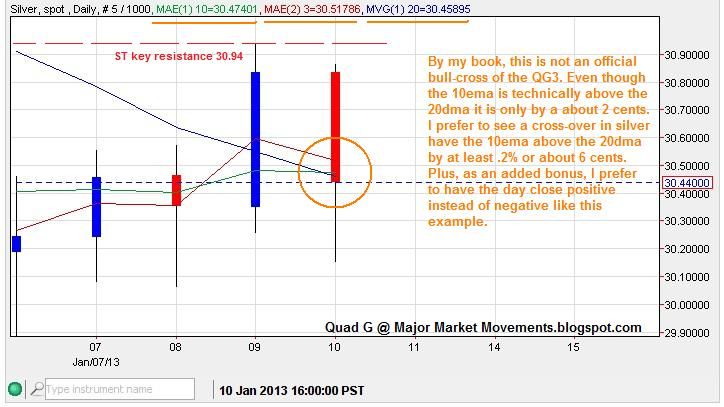
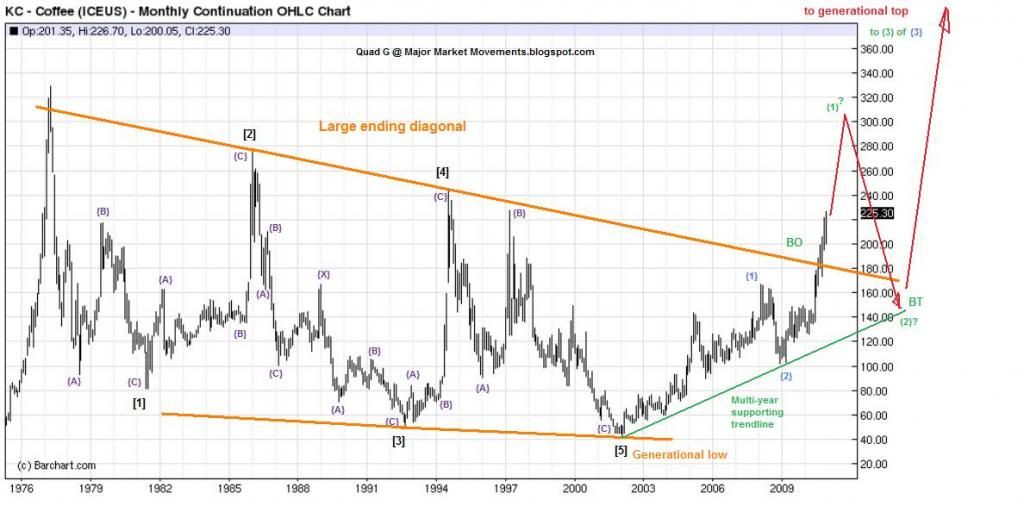
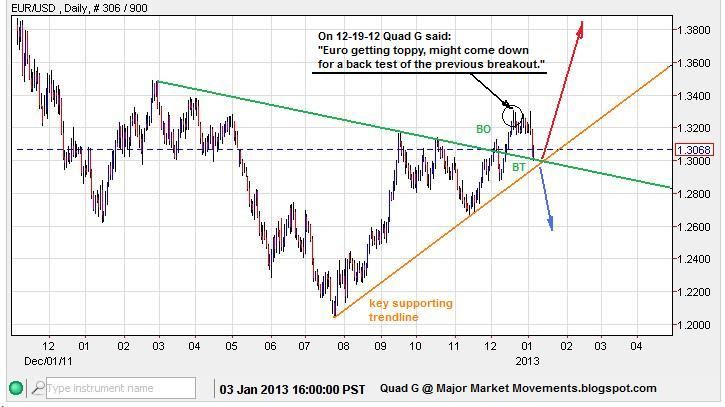
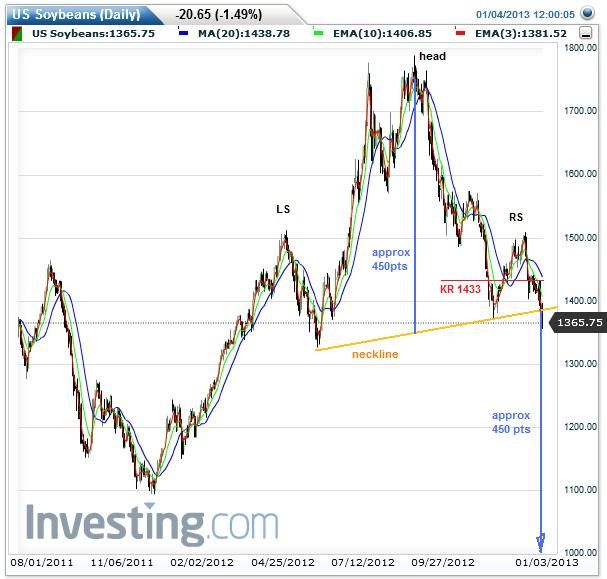
-A primary focus on the Gold, Silver and EUR/USD markets, with peripheral attention to ETFs such as GLD, SLV and GDX. Also, the US Stock Market, Forex and commodities such as grains, softs and energy may be covered.

-Updates on a regular basis, usually daily, that will include entry, exit and stop loss information.

-Signals for physical purchase and hedging of precious metals.

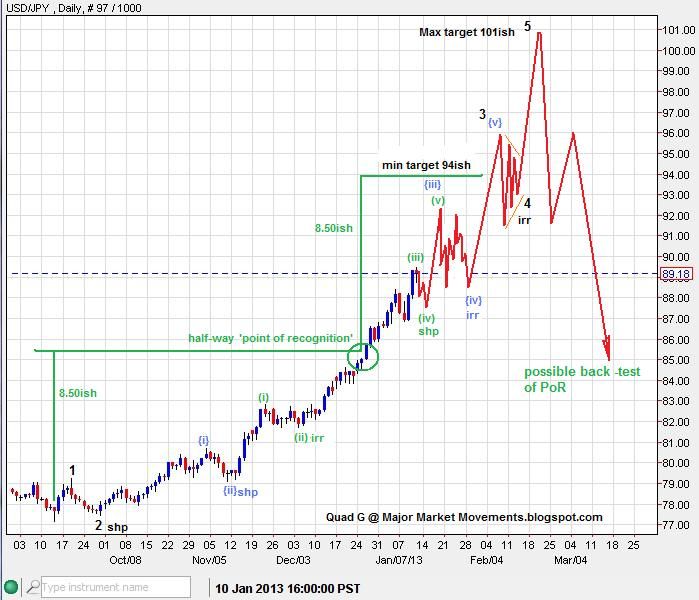
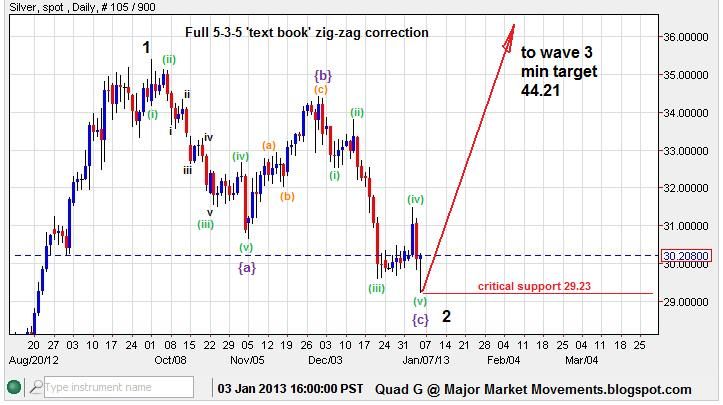
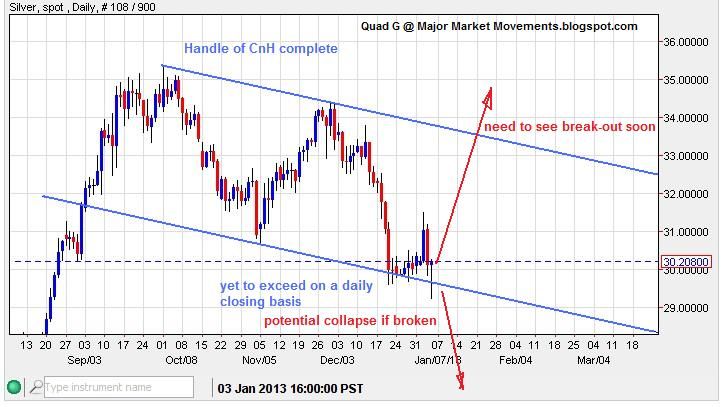
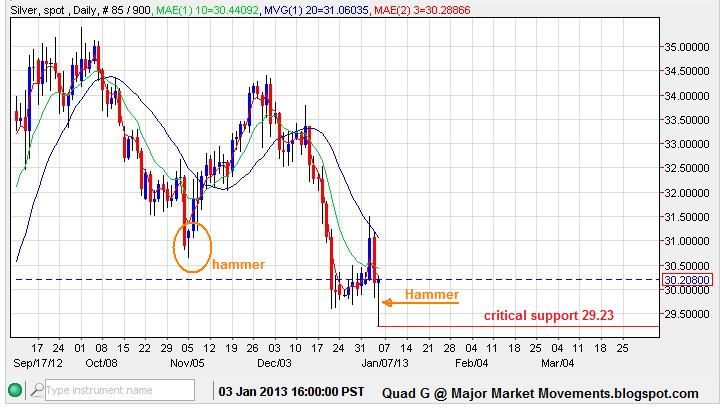
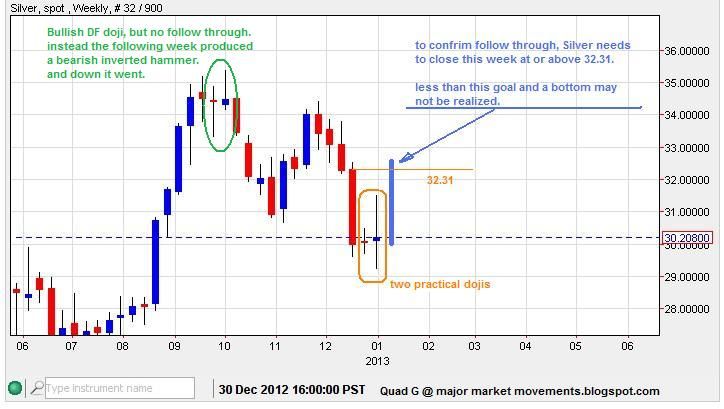
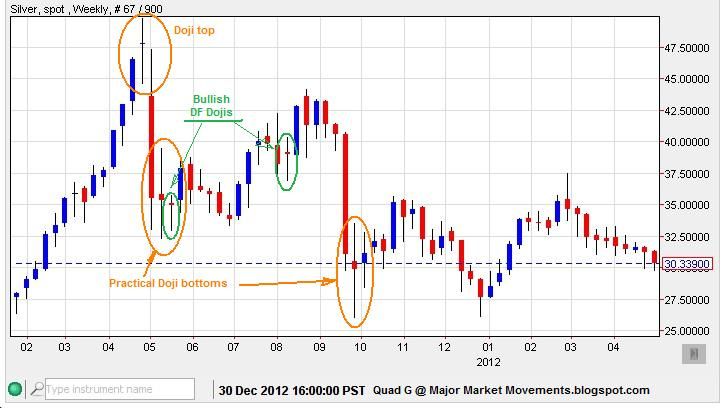
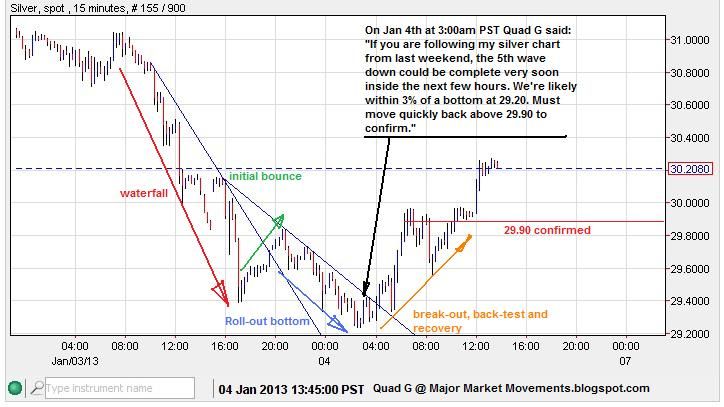
-Speculative signals based on the Elliot Wave Theory and Japanese Candlesticks.

-Continuous performance tracking of every entry, exit and stop-loss.

To subscribe, enter the email address below that you would like your updates to be delivered to. Make sure to add quadg343@gmail.com to your contact list, as some programs may flag QG3 Market Signal Service updates as junk or spam. Subscriptions are re-occurring on a monthly basis until canceled. No refunds will be permitted.


Delivery Email Address


To cancel your subscription click below:


Disclaimers can be read here: Major Market Movements disclaimer page

Sunday, January 27, 2013

MMM Weekend Update 1-27-13

Gold - Very much in a neutral position. A confluence of bullish and bearish indicators presents a muddled picture in the Short Term (ST).


A solid weekly candle closing at the bottom 10% of it's range gives about an 85% probability that further downside with occur this week.


However, even though there is plenty of technical excuse for more downside, keep these potential bullish developments in mind:


------------------------------------------------------------------------------------

Silver - Also in a neutral position but not as far off as Gold.


If Silver does not recover back above the green trendline soon and collapses through the critical supporting trendline (dashed red), a potential crash down to an initial target of 24.06 is possible:


------------------------------------------------------------------------------------

GDX - Had a solid push down last week into 'panic' territory in volume. The QG3 is bearish, so no reason to bottom pick just yet. It's prudent to keep hedges on, such as the ETF DUST. However, this could be a thrust down of a triangle, which is often the last move down before a reversal. We'll see.


------------------------------------------------------------------------------------

EURO - Keeps cruising higher as expected, but has set a ST critical support level at 1.3264


------------------------------------------------------------------------------------

Dow - Back in November I posted this potentially bearish scenario for the Dow:


However, the Dow did indeed post a weekly close clearly above the upper orange channel line:


Is this just an exuberant top? or a major break-out? all I can say for now is that the Dow is likely to run higher, as long as it remains above 13,650ish in the ST.


------------------------------------------------------------------------------------

In the next day or two, I should have the QG3 video up and running. It's been a frustrating process, but I finally have some of this video recording/editing business figured out.

I will also be posting my QG3 trading results next weekend, so far it has performed very nicely since December for multiple markets.

All the best,

QG


Sunday, January 20, 2013

MMM Weekend Update 1-20-13

Gold - Has been produced a rather choppy upside move last week, ending Friday with a small bearish hammer, leaving the current uptrend mired in uncertainty. Could it be a stealthy bullish run? or part of a bear flag? Here are the key levels to consider:


Weekly:


Strong weekly time fibo hit last week for a possible bottom:


I have been sending out free QG3 signals for Gold and Silver last week to those that have emailed me with interest. Also in the comment section of my blog posts and at my thread Major Market Movements at Kitcomm.com. My video is in the final editing stages, though taking much longer to complete than anticipated.

-------------------------------------------------------------------------------------

Silver - Ended the week much better than Gold:


Weekly:


-------------------------------------------------------------------------------------

Platinum - Could produce a strong break-out soon to the upside that could challenge 2100+, but MUST stay above 1511.25 in the MT:


Zoomed in:


-------------------------------------------------------------------------------------

Crude - The completion of wave (D) or something greater could be realized soon.

Previous chart from early December:


update:


-------------------------------------------------------------------------------------

USD - Currently boxed in between key support and resistance, a break of 79ish could invite a fall to 74ish:


------------------------------------------------------------------------------------

Soybeans - Produced a Bullish Harami candlestick pattern on the weekly. Follow through should keep above 1377 and challenge 1500 in the ST.


-------------------------------------------------------------------------------------

Good Hunting this week!

QG


Sunday, January 13, 2013

MMM Weekend Update 1-13-13

Gold - Has built a rare, but powerful 'Diamond' pattern. If the extremes of the pattern are exceeded the result is usually an impulsive move.


The QG3 is in a neutral alignment, flat, not bullish or bearish:


There are some fibo turn date windows just ahead.
- daily windows: From the open on Jan 14 to the close on Jan 18th. And the Feb 3rd open to the Feb. 6th close.
-Weekly window: Starting Sunday Jan. 13th till close on the 18th. So much greater potential for a turn next week than the single daily turn I posted back around December 18th which only spear headed a multi-day bounce. The weekly trend is certainly down into the window, so it's most likely a bottom.

-------------------------------------------------------------------------------------

Silver - Price remains below a key mid channel line that is posing resistance at the moment:


The QG3 is also neutral for silver:


-------------------------------------------------------------------------------------

EUR/USD - Moved as anticipated, after a successful back-test, the bounce back up to take out 1.3300 was swift, further upside to the target of 1.3580ish is expected. Key MT support is now at 1.3000.

-------------------------------------------------------------------------------------

USD/JPY - This impuslive run has exceeded expectations! WOW! It's possible to reconfigure the impulsive count, as several waves could be 'nested' providing for further upside:


zoomed out:


-------------------------------------------------------------------------------------

Coffee - I've been hunting for a major low in coffee for the past few months. Here is the primary reason why:

(click image for full view)


The ST gives a promising potential for a bottom, perhaps a major one:


-------------------------------------------------------------------------------------

Corn - I posted this chart on December 23rd, which had a support zone of 663 to 675 with an EW target of 682.


We saw a bullish bounce this week off that support zone:

Weekly chart


Daily chart


-------------------------------------------------------------------------------------

Wheat - Also showing signs of a potential reversal and bottom:


-------------------------------------------------------------------------------------

Soybeans - Posted a bullish dragon-fly doji on the daily chart, perhaps in sympathy with Corn's move last week. A reversal in the downtrend could be realized with a weekly close this week above 1415.62

-------------------------------------------------------------------------------------

My video about the QG3 (3/10/20 ribbon) is essentially complete, but requires some editing. It's very possible to be complete this week. The process of producing video is all very new to me, please pardon the delay as I hike up the learning curve.

Good Hunting :)

and GO SEAHAWKS!

QG

Sunday, January 6, 2013

MMM Weekend Update 1-6-13

Gold - Wow what a wild ride this week! I didn't expect a new low into secondary (and final). The FED meeting was able to jawbone down PoG. 'Scary words' caused some traders to flee. However, the end of the week rally has some promise of a potential recovery.


Other Hammer examples that provided support:


To confirm a bottom and reversal, gold needs to close this week at or above 1695.
What was ounce a straight forward EW count in gold, has turned into a mess, no comment for now.

Gold-JPY (yen) is also hinting at a break-out higher:


------------------------------------------------------------------------------------

Silver - Completed it's 5th wave down as expected, presenting a 'text-book' 5-3-5 corrective zig-zag pattern:


Silver must now stay above the lower channel line on a daily closing basis or risk collapse:


Silver also produced a bullish daily hammer setting a potential bottom at 29.23


The Weekly close in Silver presents possible bottoming action, but needs confirmation with a close this week above 32.31:


Other examples of doji tops and bottoms:


I made an intra-day call at www.Kitcomm.com early morning on 1-4-13 that played out very nicely:


More upside is likely in the ST:


------------------------------------------------------------------------------------

EUR/USD - Back test came as expected. If successful, price should rally back up above 1.3300 fairly soon, possibly this week. However, breaking keys support (orange trendline, currently below at 1.2961) could cause a collapse:


The recent top and back-test was fairly easy to identify:


-----------------------------------------------------------------------------------

Grains - Soybeans could have some serious downside, if price remains below 1433 much longer. The QG3 ribbon is still fully open to the downside, best to keep short at this time.


Corn hit support target range this week, but must rally back up above 684 or risk further downside.

Wheat still bearish while below 787.

------------------------------------------------------------------------------------

I'll be 'filming' my video next week. All my extensive back-testing of the QG3 (3/10/20 ribbon) is complete and looks very promising.

When my signal service and video are ready I will email those who have shown interest ASAP.

Happy hunting!