Sunday, July 28, 2013

MMM Weekend Update 7-28-13

Gold - The previous MT EW count that suggested the current rise off of 1180.20 may have been a sharp wave (iv) green advance has been killed with a wave 1/4 violation above key resistance of 1337.94+ which is the price territory of wave (i). This changes the EW count in favor of some other more bullish counts. There is still another bearish EW count that could account for a dive to below 1180.20, but the price would need to sink below 1240ish before that probability increased.


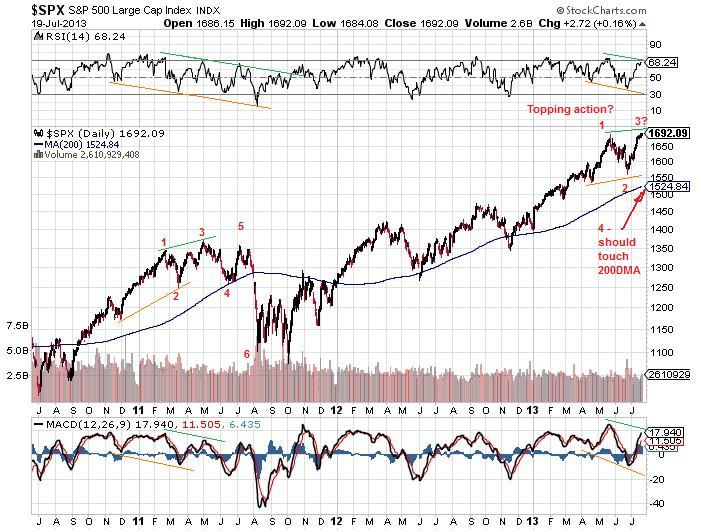
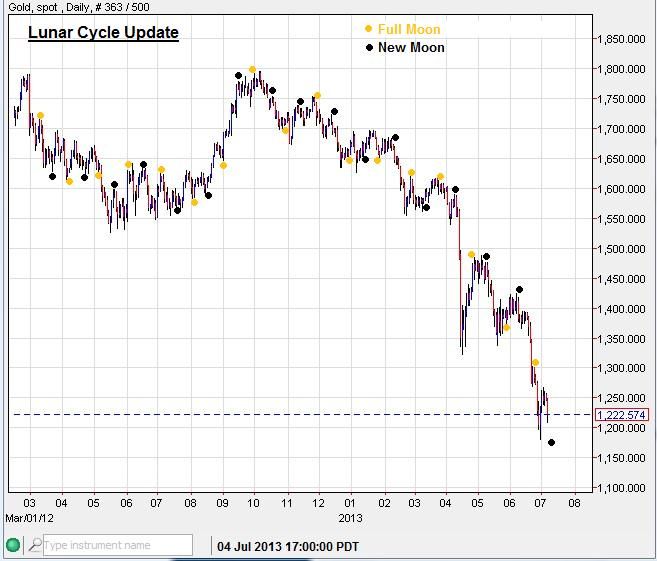
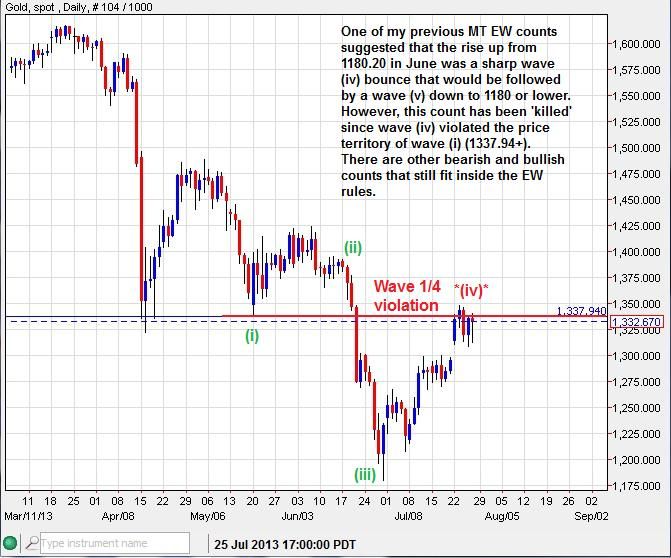
Here is an EW ST update:
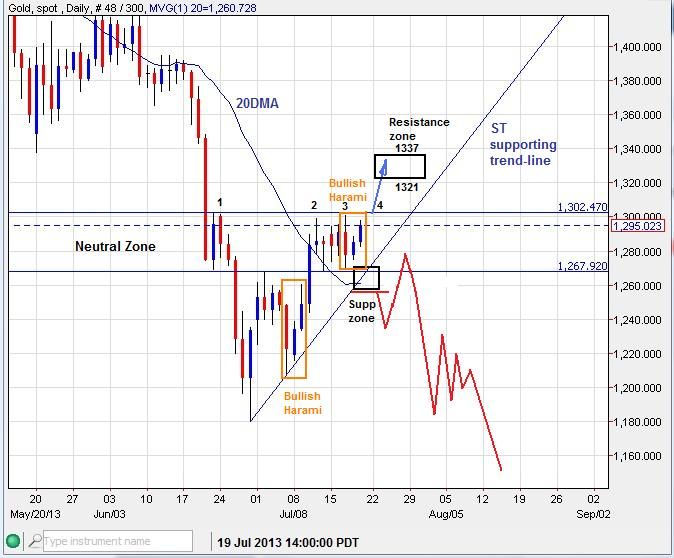
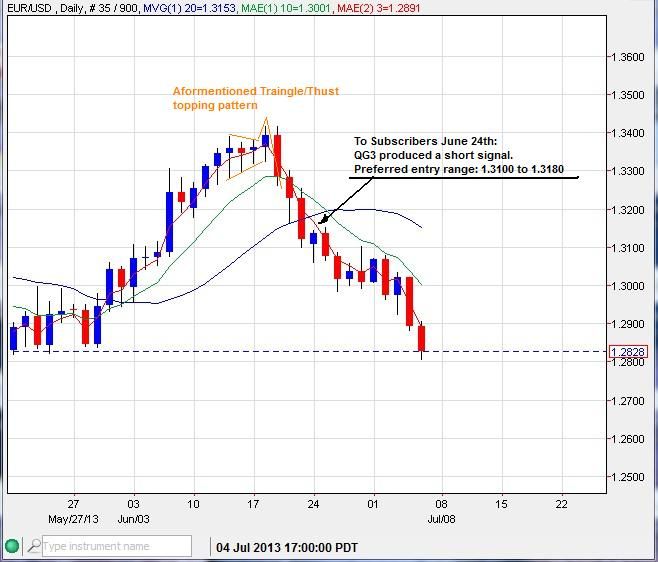
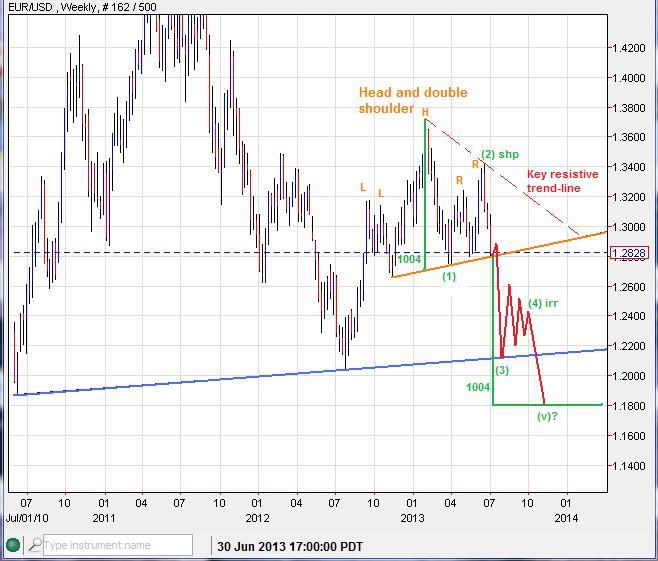
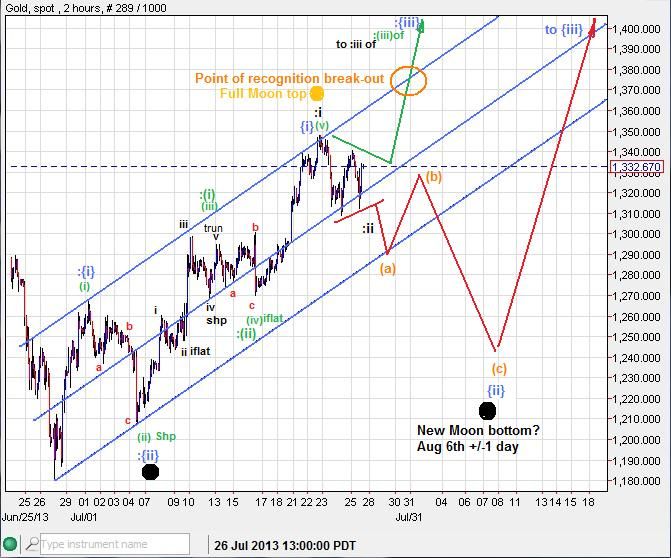
The primary count suggests that the Full-moon top will hold and a 3 wave pull-back toward the next new moon could be seen over the next several trading days. The alternative (:colon) is far more bullish, but has some hurdles to jump over before coming into favor.


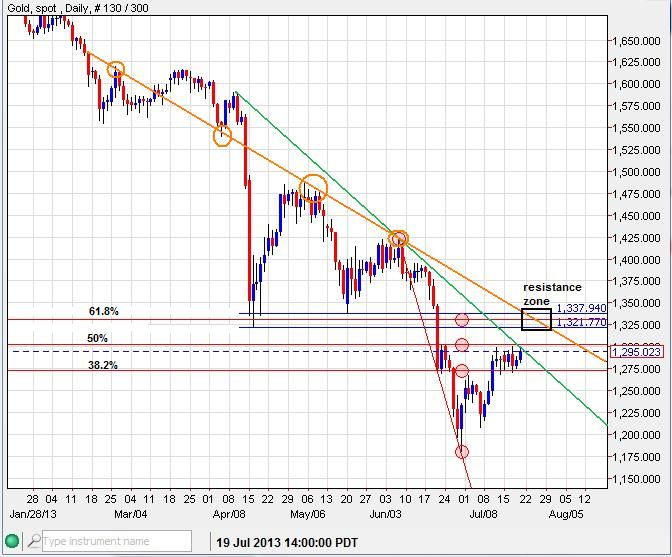
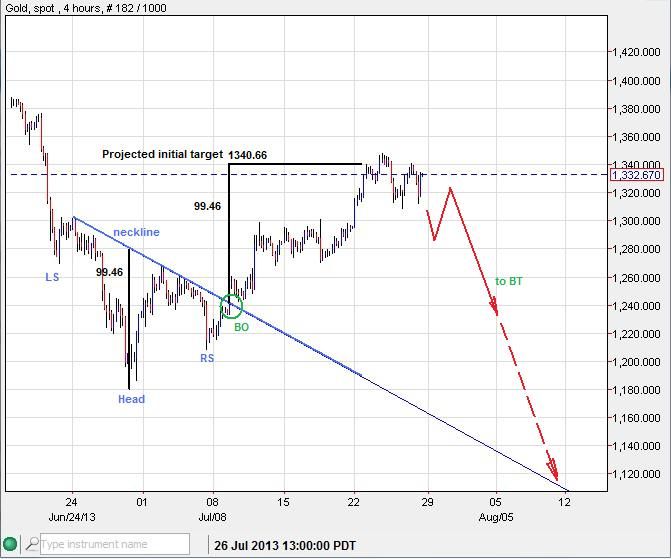
An iHnS pattern, highly 'skewed,' measured for a rough top fairly well. If the top holds, the Break-out of the neckline and even the neckline itself could get a back-test soon.


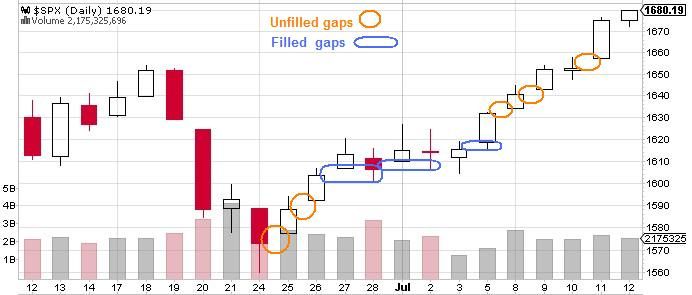
The New York market is the top dog of all the markets around the world. Seldom does a price move extend beyond NYs attention for very long. I typically gauge the NY market to be between the hours of 8am to 5pm EST. This is the span of time that the NY marketeers holds their chance to influence the gold market for the daily session. When the price moves through territory that NY has not had a chance to weigh in on, the tendency is for the market to eventually correct back into that price territory that I dub the NY 'dead space' during the NY time frame. NY doesn't like to be kept 'out of the loop'. So when you see an over night move run into new price territory, either up or down, know that the probabilities favor a return to that price territory later on during the NY hours.

Here is an example:


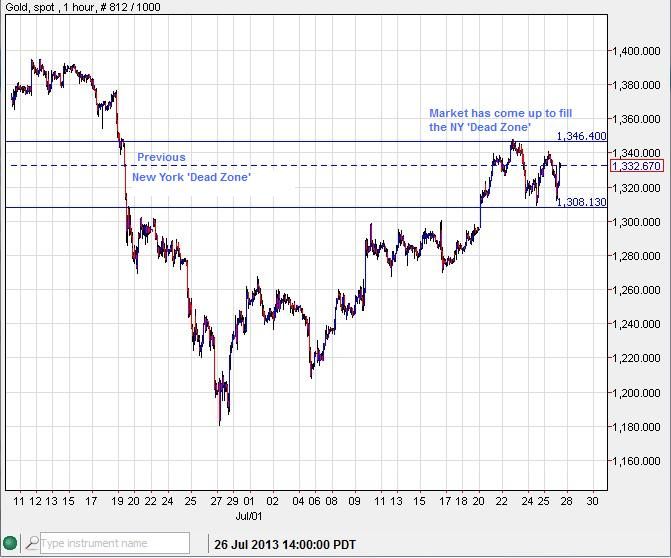
As you can see the over-night market made a big splash one day, leaving a void or Dead Zone that eventually was filled during NY hours. It looks as though NY has been comfortable with its new range now for a few days.

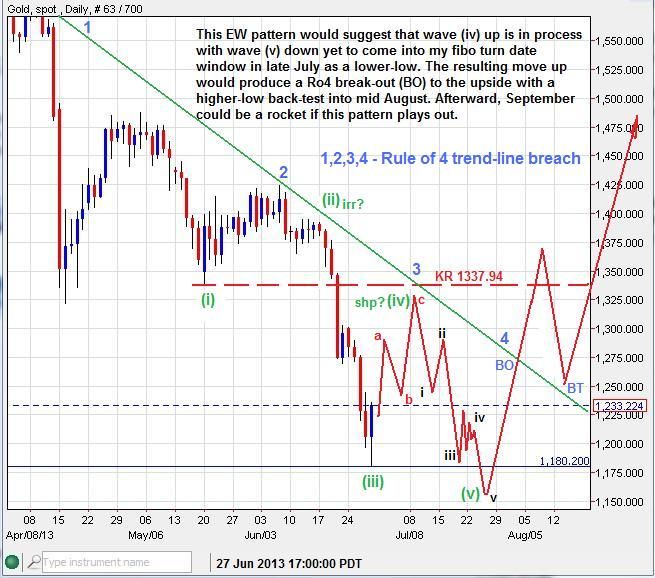
I recently spotted for my subscribers a ST top in Gold's price at 1347ish after observing a 4hr time scale 'hairy top':


---------------------------------------------------------------------------------------------------------------------------------
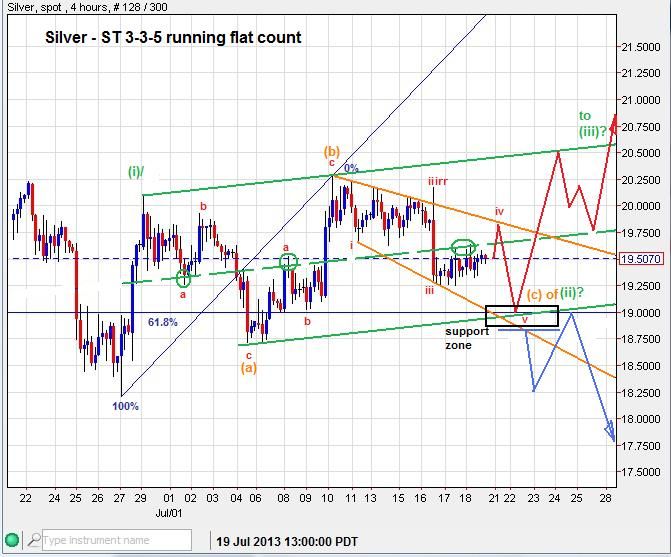
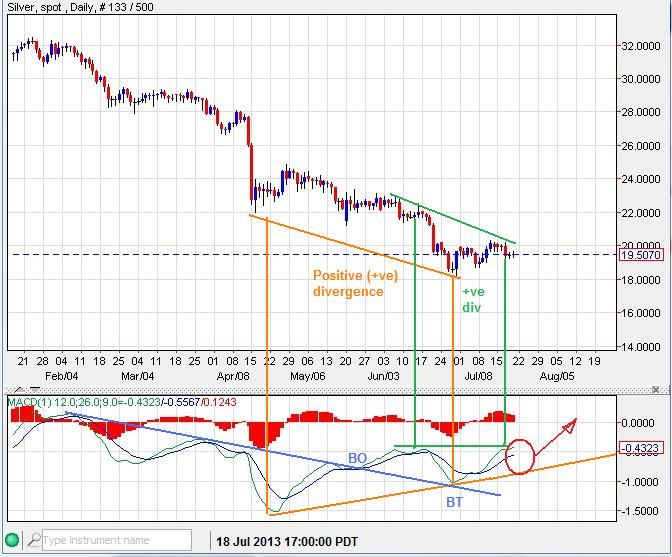
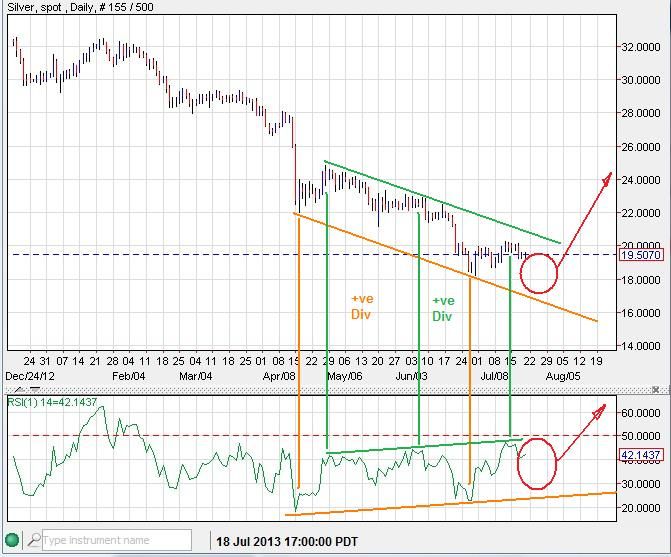
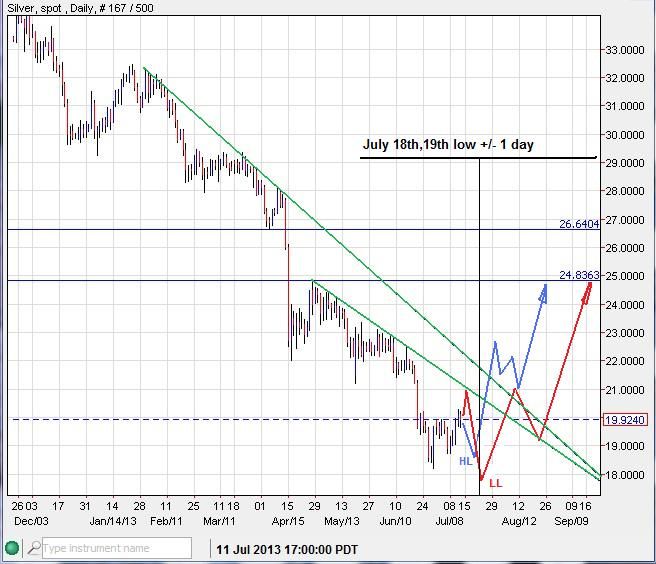
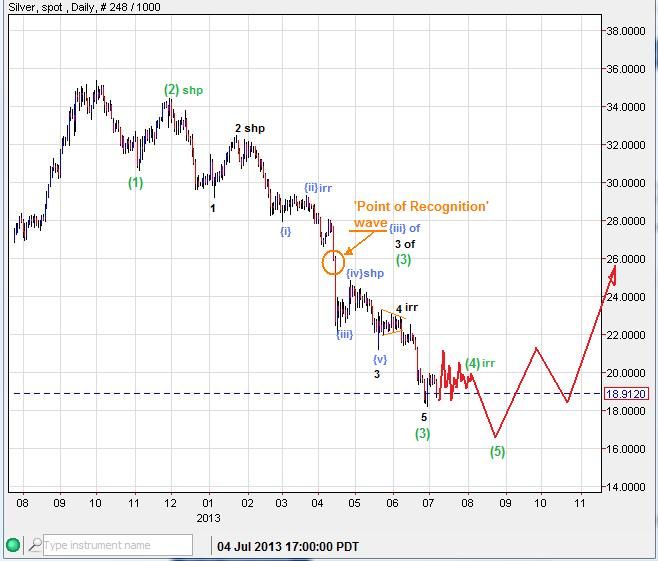
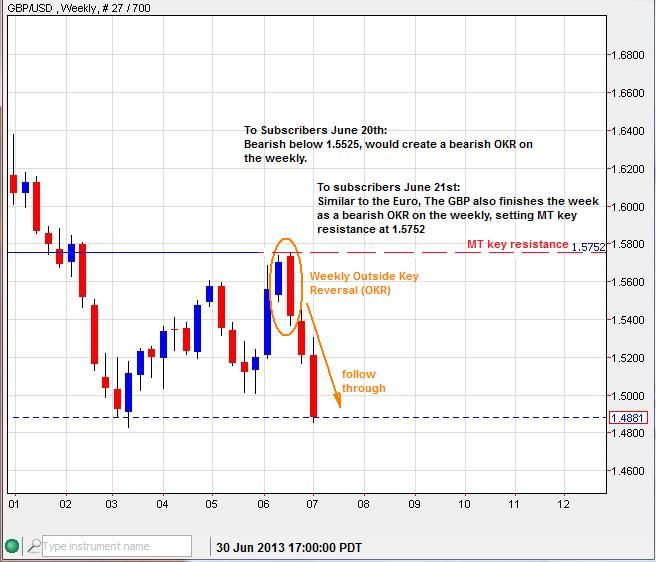
Silver - Not looking as hot as gold or GDX, leaving the whole PM complex in a quandary going into next week. The weekly closed as a bearish inverted hammer candle, setting key resistance at 20.60:


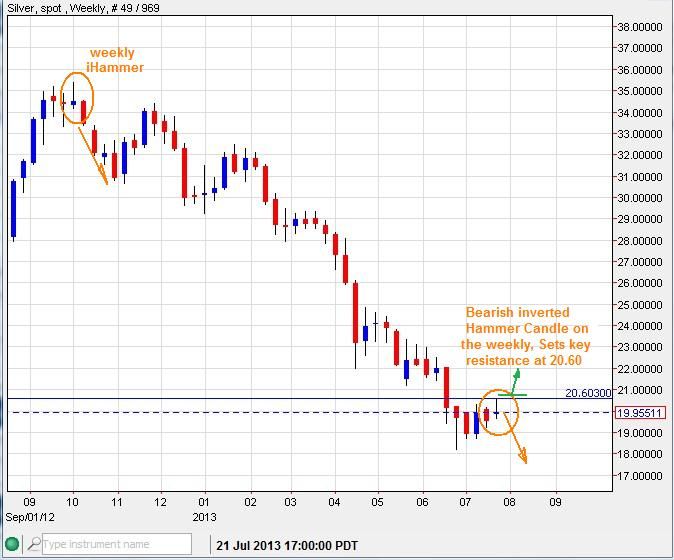
Weekly candles can often be responsible for moves that last at least a couple weeks, this would suggest that further selling is likely while below 20.60. If 20.60 is breached then another short squeeze could be realized.

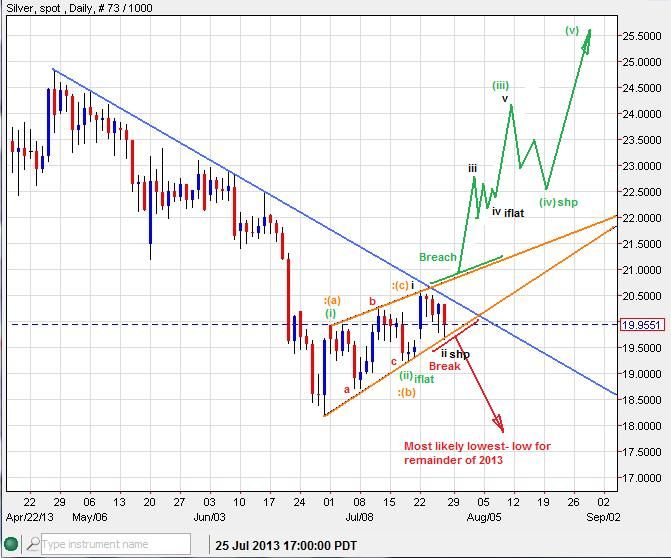
The Silver EW count has a bullish and bearish option, both with their own unique set of qualifiers.


---------------------------------------------------------------------------------------------------------------------------------

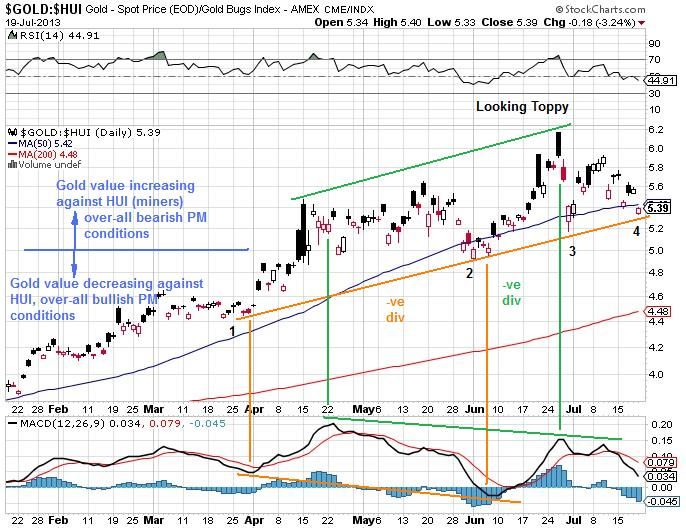
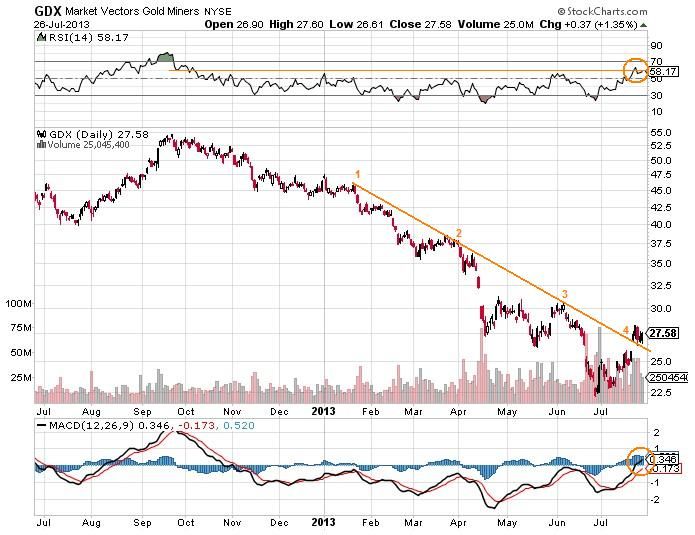
GDX - The miners have produced a Rule of 4 (Ro4) breach to the upside, with price currently riding above the break-out line. The oscillators RSI and MACD have also moved above some key levels. The MACD has moved above its zero line for the first time in months. And the RSI has moved above its 60 line. This all suggests that this market is in recovery. Even if this market was to fall again to a lower-low, I see it as another gift of a buying opportunity for the next MT bull run.


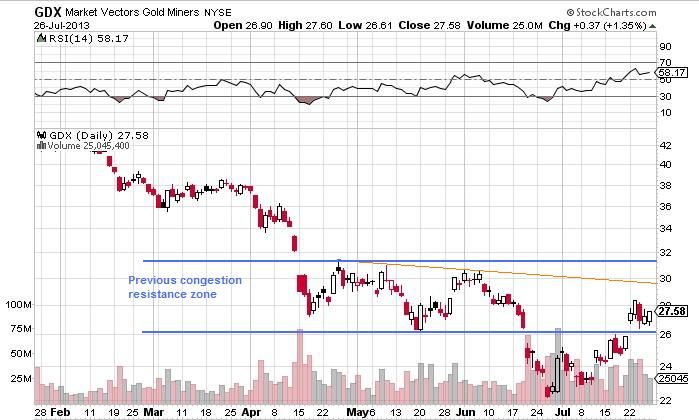
For now, in the ST, GDX is tangling with the resistance posed by the previous congestion zone.


----------------------------------------------------------------------------------------------------------------------------------

AUD/USD - Has a full count to the downside and is working on rolling out into a recovery:


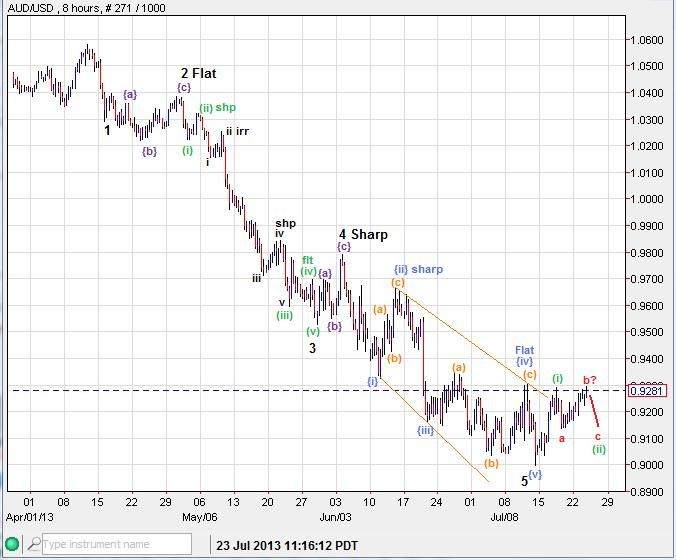
The price has also performed a Break-out and Back-test, this market is poised to move upward while above .9128


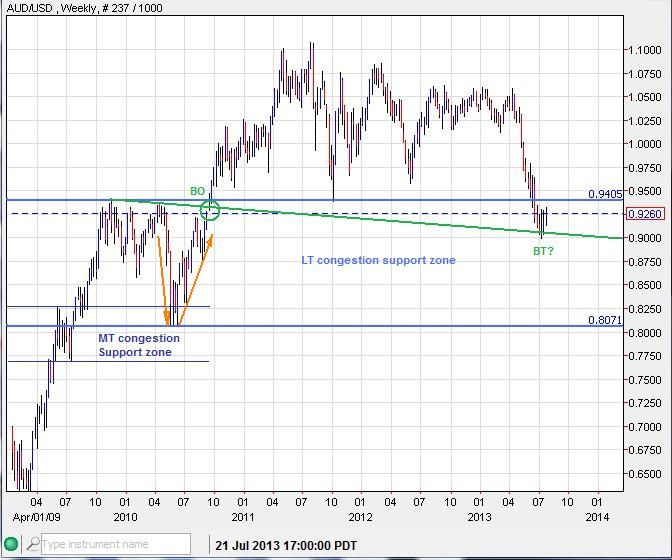
The Long term chart shows that price has come down to back-test an old break-out line inside a previous congestion support zone:


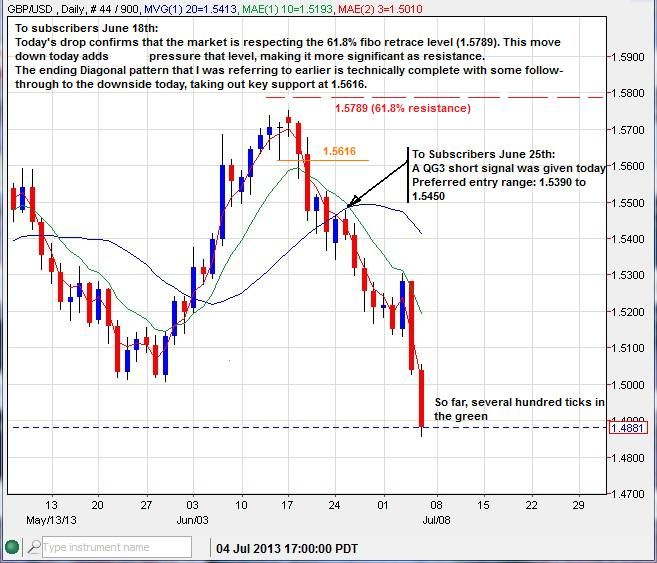
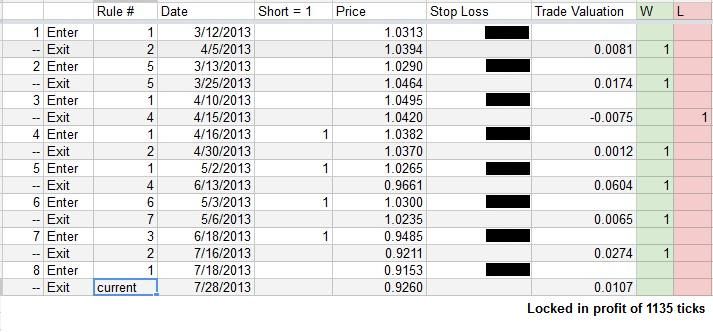
My QG3 trading method has produced some excellent results in this market since I took on the Aussie back in March. So far there has been about 1135 ticks of profit that have been locked in. One contract with an initial margin of $2,013 would have profited about $11,350 in just a few months (minus roll-over and broker fees).


Much of which was due to the QG3 signaling subscribers to get in on the short side of this 'major market movement', keeping them in for most of the way down:


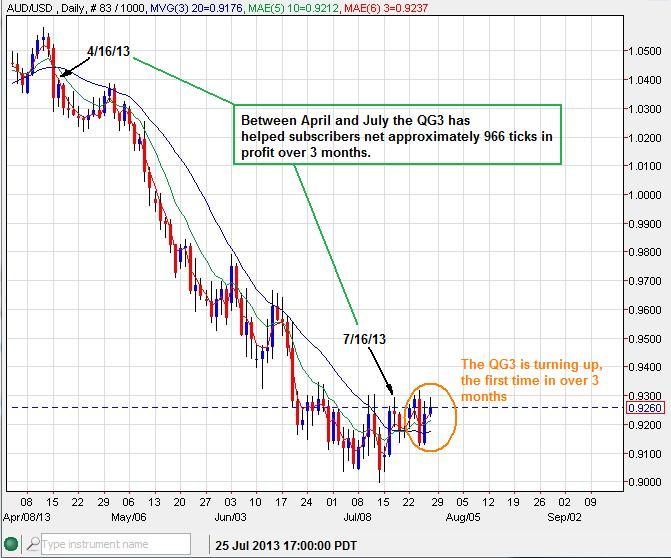
The QG3 trading method has now signaled to get prepared for the possibly of a long side advance.

If you are a trader and would like to receive my daily market updates, you may sign up here:
http://majormarketmovements.blogspot.com/p/mmm-market-signal.html


All the best to you this week,
Quad G


Sunday, July 21, 2013

MMM Weekend Update 7-21-13

Gold - Has been consolidating trend-less inside a tedious neutral zone (1267 to 1302) for the past several days. This gives us little direction as to whether the Fibo turn date window from 7/18 to 7/23 is indicating a top or a bottom. Either way, tension is building and should let loose with a trending impulse soon out of the current neutral zone.

Here are the current ST support and resistance zones defined:


Gold and silver are developing positive (+ve) divergences in the MACD and RSI oscillators. However, it is important to understand the different modes that a bullish or bearish trend exhibits in the RSI.

When a market is in a bull trend, the 30-40 line on the daily RSI usually act as support and the 70 to 80 line act as resistance, with 80+ an indication of severe over bought condition. Shown here:


When a market is in a bear trend, the 50 to 60 line act as resistance and the 20 to 30 line act as support, with sub 20 an indication of severe over-sold condition. Shown here:


Once the 30-40 zone starts to become support again and we see incursions above 60 and into the 70-80 zone, it should be a good indication that the MT trend has changed to bullish. I expect to see this switch become evident by September at the latest.

---------------------------------------------------------------------------------------------------------------------------------------

Silver - There are multiple EW counts that I can see that fall within the rules, but this one in particular caught my eye as a possibility:

One more ST low into a support zone around 19.00ish then an impulse up should move above 20.29 in one shot. If the support zone doesn't hold, then another trend down to a lower-low than 18.20 could be realized.


Positive divergences are building in silver, even another lower-low than 18.20 would likely only strengthen the bottoming pattern at this time.

MACD:


RSI:


--------------------------------------------------------------------------------------------------------------------------------------

Gold/HUI ratio - This ratio is looking toppy, which means that a significant bottom in the PM complex (gold, silver miners) is very close.
Mining stocks generally anticipate forward price increases in gold and silver as investors attempt to add leverage with the purchase of over-sold mining shares.

Long term:


The current Mid-term trend is being supported by a multi-month trend-line. This trend-line is being tested for the 4th time, which suggests that a break of that support could come very soon. This would likely lead to an upward surge in mining stock prices outpacing any rise in gold prices. Over-all a bullish result for the PM complex.


GDX is also reflecting the same bullish rule of 4 break-out potential, as +ve divergences are built:


-------------------------------------------------------------------------------------------------------------------------------------

S&P 500 - I spotted this fractal top that could be playing out, currently on step 3 (up) before step 4 (down) to test the 200DMA in the weeks ahead. Topping action could be seen early this week.


The Nikkei and USD/JPY could be leading the way with their own topping action.

-------------------------------------------------------------------------------------------------------------------------------------

If you are interested in receiving my daily email updates you may sign up here:
http://majormarketmovements.blogspot.com/p/mmm-market-signal.html


Good Hunting,
QG

Sunday, July 14, 2013

MMM Weekend Update 7-14-13

Gold - Back in early June I recognized that the 21-22 month cycle has likely converted to a peak to trough cycle. The trough measures to a span in June/July. Using the weekly time fibo tool, I found most measures landed on next week, the week of July 14th. There was also an outside chance that the fibo turn week could be in the week starting July 21st. This has narrowed the June/July span to within 1-2weeks. That cycle and time fibo work can be seen here:
http://majormarketmovements.blogspot.com/2013/06/mmm-weekend-update-6-9-13.html

But even 1-2 weeks is not a very effective range to trade. Now that we are on the threshold of the Fibo turn week, I can use the daily time fibo tool to help narrow down the turn to with in a few days. Most daily measures point to July 18th and July 19th +/- 1 day, with an outside chance of July 22nd to 23rd. The Full moon also present on July 22nd. The current ST trend is so far going up into these dates, while the MT trend is down. It is possible that the ST trend could reverse early this week and start heading back down into the turn dates. This condition would be most welcome for finding a significant bottom. If the ST trend continues to march upward into this turn date window, then it will make the cycle and wave structure a little more complicated.

The July 18th- 19th +/- 1day turn date window would span the close on July 17th to the open on the 23rd as non-trading day weekends are not counted. So if the ST trend moves down into this time frame, it increases the likelihood that a bottom will be realized. If however, the current ST trend moves up into this time frame, the chances increase for a significant top.

I also did some new monthly time fibo measures that I have not typically done, but wish I had. Multiple measures point to a Bottom in June! Could it be that the bottom is already in, and the July Weekly turn is just a higher-low? Could be, judge for yourself.


Now you might be thinking - "Quad, seriously, monthly 'time fibos' what kinda techno-hokum is that?!?!" Well, all I can say is, I wish I would have been paying more attention to them last October, as a the measures lined up perfectly for a top:


Here is one additional weekly time fibo measure:


And now the daily time fibo measures:


Here are a couple ST EW counts that could account for a higher-low, which would respect that June bottom and a lower-low that would violate the June bottom (1180.20) but most likely only 1-3% lower. Both counts have key support/resistance levels of 1267.92, 1298.89 and 1337.94. If the price exceeds 1337.94 before any bottom is printed, then the MT EW count changes, as this would be a wave (i)/(iv) violation:


Now I seriously doubt that FED chairman Bernanke fills his day-planner using time fibos. But I do find is extraordinarily uncanny that he is scheduled to testify this coming July 17th and 18th. Talk about coincidence.


---------------------------------------------------------------------------------------------------------------------------------

Silver - Will likely bottom (or top) roughly the same time as gold. Here is what that price action could look like as a bottom moving down into the fibo turn date window:


--------------------------------------------------------------------------------------------------------------------------------

The S&P500 has been shooting up rapidly, no doubt fueled by some short covering as key resistance levels were popped. However, the trail left behind is problematic, as multiple gaps up leave a mess behind. The markets may seem chaotic at times, but they are usually very good at 'cleaning' up their messes after the party is over. So I fully expect that this 'gap happy' run will exhaust itself and fall back to fill in these gaps left behind.


Strong, organized up-trends that methodically inch up day by day generally have the fortitude to last much longer:


-------------------------------------------------------------------------------------------------------------------------------

There are a plethora of different technical tools that can help guide a trader to make decisions. Having learned many of them, I have isolated the few tools that generally give the highest probabilities of producing tops and bottoms. If you are interested in receiving as well as learning about these valuable tools, you may subscribe to my daily email updates here:

http://majormarketmovements.blogspot.com/p/mmm-market-signal.html

Good Hunting,
QG


Sunday, July 7, 2013

MMM QG3 Model Portfolio Update 7-7-13

This is an update showing the current performance results of an on going model portfolio using the QG3 trading method which is the primary focus of my Market Signal Service. Results are cumulative from December 2012 to the close of 7-5-13.

Metals Portfolio:


Forex Portfolio:


100k Model Portfolio:


If you are interested in taking advantage of the QG3 swing-trading method, I provide QG3 signals as part of my market signal service. Subscribe here for daily email updates: http://majormarketmovements.blogspot.com/p/mmm-market-signal.html

Past performance is not necessarily indicative of future results.

Quad G

MMM Weekend Update 7-7-13

Gold - The moon cycle can often have a ST effect upon the markets. Gold in particular, as you will see, has been under a 'dark moon' for many months now. Since September 2012, The greater majority of new moons have marked ST tops in gold. The current iteration that is centered on July 8th (+/- 1 day) has a trend that is moving down into it. If a turn is realized early this week with a rise that moves up above 1267ish, the new moon has successfully marked a low.


Last week I was looking for an ABC move to the upside, with more time being spent on wave b down than expected, the wave c of (iv)green top may come later this month if 1180.20 holds as key support.

Previous chart:


Update:


These anticipated ST moves have been good for trading, approx $80+ in profits over 6 days.


------------------------------------------------------------------------------------------------------------------------------------------

Silver - My MT EW count suggests that Silver is working on an irregular, possibly a triangle, 4th wave correction. Afterward a final 5th down could finish the impulse down from October 2012. After a bottom is placed, I would expect at a minimum, a 3 legged move up to back-test the 3rd of a 3rd 'point of recognition' break-down.


-----------------------------------------------------------------------------------------------------------------------------------------

EUR-USD - This market has been in a well anticipated bearish mode since the previously identified triangle/thrust topping action with weekly OKR follow-though to the downside.


The QG3 MT swing trade signal also turned bearish, providing a Short signal.


The neckline of a bearish Head and double shoulder pattern was tested last week, a break of which should calculated as a projected target of 1.1800ish. Subscribers are well positioned to take advantage of such a bearish outcome.


---------------------------------------------------------------------------------------------------------------------------------------

GBP-USD - The Pound is being pounded, as expected. Elliot wave, Candlesticks and QG3 all lent a helping hand in positioning subscribers on the short side of this market. Several hundred ticks in the green now.


--------------------------------------------------------------------------------------------------------------------------------------

If you are a trader and would like to learn how to take advantage of the signals that provide the greatest probabilities for successful trading, consider signing up for a 15 day free trail to my email newsletter and upcoming new website forum and chart library.
Subscribe here: http://majormarketmovements.blogspot.com/p/mmm-market-signal.html

I will also be posting my quarterly QG3 results later today. Since December 2012 the QG3 model portfolio is up 210%

Have a great week,
Quad G