The new Major Market Movements fully featured website, including blog, forum and chart school is up and running!
You can find it here: www.MajorMarketMovements.com
I want to thank all my subscribers and supporters over the years. It has been your interest in charting and technical analysis of markets that have spurred me on to create a place for traders to come together to focus on the technical methods that are so often responsible for 'Major Market Moves'.
This BlogSpot site will still be left open as an archive, but no new content will be generated on this site. All new blog posts will be posted at the new website under the 'Blog' tab. I will also be posting more frequently, not just on the weekends.
All the best to you and thanks again,
Quad G
Tuesday, September 10, 2013
Sunday, September 8, 2013
MMM is Moving
My Faithful Audience,
My new website is currently under construction, being tested, and very close to launch! Therefore the Weekend Update will be postponed, if all goes well the next blog update will be at the new site.
I will keep you posted here about the transition, which may come inside the next few days.
All the best,
Quad G
...
Sunday, September 1, 2013
MMM Weekend Update 9-1-13
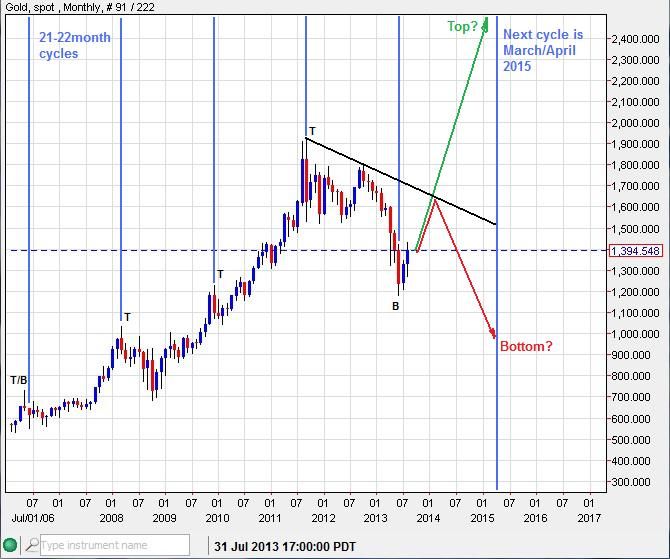
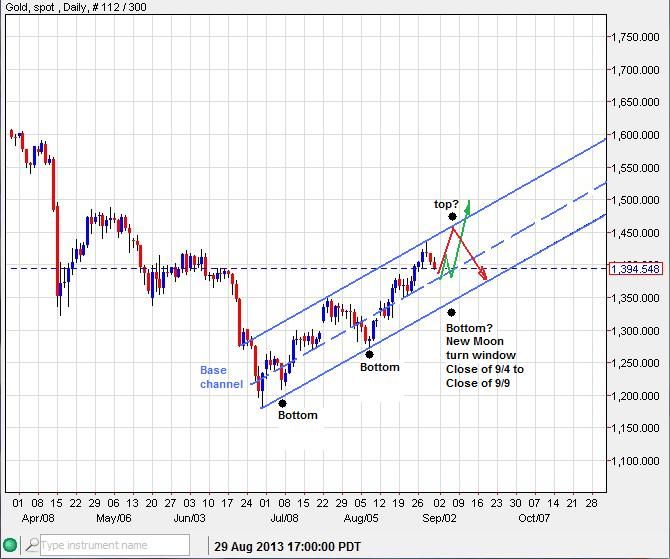
Gold - The impulsive moves higher over the past few weeks have certainly confirmed that the aforementioned 21-22month cycle is certainly logging in a significant bottom similar to significant tops in the past. The next iteration comes in the spring of 2015 (March/April). The MT trend moving into that cycle will determine if it will be a cycle top or bottom. I suspect that if the price stays under the primary down trend-line above (black) in the coming weeks, the next cycle will likely be a low.

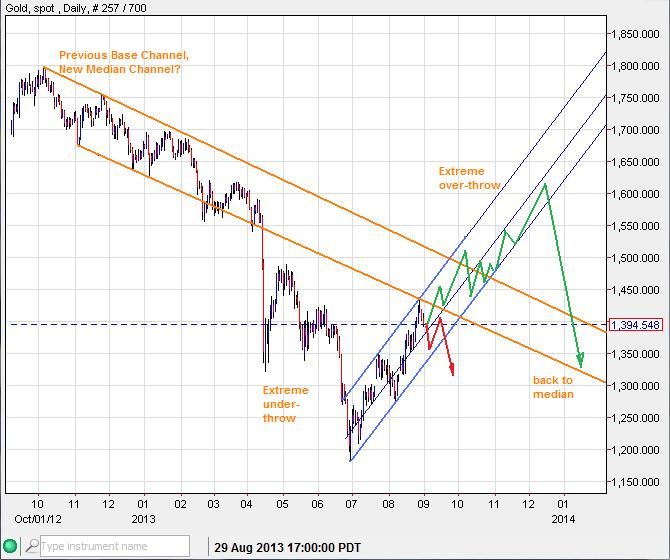
The price has fallen back this past week after bumping into the previous base channel. This base channel could become a median channel. We've already seen the acceleration channel down into an extreme under-throw. The current move up could be an extreme over-throw taking place before the trend settles back down into the median at a later time. A premature break-down below (red) of the current up channel (blue) would disrupt this scenario.

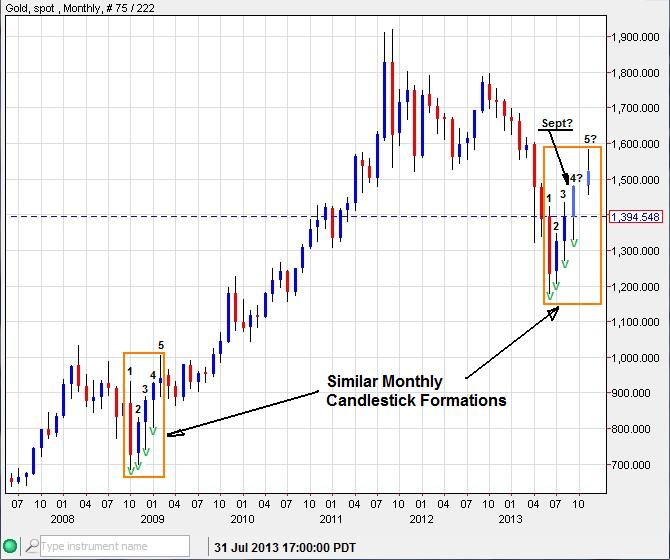
The Monthly close last Friday is uncannily familiar to the monthly candlestick pattern that developed back during the 2008 bottom. If the same type of pattern were to repeat, this September should see a higher-low (green V) and then close the month higher than August.

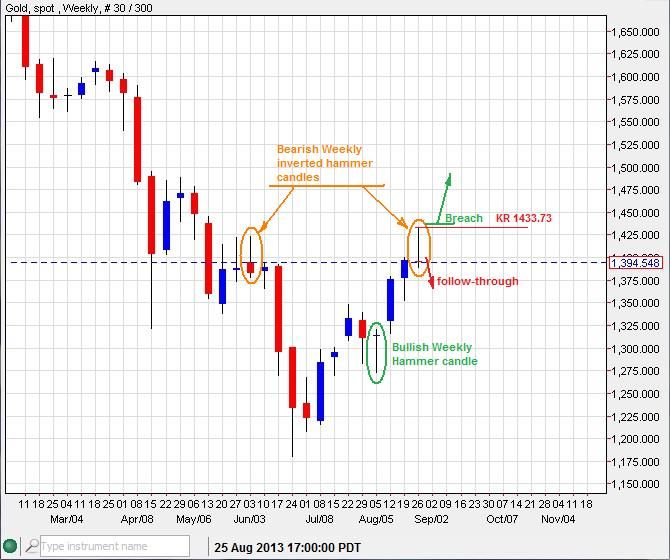
The last weeks candle closed bearish, printing an inverted hammer candle. This suggests that follow-through to the downside is expected this week. Can hammer candles be breached? Sure they can, and when they do they can often produce an impulsive shot in the corresponding direction.

The New Moon cycle is also coming into play this week, opening up a turn window between the close on Sept 4th to the close on Sept 9th. If the ST trend remains down into this turn date window the chances are likely that a bottom will form. The opposite is also true, if the ST trend is up into that turn window it could form a top. So particular attention needs to be payed to the attitude of the trend moving into this New Moon cycle. The last two New Moon cycles nailed a bottom, could we have a three-peat?

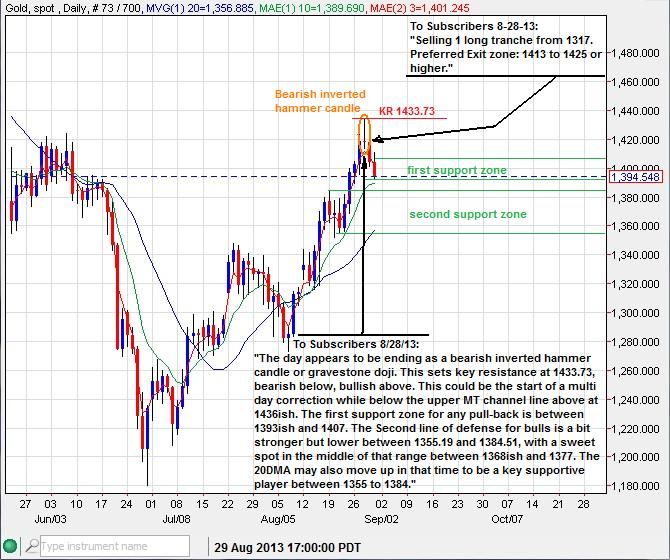
A daily inverted hammer candle on August 28th alert my subscribers and I to the potential of a profit taking sell-off in the making. This was a good ST spec signal to take profit, lightening up on previous buys.

--------------------------------------------------------------------------------------------------------------------
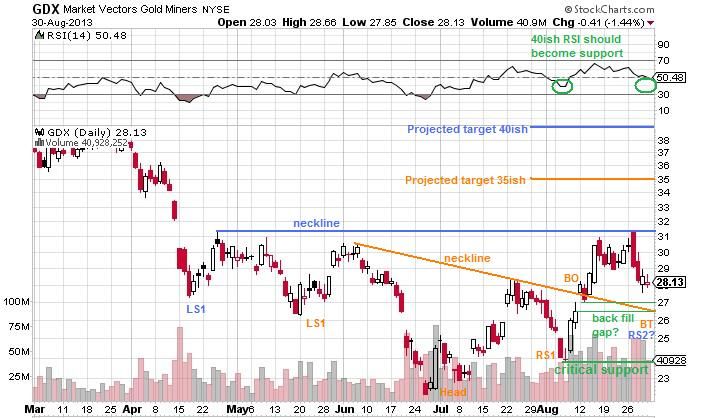
GDX - Miners are very close to finishing some unfinished business this week, back-testing the previous break-out of a neckline (orange) and back filling a gap left behind. If Bulls want more of this market this would be the place to see them buy it up. The 40ish line of the Daily RSI(14) is often support when the market is MT bullish. A resulting move higher would aim for initial targets of 35 and 40, possibly much higher after that. If any of these supports are broken, then it would be a sign that bulls are AWOL.

-------------------------------------------------------------------------------------------------------------------
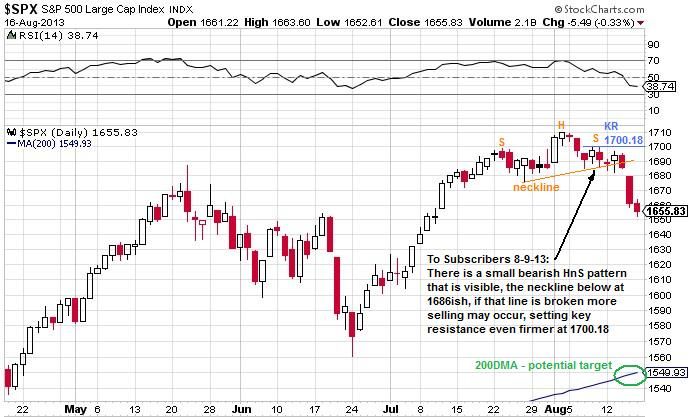
SPX - The S&P 500 is still in an impulsive trend to the downside. The 200DMA and an upward sloping trend-line (orange) become potential targets. I would also expect to see 30 or lower visited on the RSI (14). These targets look likely to be hit this month with a subsequent rise thereafter. A gap down was left behind, this could be filled later in September or October.

------------------------------------------------------------------------------------------------------------------
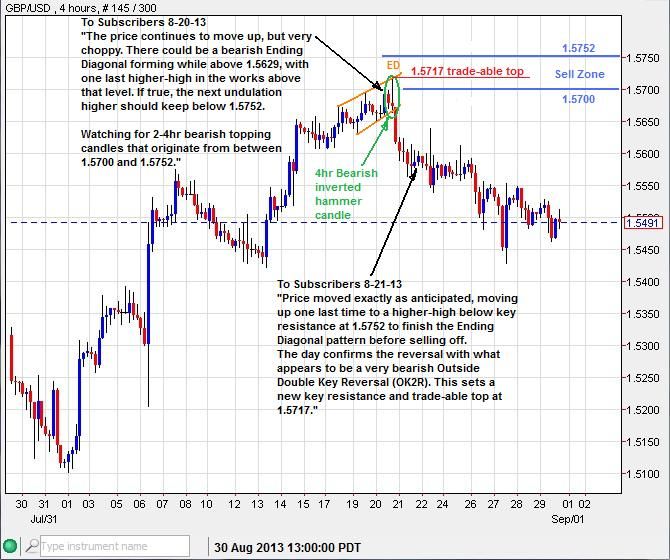
GBP/USD - Produced a textbook ending diagonal just below key resistance, producing a sizable and profitable reversal. Subscribers got the warning ahead of time.

-----------------------------------------------------------------------------------------------------------------
If you are a trader interested in learning and using useful technical tools, sign up for the MMM subscription service where I provide daily email updates on various markets.
Sigh up here:
http://majormarketmovements.blogspot.com/p/mmm-market-signal.html
Good Hunting,
Quad G
The price has fallen back this past week after bumping into the previous base channel. This base channel could become a median channel. We've already seen the acceleration channel down into an extreme under-throw. The current move up could be an extreme over-throw taking place before the trend settles back down into the median at a later time. A premature break-down below (red) of the current up channel (blue) would disrupt this scenario.
The Monthly close last Friday is uncannily familiar to the monthly candlestick pattern that developed back during the 2008 bottom. If the same type of pattern were to repeat, this September should see a higher-low (green V) and then close the month higher than August.
The last weeks candle closed bearish, printing an inverted hammer candle. This suggests that follow-through to the downside is expected this week. Can hammer candles be breached? Sure they can, and when they do they can often produce an impulsive shot in the corresponding direction.
The New Moon cycle is also coming into play this week, opening up a turn window between the close on Sept 4th to the close on Sept 9th. If the ST trend remains down into this turn date window the chances are likely that a bottom will form. The opposite is also true, if the ST trend is up into that turn window it could form a top. So particular attention needs to be payed to the attitude of the trend moving into this New Moon cycle. The last two New Moon cycles nailed a bottom, could we have a three-peat?
A daily inverted hammer candle on August 28th alert my subscribers and I to the potential of a profit taking sell-off in the making. This was a good ST spec signal to take profit, lightening up on previous buys.
--------------------------------------------------------------------------------------------------------------------
GDX - Miners are very close to finishing some unfinished business this week, back-testing the previous break-out of a neckline (orange) and back filling a gap left behind. If Bulls want more of this market this would be the place to see them buy it up. The 40ish line of the Daily RSI(14) is often support when the market is MT bullish. A resulting move higher would aim for initial targets of 35 and 40, possibly much higher after that. If any of these supports are broken, then it would be a sign that bulls are AWOL.
-------------------------------------------------------------------------------------------------------------------
SPX - The S&P 500 is still in an impulsive trend to the downside. The 200DMA and an upward sloping trend-line (orange) become potential targets. I would also expect to see 30 or lower visited on the RSI (14). These targets look likely to be hit this month with a subsequent rise thereafter. A gap down was left behind, this could be filled later in September or October.

------------------------------------------------------------------------------------------------------------------
GBP/USD - Produced a textbook ending diagonal just below key resistance, producing a sizable and profitable reversal. Subscribers got the warning ahead of time.
-----------------------------------------------------------------------------------------------------------------
If you are a trader interested in learning and using useful technical tools, sign up for the MMM subscription service where I provide daily email updates on various markets.
Sigh up here:
http://majormarketmovements.blogspot.com/p/mmm-market-signal.html
Good Hunting,
Quad G
Sunday, August 25, 2013
MMM Weekend Update 8-25-13
Gold - Several weeks ago in June I posted this LT chart with a Mega-Bear scenario looking for an end to wave (C) orange in the 1150 to 1280 zone. With price challenging the 1400, it looks like wave (C) is finished and now the price is working up into wave (X) orange toward the very key 'Thick Black Line', which is currently above at about 1691ish and falling. If this is a wave (X) advance it should be a sharp 3 wave correction upward.

Now some of you have been wondering if there is a Mega-Bull best case scenario. Of course there is, but the 'Thick Black Line' will need to be defeated first as the green arrow depicts. Here is the Best Case scenario that I can fathom once the TBL is trounced: A 5 wave impulsive advance to 1800+ for wave {1} will need to be realized. Followed by a couple sharp, but relatively small wave 2 corrections. Then comes the point of recognition, probably in the 2500 to 3500 zone, the price would just go steadily upward day after day, 1-3% at a time, with no looking back.

Here is what the wave structure looks like in log scale, you'll notice that the current correction is either a bullish under-throw or just the start of a more drawn out correction. Until the TBL is defeated I favor further correction (red projection)at this time, eventually dropping down to the previous wave 3-4 zone and possibly the LT 61.8% fibo retrace (889ish):

I do not recommend that you base ANY long term investing decisions base on these long term scenarios. If you are a long term investor in precious metals the best plan is to continue averaging in purchases over time. Betting the farm on a EW projection is typically not the best course of action. MT and ST paper trading is different, you have greater flexibility and can maneuver an account with greater dexterity capitalizing on swings up and down with the advantage of using stops. You can't place a stop-loss on a 1oz American Gold Eagle in your hand, though you can employ hedging using a paper trading account.
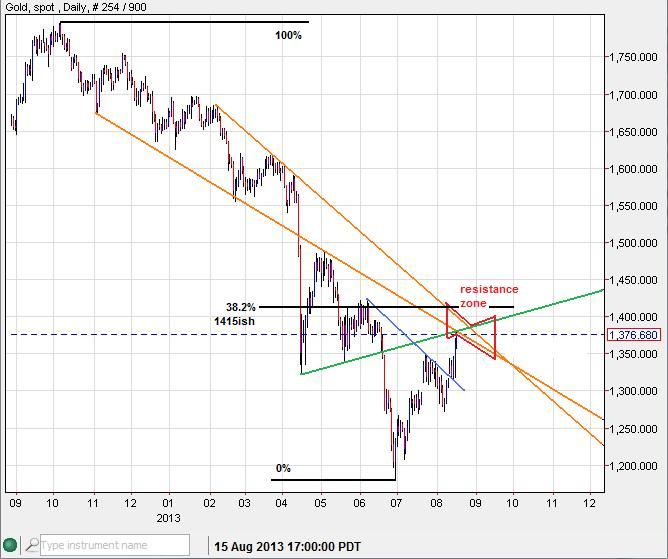
Currently PoG is coming up to test several lines of potential resistance:


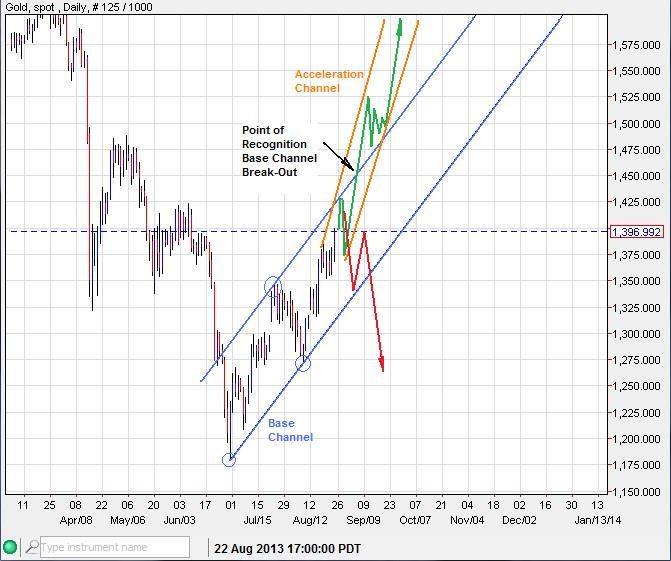
Gold is still inside its base channel. This means the the current 3 legged advance up from 1180.20 could be just a corrective wave. What would set this upward wave structure apart as an impulsive rise would be to have the price move above its base channel and form a new acceleration channel (orange), no doubt generating a point of recognition. The Key MT support level at this time is 1352ish.

-----------------------------------------------------------------------------------------------------------------------------
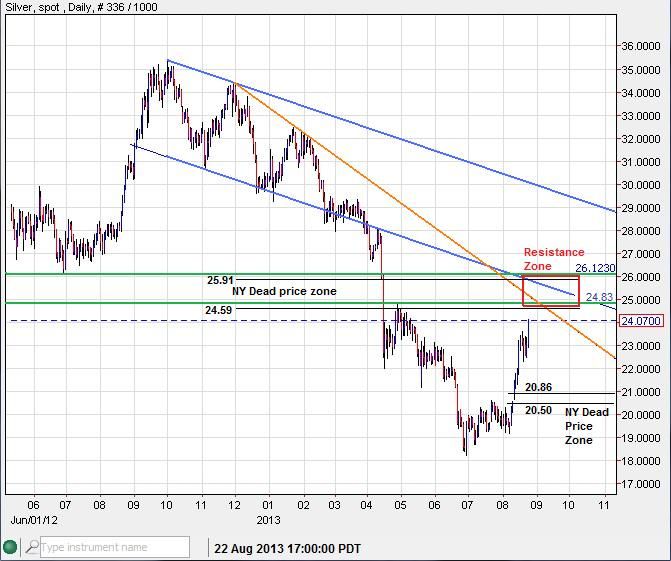
Silver - Is much further ahead than gold, having already broken its base channel (blue), headlong up into its acceleration channel (orange):

Silver is also about to knock on a MT fibo retrace level of 38.2% (24.77ish), as well as test some other resistive trend lines which form a resistance zone. This would be the place to watch for daily topping candles such as an inverted hammer, OKR or bearish Harami. Further ascent this week may also give the New York trading hours another crack at the 24.59 to 25.91 Dead zone, which has not traded in the NY time frame. Keep in mind that this rapid climb has left behind a NY Dead zone below at 20.50ish to 20.86. The market often despises a vacuum.


----------------------------------------------------------------------------------------------------------------------------
If your paper trading could use a technical boost, consider signing up for the Major Market Movement subscription service where you will receive my daily updates that cover multiple technical modes including the QG3 trend following indicator, Elliot Wave, candlesticks, trend-lines and patterns. Also, I will soon be launching (early September) a new fully featured website with chart libraries, forum and frequent blog updates.
Sign up here:
http://majormarketmovements.blogspot.com/p/mmm-market-signal.html
Good Hunting,
Quad G

Now some of you have been wondering if there is a Mega-Bull best case scenario. Of course there is, but the 'Thick Black Line' will need to be defeated first as the green arrow depicts. Here is the Best Case scenario that I can fathom once the TBL is trounced: A 5 wave impulsive advance to 1800+ for wave {1} will need to be realized. Followed by a couple sharp, but relatively small wave 2 corrections. Then comes the point of recognition, probably in the 2500 to 3500 zone, the price would just go steadily upward day after day, 1-3% at a time, with no looking back.

Here is what the wave structure looks like in log scale, you'll notice that the current correction is either a bullish under-throw or just the start of a more drawn out correction. Until the TBL is defeated I favor further correction (red projection)at this time, eventually dropping down to the previous wave 3-4 zone and possibly the LT 61.8% fibo retrace (889ish):

I do not recommend that you base ANY long term investing decisions base on these long term scenarios. If you are a long term investor in precious metals the best plan is to continue averaging in purchases over time. Betting the farm on a EW projection is typically not the best course of action. MT and ST paper trading is different, you have greater flexibility and can maneuver an account with greater dexterity capitalizing on swings up and down with the advantage of using stops. You can't place a stop-loss on a 1oz American Gold Eagle in your hand, though you can employ hedging using a paper trading account.
Currently PoG is coming up to test several lines of potential resistance:
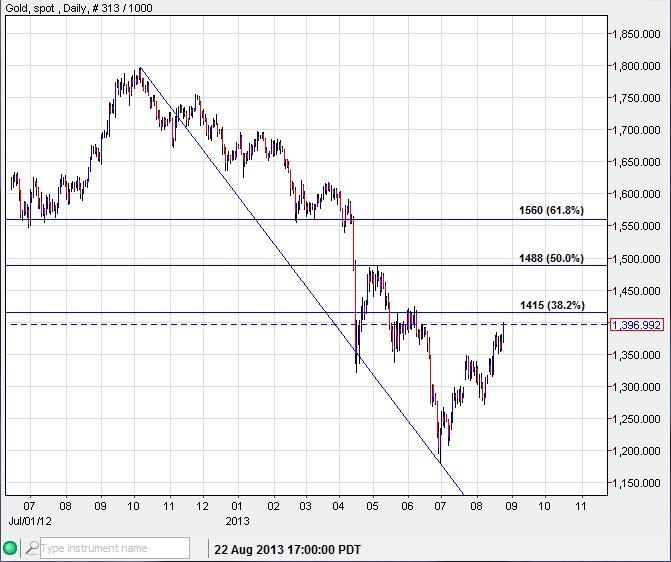
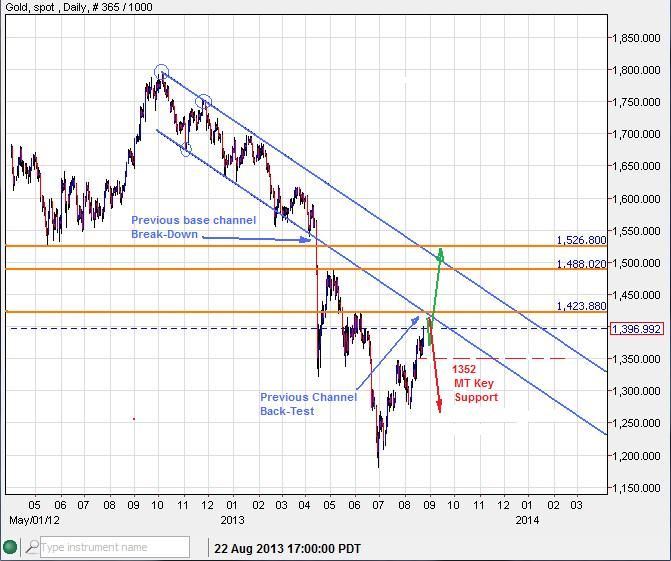
Gold is still inside its base channel. This means the the current 3 legged advance up from 1180.20 could be just a corrective wave. What would set this upward wave structure apart as an impulsive rise would be to have the price move above its base channel and form a new acceleration channel (orange), no doubt generating a point of recognition. The Key MT support level at this time is 1352ish.
-----------------------------------------------------------------------------------------------------------------------------
Silver - Is much further ahead than gold, having already broken its base channel (blue), headlong up into its acceleration channel (orange):
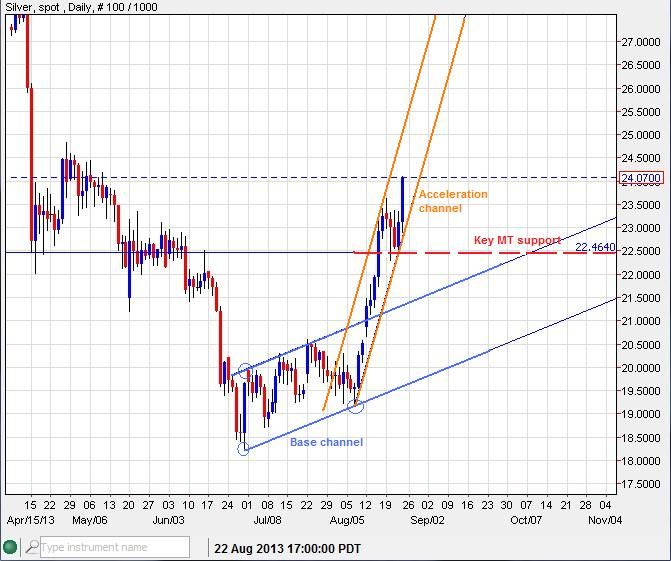
Silver is also about to knock on a MT fibo retrace level of 38.2% (24.77ish), as well as test some other resistive trend lines which form a resistance zone. This would be the place to watch for daily topping candles such as an inverted hammer, OKR or bearish Harami. Further ascent this week may also give the New York trading hours another crack at the 24.59 to 25.91 Dead zone, which has not traded in the NY time frame. Keep in mind that this rapid climb has left behind a NY Dead zone below at 20.50ish to 20.86. The market often despises a vacuum.

----------------------------------------------------------------------------------------------------------------------------
If your paper trading could use a technical boost, consider signing up for the Major Market Movement subscription service where you will receive my daily updates that cover multiple technical modes including the QG3 trend following indicator, Elliot Wave, candlesticks, trend-lines and patterns. Also, I will soon be launching (early September) a new fully featured website with chart libraries, forum and frequent blog updates.
Sign up here:
http://majormarketmovements.blogspot.com/p/mmm-market-signal.html
Good Hunting,
Quad G
Sunday, August 18, 2013
MMM Weekend Update 8-18-13
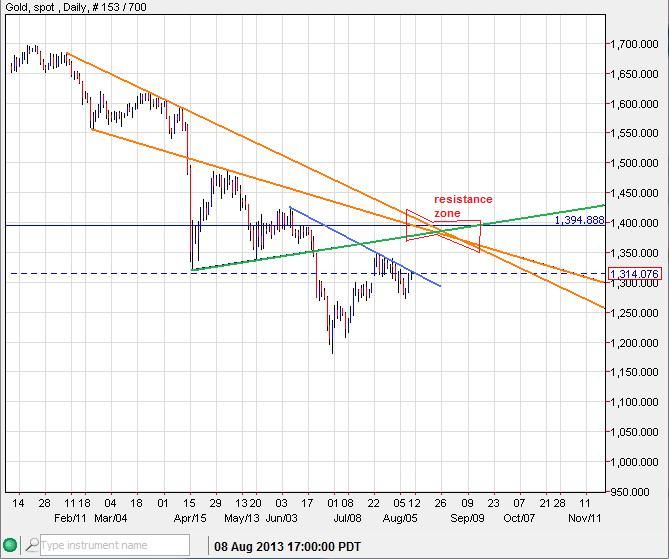
Gold - Last week I depicted the price of Gold coming up to challenge a neck-line of a bullish inverted Head and Shoulder pattern and a potential resistance zone above:


This week's update shows the breach of the neckline (blue) with follow-through up to the resistance zone. In the days ahead we could see the price wrestle with this zone as well as challenge the MT 38.2% fibo retrace level at 1415ish.

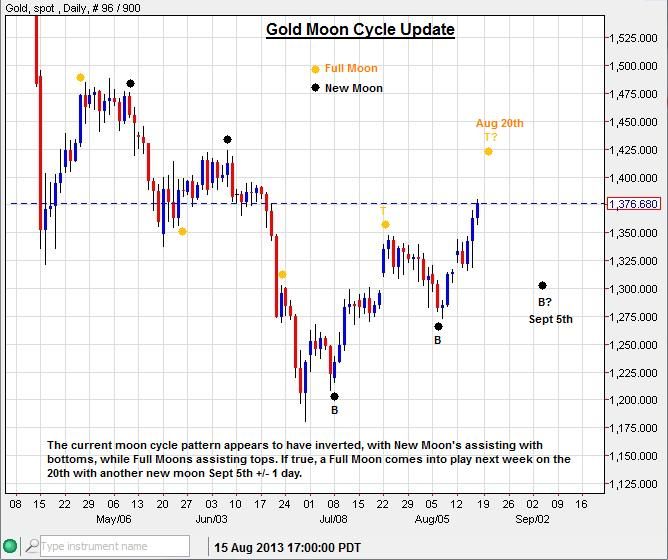
The Moon cycle has nailed a few tops and bottoms recently. Next week, there is another full moon on Aug 20th providing a turn date window between the close on Aug 19th to the close on Aug 22nd. The last full moon helped cap a top, this iteration may be no different. If a top is realized next week, another bottom may come into play the next new moon on Sept 5th.

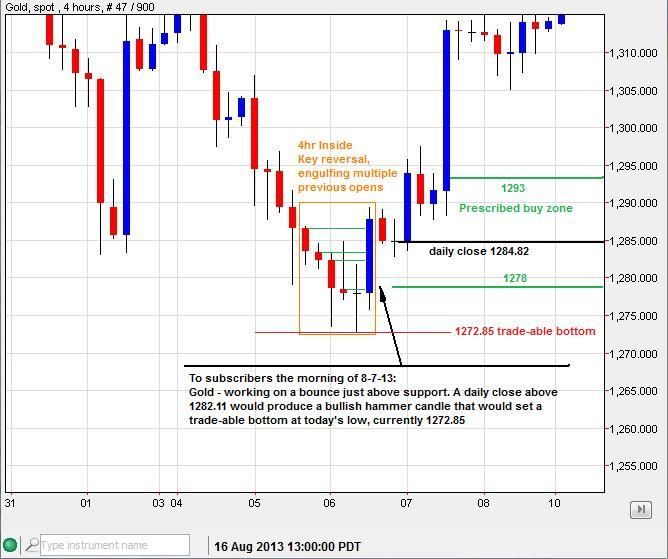
The last New Moon turn date window (Aug 5th to Aug 8th) kept me on watch for potential bottoming action, found some:


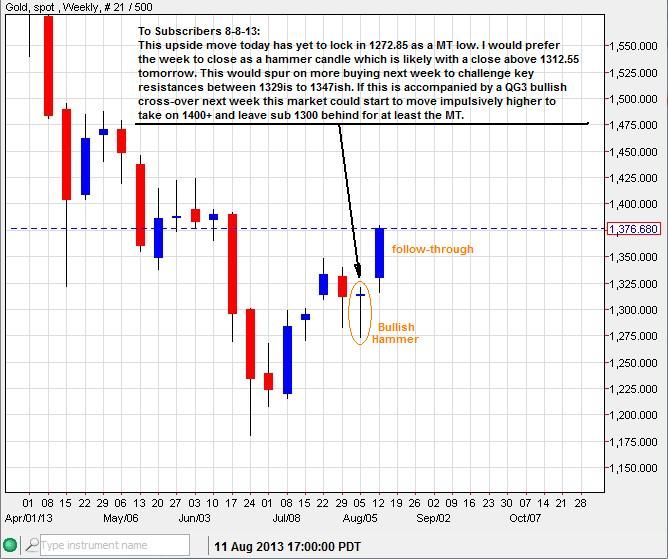
The previous weekly bullish hammer candle saw some substantial follow-through last week:

I suspect that gold could hit some resistance this week, perhaps digesting some of the previous gains before moving higher while remaining above key ST support levels.
----------------------------------------------------------------------------------------------------------------------------------
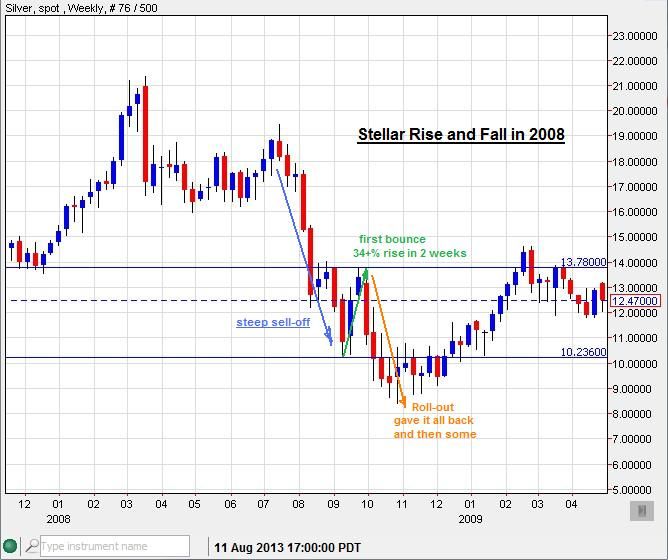
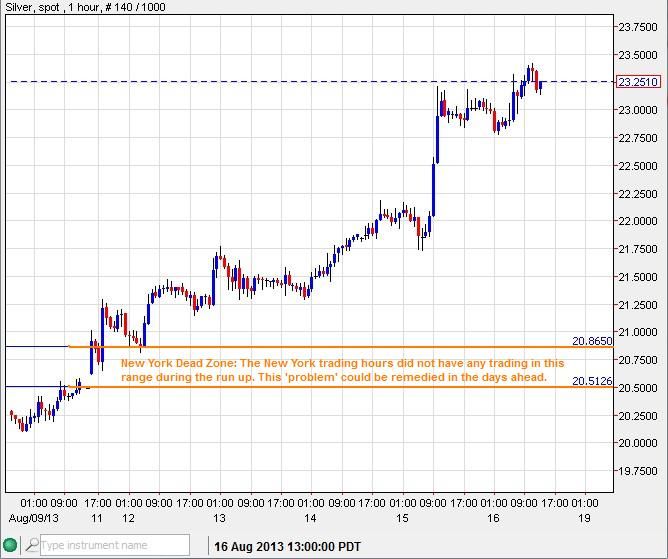
Silver - Cut right through a resistance zone like a hot knife through butter. Though this bullish stampede has been amazing, it has been seen before. In 2008 a 2 week 34+% rise was seen, no doubt churning the bullish juices. However, Silver and most other asset classes were caught up in the post Lehman deflationary romp with the ensuing stock market collapse after Sept 15th, 2008.

I'm not interested in throwing a wet blanket on the current euphoria, but I find that it's good practice to temper such enthusiasm with some sober judgement.
Silver bulls have also left a 'mess behind', taking off with out giving the NY market a chance at the 20.51 to 20.86 level. That could be hit later.

-------------------------------------------------------------------------------------------------------------------------------
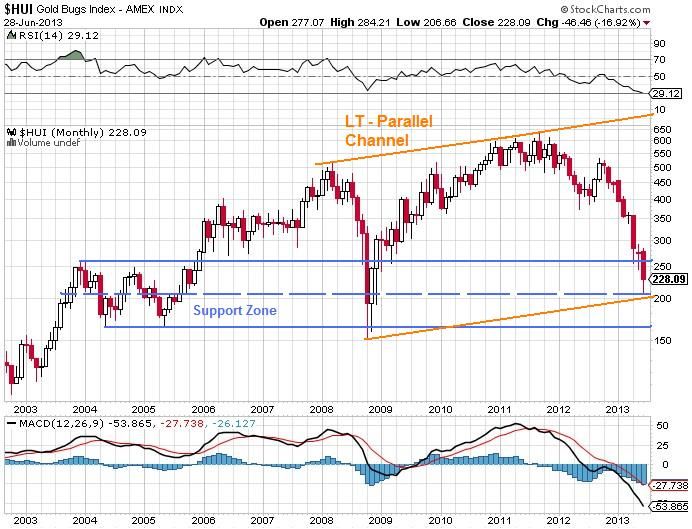
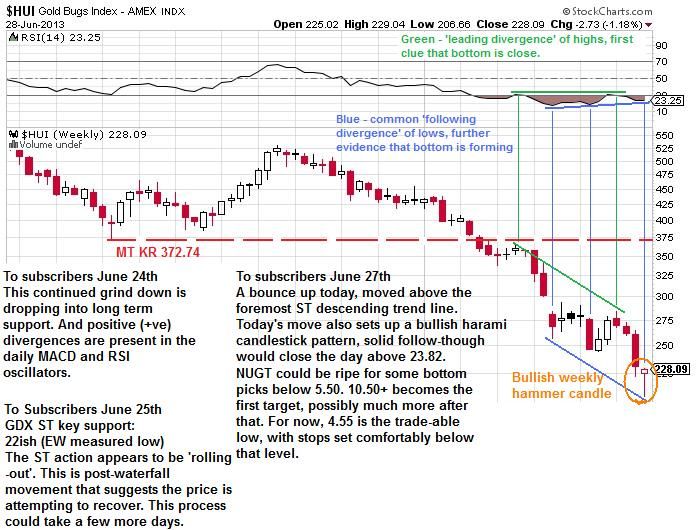
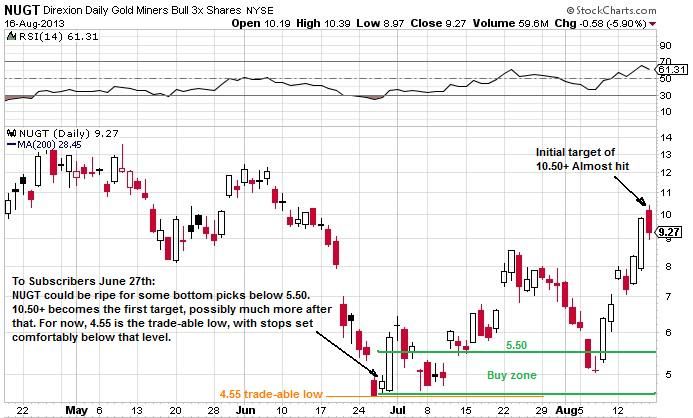
NUGT - Has played very well lately, riding up (about 100% return in just a few weeks) as expected from the long term support channel and bottom in the HUI gold miner index (currently 271ish):


Update:

------------------------------------------------------------------------------------------------------------------------------
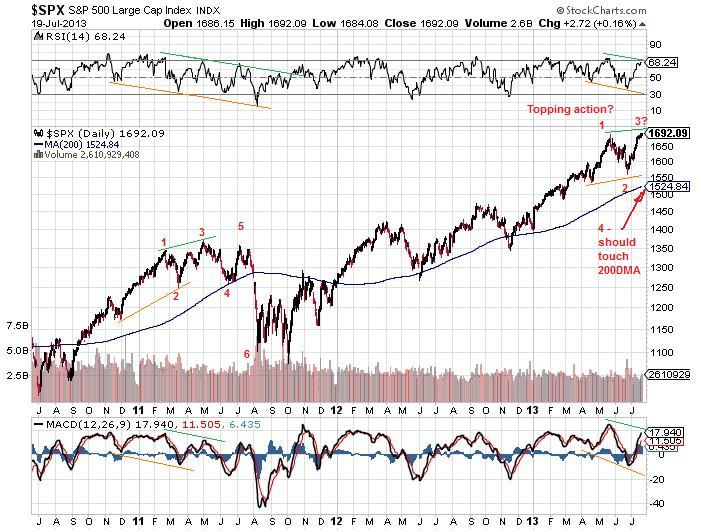
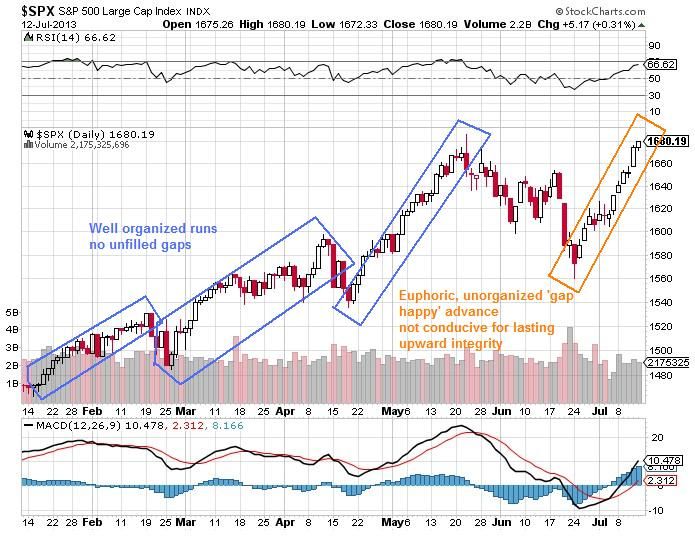
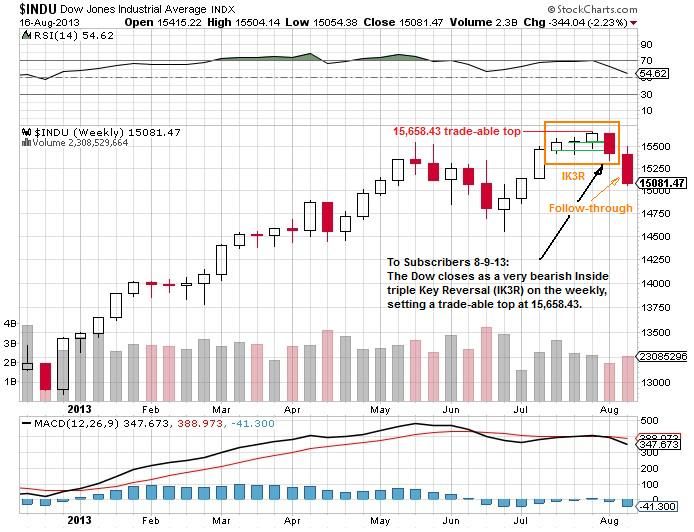
Stock Market - Has been acting 'toppy' for a couple weeks now. Here is some previous analysis that pointed out that the current run up was not likely going to last with out a meaningful correction.
From July 21st:

From July 14th:


The stock market action the last several days was showing that a top was increasingly likely:


----------------------------------------------------------------------------------------------------------------------------
If you are a trader interested in technical pattern recognition for managing trades, consider subscribing to my daily email service here:
http://majormarketmovements.blogspot.com/p/mmm-market-signal.html
Good Hunting this week,
Quad G
This week's update shows the breach of the neckline (blue) with follow-through up to the resistance zone. In the days ahead we could see the price wrestle with this zone as well as challenge the MT 38.2% fibo retrace level at 1415ish.
The Moon cycle has nailed a few tops and bottoms recently. Next week, there is another full moon on Aug 20th providing a turn date window between the close on Aug 19th to the close on Aug 22nd. The last full moon helped cap a top, this iteration may be no different. If a top is realized next week, another bottom may come into play the next new moon on Sept 5th.
The last New Moon turn date window (Aug 5th to Aug 8th) kept me on watch for potential bottoming action, found some:

The previous weekly bullish hammer candle saw some substantial follow-through last week:
I suspect that gold could hit some resistance this week, perhaps digesting some of the previous gains before moving higher while remaining above key ST support levels.
----------------------------------------------------------------------------------------------------------------------------------
Silver - Cut right through a resistance zone like a hot knife through butter. Though this bullish stampede has been amazing, it has been seen before. In 2008 a 2 week 34+% rise was seen, no doubt churning the bullish juices. However, Silver and most other asset classes were caught up in the post Lehman deflationary romp with the ensuing stock market collapse after Sept 15th, 2008.
I'm not interested in throwing a wet blanket on the current euphoria, but I find that it's good practice to temper such enthusiasm with some sober judgement.
Silver bulls have also left a 'mess behind', taking off with out giving the NY market a chance at the 20.51 to 20.86 level. That could be hit later.
-------------------------------------------------------------------------------------------------------------------------------
NUGT - Has played very well lately, riding up (about 100% return in just a few weeks) as expected from the long term support channel and bottom in the HUI gold miner index (currently 271ish):
Update:
------------------------------------------------------------------------------------------------------------------------------
Stock Market - Has been acting 'toppy' for a couple weeks now. Here is some previous analysis that pointed out that the current run up was not likely going to last with out a meaningful correction.
From July 21st:
From July 14th:
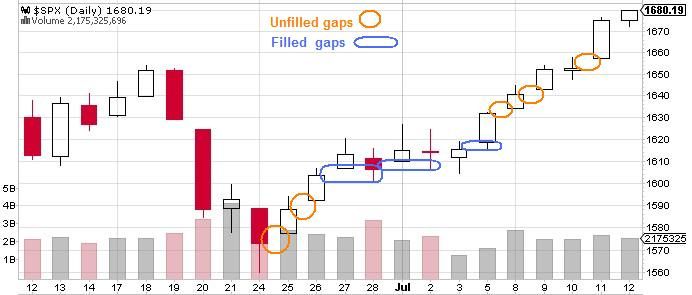
The stock market action the last several days was showing that a top was increasingly likely:
----------------------------------------------------------------------------------------------------------------------------
If you are a trader interested in technical pattern recognition for managing trades, consider subscribing to my daily email service here:
http://majormarketmovements.blogspot.com/p/mmm-market-signal.html
Good Hunting this week,
Quad G
Sunday, August 11, 2013
MMM Weekend update 8-11-13
Gold - The New Moon turn date window appears to be a success with a strong bounce up. The dip was stingy however, only giving a low of 1272ish before reversing. Last week's bounce produces a swing low and key support for any more upside at 1272ish.
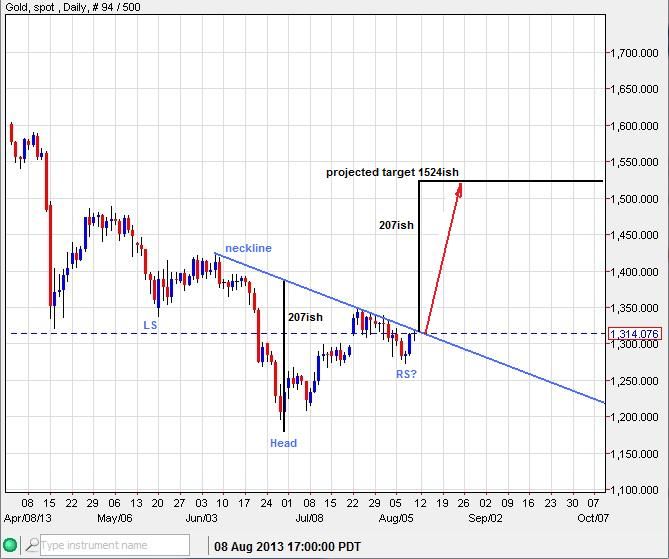
Gold has completed a break-out and back-test and is now ready to roam higher while above 1272ish:

There is a skewed neckline of a bullish iHnS pattern, which could project a target up to 1524ish if a neckline breach occurs this week.
However, any upside advance may have to tangle with a series of resistances above:
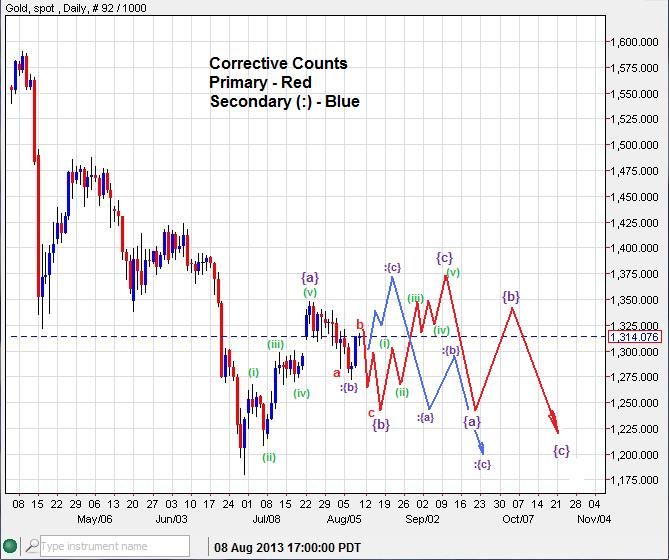
The EW impulse counts may look something like this in the days ahead:

If the resistance zone above is going to be respected, then a corrective EW count is more likely, as more sideways base forming plays out:

In a nutshell, there is more upside to be had in this market in the days ahead while the price remains above 1272. A violation of that level would suggest this market is still in a sideways/down corrective phase.
---------------------------------------------------------------------------------------------------------------------
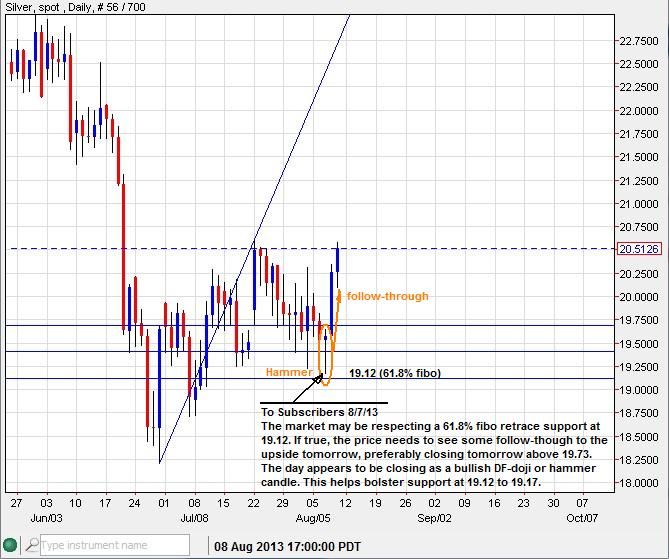
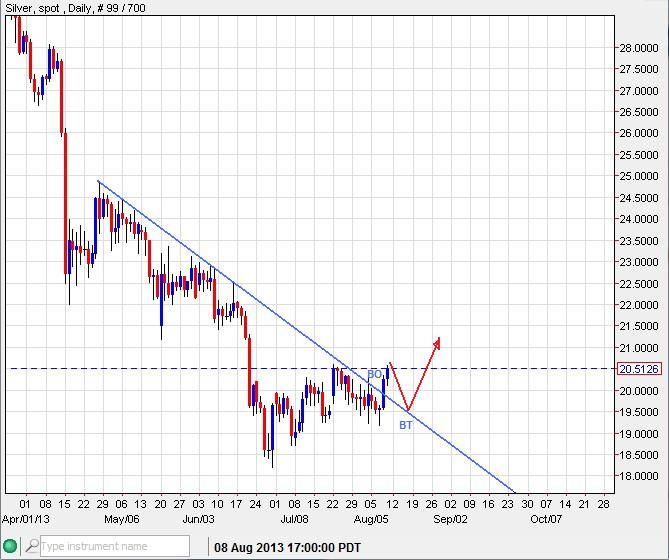
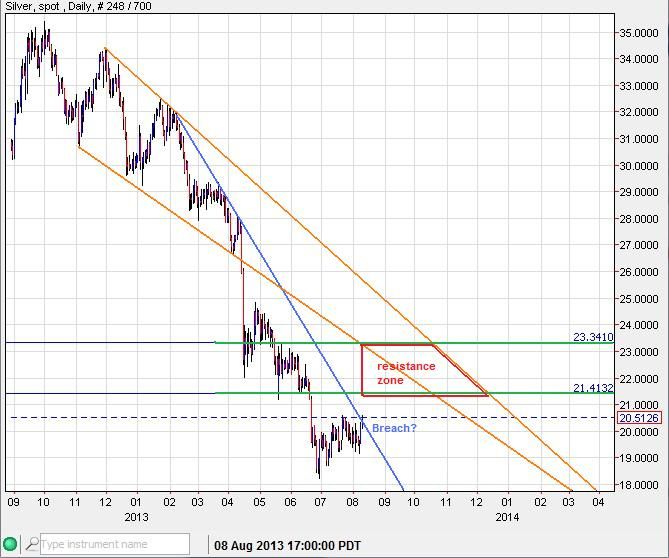
Silver - So far performing much more bullish than gold. The New Moon turn date window and a 61.8% fibo level at 19.12 provides the impetus for last week's tear to the upside after roundly defeating a MT trend-line resistance above:

I would not be surprised to see last week's The Break-Out (BO) receiving a Back-Test (BT) this week or next, the sooner the better.

Any upside run will likely find some hurdles above between 21.40isn and 23ish:

An update of my silver MT count suggests that there is still more sideways irregular flat wave (4) correction to take place before a final 5th wave decent. This bearish count would be in jeopardy with an incursion above 23.30ish.

----------------------------------------------------------------------------------------------------------------------
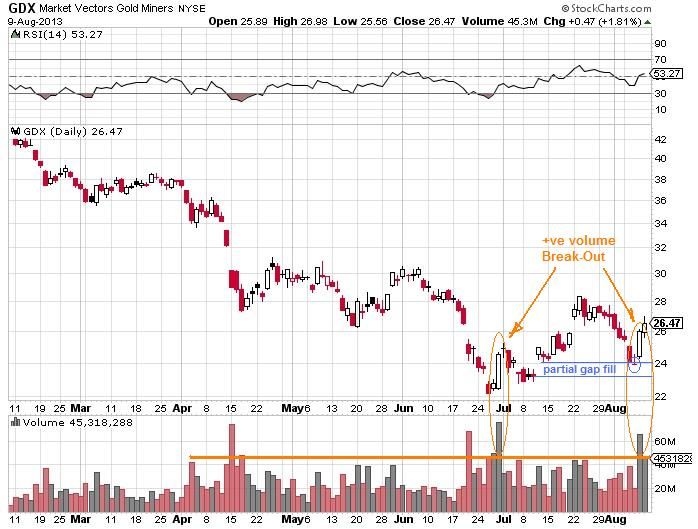
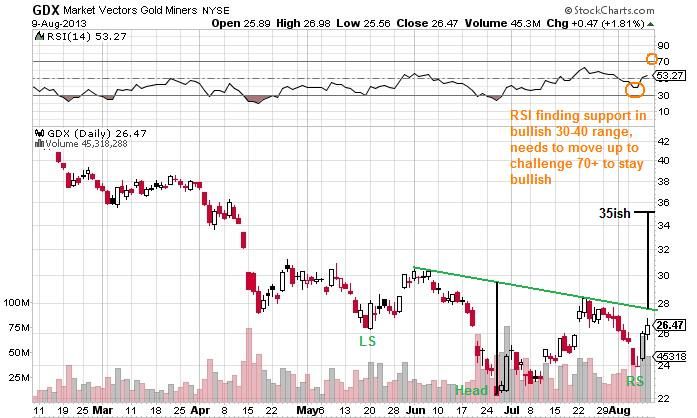
GDX (PM mining ETF) - Is also looking bullish going into next week. Last week's low partially filled a previous gap before heading higher with another volume break-out:

GDX also sports a bullish iHnS pattern, if the neckline is breached next week, the price projection points to 35ish in the ST:

The week ended with a bullish hammer candle printed. This sets key support at 23.89:

--------------------------------------------------------------------------------------------------------------------
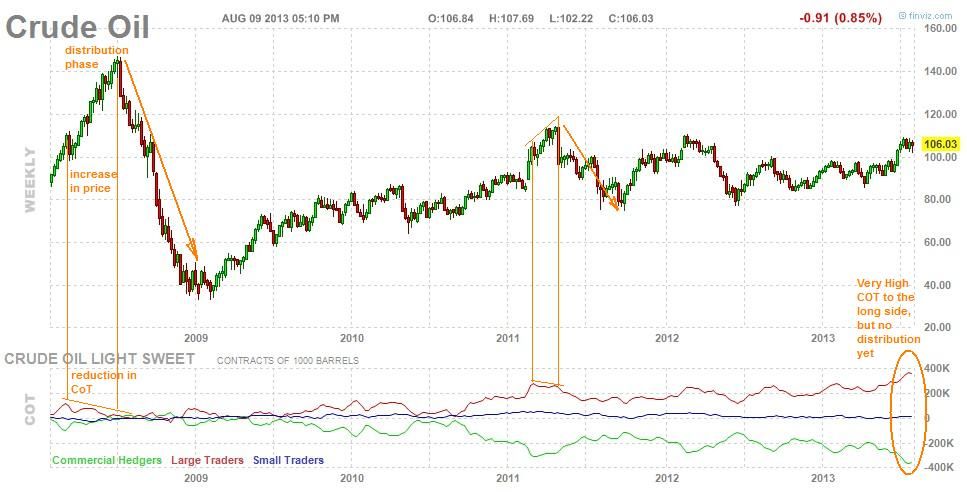
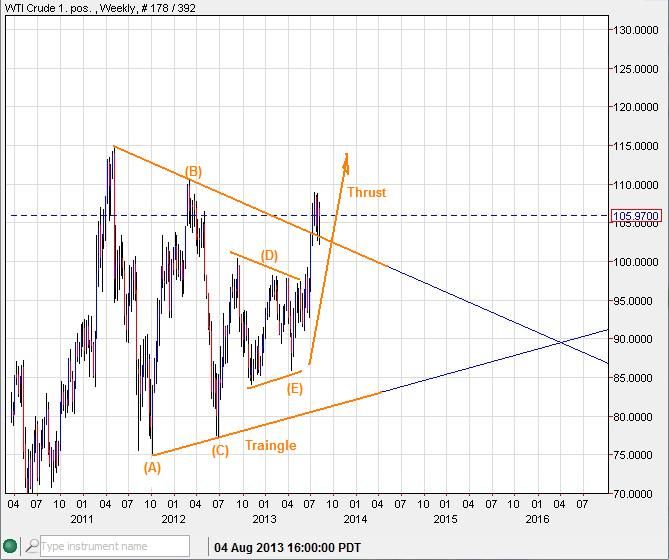
Crude (WTI) - The CoT (commitment of traders)shows great sums of long side volume. This will certainly weigh on any further price increases. However, the near term rise has yet to see any signs of distribution like other past rallies have. This would suggest more upside is possible in the ST.

MT EW count, suggests a triangle/thrust is in the works:

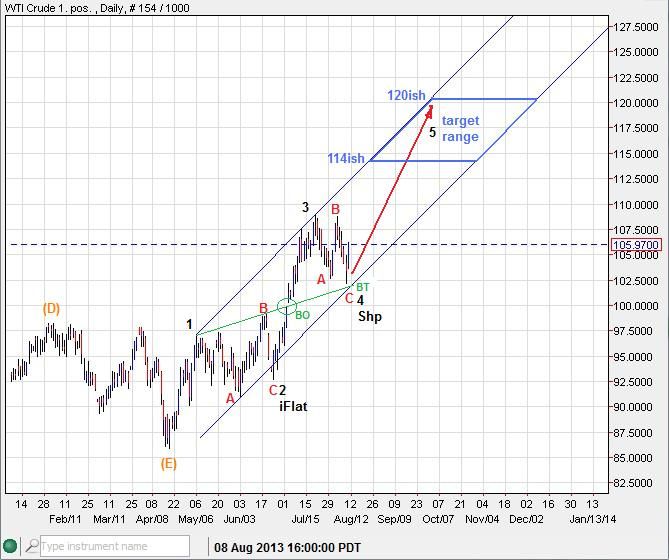
ST EW count points to a 5th wave rise off a sharp 4th wave back-test, 102.21 is now key support:

--------------------------------------------------------------------------------------------------------------------
USD - The USDollar ended last week at a critical MT trend-line support as a 4th test. The Rule of 4 (Ro4) suggests that anytime a support or resistance is tested a 4th time it has a greater probability of being broken. If true, for USD, a significant top could be in place with a MT downside move to be realized.

-------------------------------------------------------------------------------------------------------------------
If you are interested in subscribing to my daily email market updates you can do so here:
http://majormarketmovements.blogspot.com/p/mmm-market-signal.html
Quad G
Gold has completed a break-out and back-test and is now ready to roam higher while above 1272ish:

There is a skewed neckline of a bullish iHnS pattern, which could project a target up to 1524ish if a neckline breach occurs this week.
However, any upside advance may have to tangle with a series of resistances above:
The EW impulse counts may look something like this in the days ahead:

If the resistance zone above is going to be respected, then a corrective EW count is more likely, as more sideways base forming plays out:
In a nutshell, there is more upside to be had in this market in the days ahead while the price remains above 1272. A violation of that level would suggest this market is still in a sideways/down corrective phase.
---------------------------------------------------------------------------------------------------------------------
Silver - So far performing much more bullish than gold. The New Moon turn date window and a 61.8% fibo level at 19.12 provides the impetus for last week's tear to the upside after roundly defeating a MT trend-line resistance above:
I would not be surprised to see last week's The Break-Out (BO) receiving a Back-Test (BT) this week or next, the sooner the better.
Any upside run will likely find some hurdles above between 21.40isn and 23ish:
An update of my silver MT count suggests that there is still more sideways irregular flat wave (4) correction to take place before a final 5th wave decent. This bearish count would be in jeopardy with an incursion above 23.30ish.

----------------------------------------------------------------------------------------------------------------------
GDX (PM mining ETF) - Is also looking bullish going into next week. Last week's low partially filled a previous gap before heading higher with another volume break-out:
GDX also sports a bullish iHnS pattern, if the neckline is breached next week, the price projection points to 35ish in the ST:
The week ended with a bullish hammer candle printed. This sets key support at 23.89:

--------------------------------------------------------------------------------------------------------------------
Crude (WTI) - The CoT (commitment of traders)shows great sums of long side volume. This will certainly weigh on any further price increases. However, the near term rise has yet to see any signs of distribution like other past rallies have. This would suggest more upside is possible in the ST.
MT EW count, suggests a triangle/thrust is in the works:
ST EW count points to a 5th wave rise off a sharp 4th wave back-test, 102.21 is now key support:
--------------------------------------------------------------------------------------------------------------------
USD - The USDollar ended last week at a critical MT trend-line support as a 4th test. The Rule of 4 (Ro4) suggests that anytime a support or resistance is tested a 4th time it has a greater probability of being broken. If true, for USD, a significant top could be in place with a MT downside move to be realized.

-------------------------------------------------------------------------------------------------------------------
If you are interested in subscribing to my daily email market updates you can do so here:
http://majormarketmovements.blogspot.com/p/mmm-market-signal.html
Quad G
Subscribe to:
Posts (Atom)