USD - Appears to be working in a bull flag here at the upper 76 to upper 77 area. There is a chance that USD may back test the previous swing high at 76.72 before moving higher.
A break out above 77.80 would likely see another thrust up to USD's old stomping grounds between 78.75 and 81.45. This zone would likely be the best place to find a ST top with a multi-week correction to follow. We'll see, one step at a time.
Gold - Currently experiencing some resistance below the 10 EMA (1838)and a descending trend-line right now above at 1833. Even though the ST may see a bit more bearishness below these levels. The MT picture is looking better everyday. The more that price action coils between 1702 and 1920, the greater the upside potential will be with a near future break-out to the upside. Here is a look at the Gold chart in 1979 to 1980:
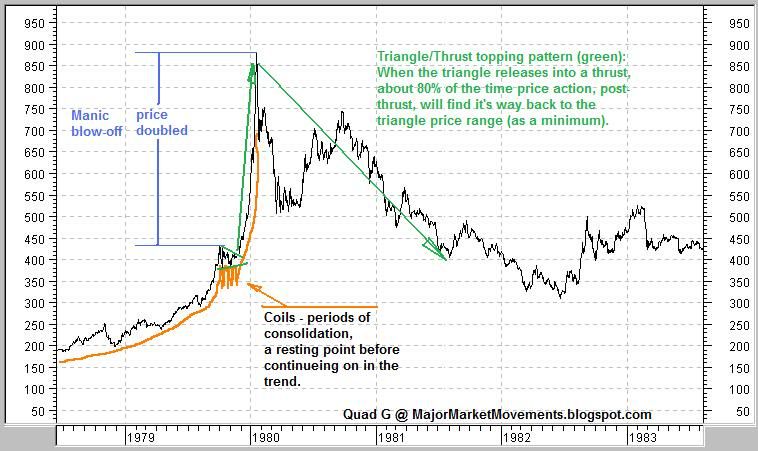
Is PoG setting up the same type of move 32 years later?
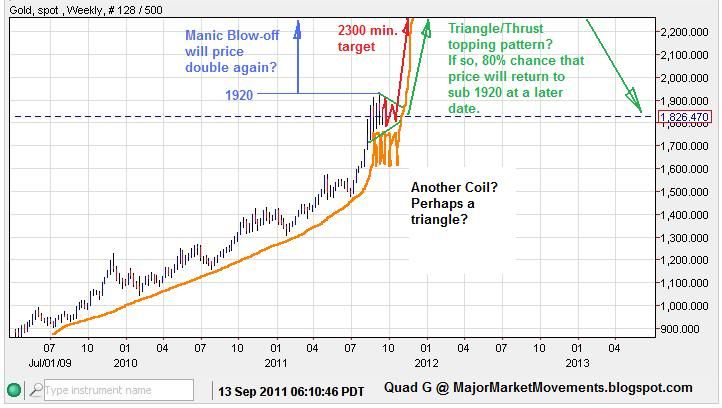
A fractal repeat of 1980's historic top would suggest gold could double the price at 1920, producing a potential blow-off target of 3840 with in a few short months. However, the Triangle/Thrust pattern suggests that no matter how high gold might climb returning to sub-1920 has a roughly 80% chance.
Silver - A daily close today under the 10 EMA (currently 41.34) will produce a bearish cross over in the 3/10/20 ribbon. Price would need to close above the 20DMA (currently 41.54) to reverse this bearish trend. Price action has tripped the neckline of a bearish HnS, which was back-tested over night near 41.00. However, impulse moves to the downside have yet to be seen. I would say that a daily close today above the 10 EMA could be enough to cancel the bearish HnS pattern.
Soybeans - They have back tested the previous break-out with a move back to 1380 to 1400 as anticipated. A successful back test should see price rise up quickly out of this zone heading toward higher-highs above 1460. There is also an open gap between 1413 to 1424 that may want to be filled. If price falls below 1365-1370 (roughly the 50% retracement level), then the upside potential is in jeopardy, not dead but in trouble.
Dow - That triple gap area is still open above between 11,170 and 11,295. I suspect that this gap could be filled this week, which would be good for the over all downward trend. The 3/10/20 ribbon has a bearish cross-over and will remain that way with daily closes below the 10EMA (currently 11,208). The 20DMA (currently 11,242 may cap intra-day extremes), so a complete gap fill may not happen. The gap fill potential will become less likely with a move below 10,824.
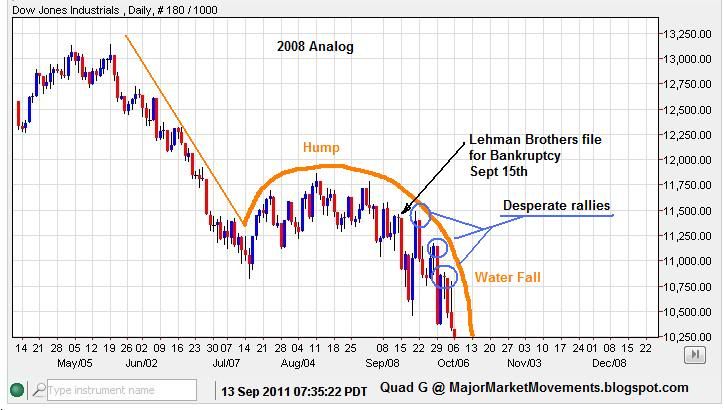
Take a look at the pattern just before the grandest dump in 2008:
And compare it to the action so far in 2011:
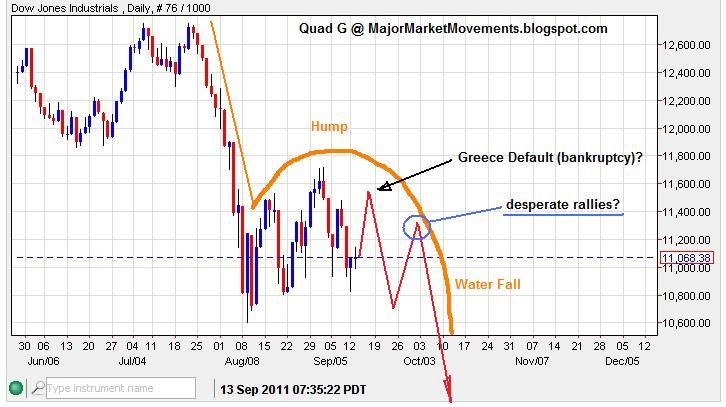
Similar undulations could be seen just before the market vomits another 25% soon thereafter. All part of a potential long term sell off in the Dow to sub-3000 by 2015 to 2016.
LOL!.....Have a nice day.
...
Dedicated to the pursuit of identifying significant turns and trends in multiple markets using the Elliot Wave Theory, Japanese Candlesticks, Cycles, Seasonals and basic technical analysis.
Showing posts with label Morning Coffee. Show all posts
Tuesday, September 13, 2011
Friday, September 9, 2011
Morning Coffee with Quad G - 9/9/11
Mornin' All,
Running out of time so this is going to be somewhat of a 'rush' job.
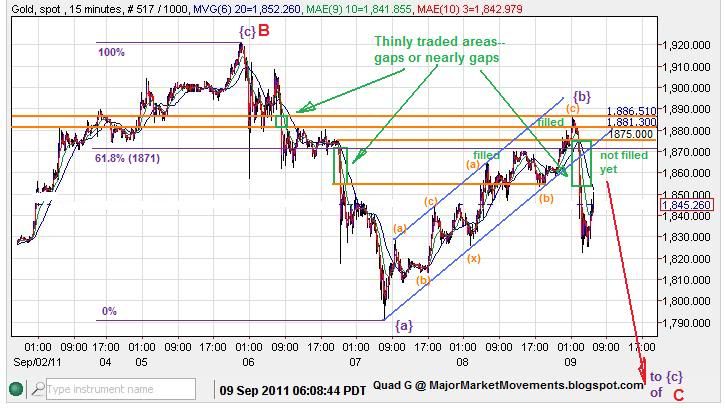
Gold - managed to break the 61.8% fibo and 1875 to fill a small 'near gap' at the 1886 level, then quickly reversed and tripped the lower channel line (blue):
You'll notice the choppy double zig-zag going up to finish {b} of C, filled that small gap and then sold down. But in the sell down another gap is formed, this too could be filled before proceeding lower. Critical resistance is now at 1886, key support at a ascending trend line below at 1810. If that support is broken today, this should confirm the expected slide lower toward {c} of C, target range 1786 to 1710ish.
USD - Moving up as anticipated. See my recent article here: http://majormarketmovements.blogspot.com/2011/09/usd-long-term-bullish-count-could-be.html The index is now about to knock on the black trend-line. Any choppy 3 wave consolidation near this black line will likely suggest that a break-out is likely to occur to the upside soon. Or a strong weekly close above today would also signal a break-out.
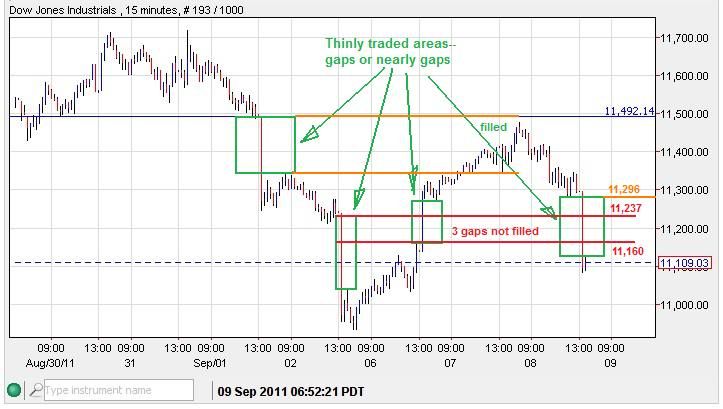
Dow - Gap city! Gap up down and sideways. Is the Dow now tracking the 'Swiss Cheese' market? In honor of the Swiss manipulating their currency?
Here is the Chart:
We now have 3 days with gaps that essentially have not been filled, and might be before further downside will develop. Key resistance is now at 11,477. A smaller bearish HnS can also be seen, with it's neckline at 10,934 today. Tripping that neckline would project a plunge to at least 10,150ish.
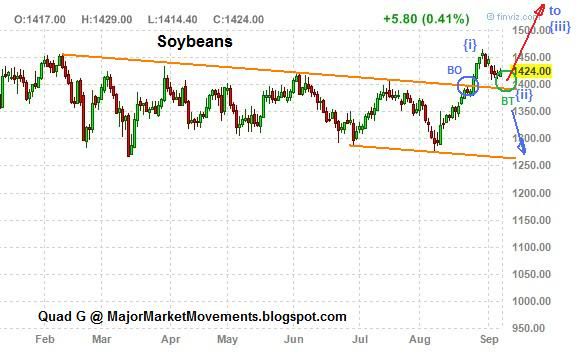
Soybeans - Price appears to be moving down into Back Test (BT) territory of the previous trend line Break Out (BO). Possibly a wave {ii} pull back before wave {iii} higher. If the BT fails as support (blue projection) then further selling is more likely, Chart:
Gotta run, all the best you!
...
Running out of time so this is going to be somewhat of a 'rush' job.
Gold - managed to break the 61.8% fibo and 1875 to fill a small 'near gap' at the 1886 level, then quickly reversed and tripped the lower channel line (blue):
You'll notice the choppy double zig-zag going up to finish {b} of C, filled that small gap and then sold down. But in the sell down another gap is formed, this too could be filled before proceeding lower. Critical resistance is now at 1886, key support at a ascending trend line below at 1810. If that support is broken today, this should confirm the expected slide lower toward {c} of C, target range 1786 to 1710ish.
USD - Moving up as anticipated. See my recent article here: http://majormarketmovements.blogspot.com/2011/09/usd-long-term-bullish-count-could-be.html The index is now about to knock on the black trend-line. Any choppy 3 wave consolidation near this black line will likely suggest that a break-out is likely to occur to the upside soon. Or a strong weekly close above today would also signal a break-out.
Dow - Gap city! Gap up down and sideways. Is the Dow now tracking the 'Swiss Cheese' market? In honor of the Swiss manipulating their currency?
Here is the Chart:
We now have 3 days with gaps that essentially have not been filled, and might be before further downside will develop. Key resistance is now at 11,477. A smaller bearish HnS can also be seen, with it's neckline at 10,934 today. Tripping that neckline would project a plunge to at least 10,150ish.
Soybeans - Price appears to be moving down into Back Test (BT) territory of the previous trend line Break Out (BO). Possibly a wave {ii} pull back before wave {iii} higher. If the BT fails as support (blue projection) then further selling is more likely, Chart:
Gotta run, all the best you!
...
Thursday, September 8, 2011
Morning Coffee with Quad G - 9/8/11
Mornin' All,
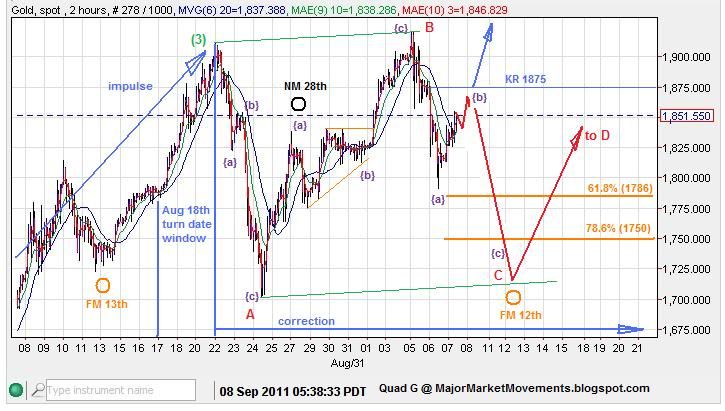
Gold - Here is a potential outcome to watch for if gold remains under 1875:
I still suspect that we are in a sideways corrective period from the August 18th turn date window. I see the potential for that correction to form as a running triangle. Wave B red extended just a bit, but reversed with a daily outside key reversal, denying a break-out. If we do indeed see a move down as wave {c} of (C) into the Full Moon (FM) date of Sept. 12th +/-1 trading day, I think it will set up a very good buying opportunity. This is but one possibility for a new irregular correction. Instead of a triangle, it could also form a running flat, or expanded flat. Each type of correction has it's own set of parameters. However, one thing is certain, if a triangle does in fact play out at this time, then it MUST be counted as a 4th wave and not a 2nd wave. A 2nd wave can in rare occasions BE PART of a triangle pattern but internal structure of the triangle is very key.
I mentioned this earlier but it deserves repeating: 'Sweet September' has 83% chance of ending higher than when it started. The month started at 1826.56, so any buys below that level have a 83% chance of being winners by the end of the month.
Silver - The outlook hasn't changed much. The move through 41.50 did confirm it's working on a correction still and not producing a new impulse to the upside. This set's up any move above 43.35 as a possible break-out point. 39.50 is still critical support, falling below that level invites a slide to the $36 range, with 36.85ish looking like fairly firm support. Again if 36.00 is broken to the downside, a trap door opening is possible, be careful.
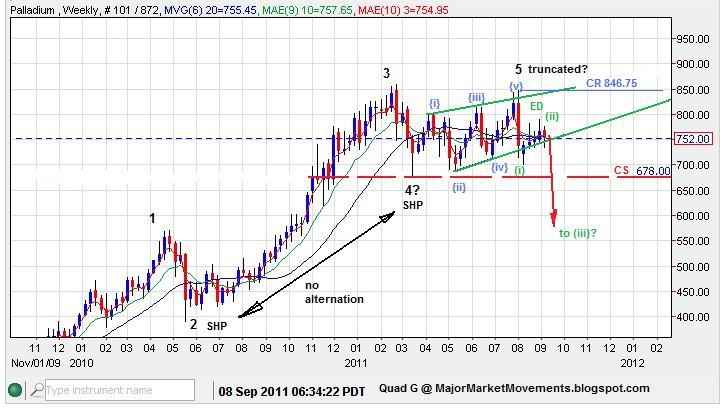
Palladium - I have mentioned the possibility of palladium reacting bearishly to an end diagonal as a truncated 5th wave. Here is a chart that depicts what I have been referring to:
My previous palladium chart had a very bullish outcome, but the swift move down as a possible wave (i) green puts the bullish count in jeopardy and favors this far more bearish interpretation. This bear count will die with a move up beyond critical resistance at 846.75 and will likely be confirmed with a third wave move down below critical support at 678.
Since Palladium is mostly driven by industrial demand, a weakening global economy will severely hamper it's upside potential (the bullion market share is very small). The times that palladium has grown the most is during strong times in the stock market. If a severe stock market crash is ahead, then palladium is very likely to move down with it. The same picture looks probable for copper also. This bearish outlook could turn on a dime if the FED introduces another big round of easing to intervene in the market very soon.
Dow - Has moved up above 11,420 (61.8% fibo retrace) My bearish count is now in jeopardy, which is not death, but it's in trouble, with probabilities of failing increasing. There is a second gap left on friday that may want to be filled, the top of that gap is 11,492. My bearish count fails with a move above 11,716, so if the market is moving up soley to fill that gap, then a relatively low risk short could be entered near the 11,492 area, with stops above 11,716. If 11,716 is breached then the EW picture must be re-evaluated. The Dow could still be producing a dead cat bounce above 11,716. 11,862 is also a very key level, as what was support should now become resistance if this market is indeed bearish for the MT.
...
Gold - Here is a potential outcome to watch for if gold remains under 1875:
I still suspect that we are in a sideways corrective period from the August 18th turn date window. I see the potential for that correction to form as a running triangle. Wave B red extended just a bit, but reversed with a daily outside key reversal, denying a break-out. If we do indeed see a move down as wave {c} of (C) into the Full Moon (FM) date of Sept. 12th +/-1 trading day, I think it will set up a very good buying opportunity. This is but one possibility for a new irregular correction. Instead of a triangle, it could also form a running flat, or expanded flat. Each type of correction has it's own set of parameters. However, one thing is certain, if a triangle does in fact play out at this time, then it MUST be counted as a 4th wave and not a 2nd wave. A 2nd wave can in rare occasions BE PART of a triangle pattern but internal structure of the triangle is very key.
I mentioned this earlier but it deserves repeating: 'Sweet September' has 83% chance of ending higher than when it started. The month started at 1826.56, so any buys below that level have a 83% chance of being winners by the end of the month.
Silver - The outlook hasn't changed much. The move through 41.50 did confirm it's working on a correction still and not producing a new impulse to the upside. This set's up any move above 43.35 as a possible break-out point. 39.50 is still critical support, falling below that level invites a slide to the $36 range, with 36.85ish looking like fairly firm support. Again if 36.00 is broken to the downside, a trap door opening is possible, be careful.
Palladium - I have mentioned the possibility of palladium reacting bearishly to an end diagonal as a truncated 5th wave. Here is a chart that depicts what I have been referring to:
My previous palladium chart had a very bullish outcome, but the swift move down as a possible wave (i) green puts the bullish count in jeopardy and favors this far more bearish interpretation. This bear count will die with a move up beyond critical resistance at 846.75 and will likely be confirmed with a third wave move down below critical support at 678.
Since Palladium is mostly driven by industrial demand, a weakening global economy will severely hamper it's upside potential (the bullion market share is very small). The times that palladium has grown the most is during strong times in the stock market. If a severe stock market crash is ahead, then palladium is very likely to move down with it. The same picture looks probable for copper also. This bearish outlook could turn on a dime if the FED introduces another big round of easing to intervene in the market very soon.
Dow - Has moved up above 11,420 (61.8% fibo retrace) My bearish count is now in jeopardy, which is not death, but it's in trouble, with probabilities of failing increasing. There is a second gap left on friday that may want to be filled, the top of that gap is 11,492. My bearish count fails with a move above 11,716, so if the market is moving up soley to fill that gap, then a relatively low risk short could be entered near the 11,492 area, with stops above 11,716. If 11,716 is breached then the EW picture must be re-evaluated. The Dow could still be producing a dead cat bounce above 11,716. 11,862 is also a very key level, as what was support should now become resistance if this market is indeed bearish for the MT.
...
Labels:
Dow,
Gold,
Morning Coffee,
Palladium,
Silver
Tuesday, September 6, 2011
Morning Coffee with Quad G - 9/6/11
Mornin' All,
First off, I updated the MMM - Hot Links in the sidebar to include my market calendar for quicker access. The calendar also appears at the bottom of blog pages.
Gold - So far still only 3 waves up from 1702 to a new incremental high at 1920. There are some fibo relationships that target 1926ish, and another higher at 1977ish.
Critical support is at 1840, passing below that level could invite more selling toward 1750 to 1783 initially. The 3/10/20 is still in a MT bullish alignment and will remain so with a daily close above 1849. The triangle count I recently posted is likely dead as I have drawn it. There is another way to look at it as a tighter smaller triangle, but like I said, it's still very young, given time it will become clearly apparent if a triangle is forming or not.
Silver - Still holding up very well under these conditions, 41.50 is key support, 39.50 is critical support. If 39.50 is taken out, then a drop to the 36 dollar range looks very possible with a strong level of support near 36.85.
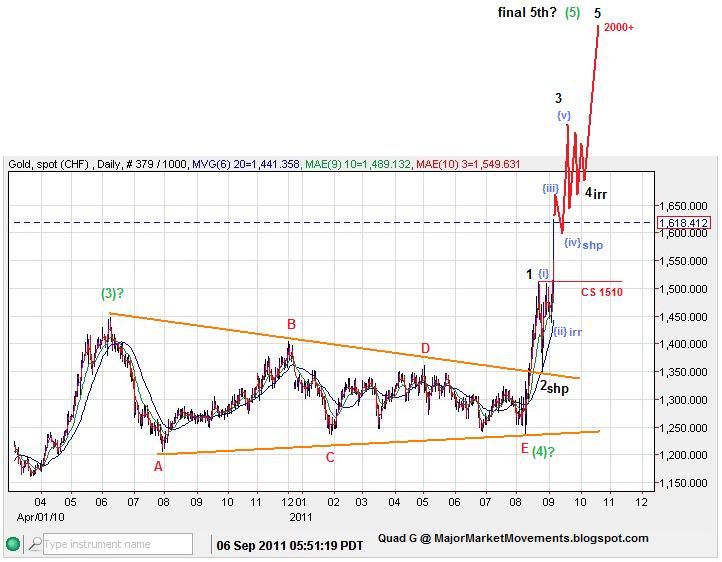
USD/CHF - The Swiss National Bank steps in with intervention. Sends the CHF cross-pairs for a loop. This event clicked on a light bulb for me: Back in the 1930s governments were protecting their markets with trade wars, adding tariffs and other protectionist policies. Even though today most of the industrialized world is operating under international trade agreements for freer trade, the nations are still trying to protect their export/industrial base with currency interventions instead. 'Racing to the Bottom' so that their goods are cheaper in comparison to others. All the while the free flowing fiat helps prop up gold. Gold in CHF has taken off and its easy to see why:
We can clearly see a triangle break-out to the upside. An idealized count could see gold valued in the swissy climb up to the 2000+ level in fairly short order. As the SNB sets a course to devalue it's currency, no doubt those holding the swissy will want to hedge with gold purchases.
Dow - Falls as anticipated, however, there are two gaps now in the daily chart (Friday and today). Don't be surprised if bulls give it another go and try to fill these gaps. IMHO, such an attempt is a fool's errand as stocks would still be likely to sell down again to lower-lows. Gap filling is not a requirement, but is something the market often tries to make happen.
Crude, AUD, Copper and Palladium - All look like they are ready to fall off a deflationary cliff at this time as they are all over shadowed by a previous impulsive wave down and only a 3 wave bear flag in return.
Good Hunting.
...
First off, I updated the MMM - Hot Links in the sidebar to include my market calendar for quicker access. The calendar also appears at the bottom of blog pages.
Gold - So far still only 3 waves up from 1702 to a new incremental high at 1920. There are some fibo relationships that target 1926ish, and another higher at 1977ish.
Critical support is at 1840, passing below that level could invite more selling toward 1750 to 1783 initially. The 3/10/20 is still in a MT bullish alignment and will remain so with a daily close above 1849. The triangle count I recently posted is likely dead as I have drawn it. There is another way to look at it as a tighter smaller triangle, but like I said, it's still very young, given time it will become clearly apparent if a triangle is forming or not.
Silver - Still holding up very well under these conditions, 41.50 is key support, 39.50 is critical support. If 39.50 is taken out, then a drop to the 36 dollar range looks very possible with a strong level of support near 36.85.
USD/CHF - The Swiss National Bank steps in with intervention. Sends the CHF cross-pairs for a loop. This event clicked on a light bulb for me: Back in the 1930s governments were protecting their markets with trade wars, adding tariffs and other protectionist policies. Even though today most of the industrialized world is operating under international trade agreements for freer trade, the nations are still trying to protect their export/industrial base with currency interventions instead. 'Racing to the Bottom' so that their goods are cheaper in comparison to others. All the while the free flowing fiat helps prop up gold. Gold in CHF has taken off and its easy to see why:
We can clearly see a triangle break-out to the upside. An idealized count could see gold valued in the swissy climb up to the 2000+ level in fairly short order. As the SNB sets a course to devalue it's currency, no doubt those holding the swissy will want to hedge with gold purchases.
Dow - Falls as anticipated, however, there are two gaps now in the daily chart (Friday and today). Don't be surprised if bulls give it another go and try to fill these gaps. IMHO, such an attempt is a fool's errand as stocks would still be likely to sell down again to lower-lows. Gap filling is not a requirement, but is something the market often tries to make happen.
Crude, AUD, Copper and Palladium - All look like they are ready to fall off a deflationary cliff at this time as they are all over shadowed by a previous impulsive wave down and only a 3 wave bear flag in return.
Good Hunting.
...
Wednesday, August 3, 2011
Morning Coffee with Quad G - 8/3/11
Hey all, I've been crazy busy lately with other priorities and haven't had much time to respond and chart. I have a very irregular schedule, but most of the time I have an hour in the morning to look at the markets, but not enough time to chart. So 'Morning Coffee with Quad G' will be an occasional segment that I will produce in my waking hours to keep everyone up to date on my market point of view.
First off Gold - Nice fear driven spike right through a critical area. Please do me all a favor and go right now to your charts......now apply the 10 EMA moving average to it. Now look at the daily chart.......what do you see? What have I said about the 10 EMA before? Do technicals matter?.....you be the judge. Again, if the 3/10/10 ribbon is clearly open to the upside or downside the market is in an impulse. Generally, MT positioning should have trail stops comfortably below that level. There are other disciplines to use with trading, but how the market interacts with the 10 EMA often directs MT positioning. ST positioning is different, ST is for higher-frequency day trading moves, where nimbleness is required. ST positions are your 'feelers', bottom or top pickers, mostly using 3 small positions. But MT positioning is for the swing trade and momentum moves, different rules apply with the 10 EMA as a deciding factor.
And I need to repeat, Elliot Wave gives a view of what might be, but any and all MT projections have to pass muster with the 10 EMA. It is the first gate keeper for any EW count. The 20DMA is also important, but we'll talk about it another time. With 1660 clearly breached further upside could stretch to 1760, but again needs to stay above the 10EMA (currently 1624 and climbing). EW key support is at 1628.
Silver - Gave a bit of a fake out move below 39.25, stretching down to 39.02 before recovering. The 3/10/20 contracted a little with the 3EMA almost touching the 10EMA, but is still in good shape as the ribbon is now expanding with a daily close back above the 3EMA. 43+ is still the goal, but price needs to stay above 39.02 and the 20 DMA which is right there at 39.08 and climbing.
SPX - I mentioned that the 200DMA was key and a break of that level would likely cause a flash crash, and sure enough down it went. What was once support is now resistance. Look also at the 10EMA in this market, provided perfect resistance along with the 50DMA a couple days ago. Volumes are reaching 'panicky' levels, so a ST turn may be coming soon. Support exists between 1225 and 1250.
US30Ybond - A 'panic' move for sure, way below the lower Bollinger Band, don't be surprised to see the market calm down a bit and recover back above the lower BB on the daily. TBT and the polar opposite TLT, both experienced 'panic' levels of volume. These type of high volume moves can often exhaust themselves quickly. $29 to $30 was my support level for TBT which broke yesterday going just a bit outside to 28.95. Panics will often push the envelope, today's action will be a bit more telling.
Wheat and Corn - Produced a bull flag through the second half of July, and has now popped above that flag. Wheat looks bullish while above 670, with a measured move target to the upside near 8.00 in the ST. Corn looks bullish above 6.85 and could target 7.75 to 8.00 in the ST. If you take a look at my Corn article posted a couple weeks ago, you'll see that the flat correction (black projection) appears to be playing out.
Soybeans - Take a look at that huge bull flag, looking ripe for a pop to the upside. Soybeans produce a small seasonal low in mid-August and a stronger seasonal low in late Sept/ early Oct. Perhaps good places to buy the dips. The 2008 top could be challenged later this year, and a measurement suggests that a price of 2000 is obtainable.
Times up.....gotta fly.....Duty calls..........
till next time....Good Hunting.
...
First off Gold - Nice fear driven spike right through a critical area. Please do me all a favor and go right now to your charts......now apply the 10 EMA moving average to it. Now look at the daily chart.......what do you see? What have I said about the 10 EMA before? Do technicals matter?.....you be the judge. Again, if the 3/10/10 ribbon is clearly open to the upside or downside the market is in an impulse. Generally, MT positioning should have trail stops comfortably below that level. There are other disciplines to use with trading, but how the market interacts with the 10 EMA often directs MT positioning. ST positioning is different, ST is for higher-frequency day trading moves, where nimbleness is required. ST positions are your 'feelers', bottom or top pickers, mostly using 3 small positions. But MT positioning is for the swing trade and momentum moves, different rules apply with the 10 EMA as a deciding factor.
And I need to repeat, Elliot Wave gives a view of what might be, but any and all MT projections have to pass muster with the 10 EMA. It is the first gate keeper for any EW count. The 20DMA is also important, but we'll talk about it another time. With 1660 clearly breached further upside could stretch to 1760, but again needs to stay above the 10EMA (currently 1624 and climbing). EW key support is at 1628.
Silver - Gave a bit of a fake out move below 39.25, stretching down to 39.02 before recovering. The 3/10/20 contracted a little with the 3EMA almost touching the 10EMA, but is still in good shape as the ribbon is now expanding with a daily close back above the 3EMA. 43+ is still the goal, but price needs to stay above 39.02 and the 20 DMA which is right there at 39.08 and climbing.
SPX - I mentioned that the 200DMA was key and a break of that level would likely cause a flash crash, and sure enough down it went. What was once support is now resistance. Look also at the 10EMA in this market, provided perfect resistance along with the 50DMA a couple days ago. Volumes are reaching 'panicky' levels, so a ST turn may be coming soon. Support exists between 1225 and 1250.
US30Ybond - A 'panic' move for sure, way below the lower Bollinger Band, don't be surprised to see the market calm down a bit and recover back above the lower BB on the daily. TBT and the polar opposite TLT, both experienced 'panic' levels of volume. These type of high volume moves can often exhaust themselves quickly. $29 to $30 was my support level for TBT which broke yesterday going just a bit outside to 28.95. Panics will often push the envelope, today's action will be a bit more telling.
Wheat and Corn - Produced a bull flag through the second half of July, and has now popped above that flag. Wheat looks bullish while above 670, with a measured move target to the upside near 8.00 in the ST. Corn looks bullish above 6.85 and could target 7.75 to 8.00 in the ST. If you take a look at my Corn article posted a couple weeks ago, you'll see that the flat correction (black projection) appears to be playing out.
Soybeans - Take a look at that huge bull flag, looking ripe for a pop to the upside. Soybeans produce a small seasonal low in mid-August and a stronger seasonal low in late Sept/ early Oct. Perhaps good places to buy the dips. The 2008 top could be challenged later this year, and a measurement suggests that a price of 2000 is obtainable.
Times up.....gotta fly.....Duty calls..........
till next time....Good Hunting.
...
Labels:
Corn,
Gold,
Morning Coffee,
Silver,
Soybeans,
SPX,
US 30Y Bond,
Wheat
Subscribe to:
Posts (Atom)