http://majormarketmovements.blogspot.com/2011/07/usd-one-last-move-up.html
The bear count is still valid, but will likely enter into jeopardy if USD rallies above the Black trend-line currently above at 77.18:
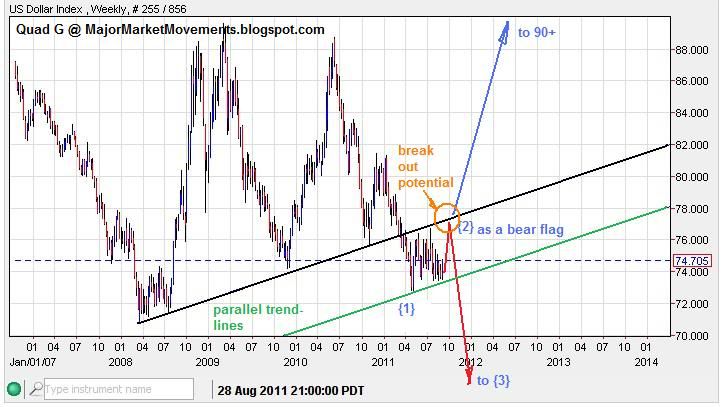
The LT bull count will want to move quickly up and break out above that trend line at 77.18. And it's totally possible with a potentially devastating crash in the stock market, which I have already pointed out, may start this week. As stock positions sell and traders stay in cash, the brokerages will have to meet reserve requirements, thus they will be clamoring for cash, creating demand (USD goes up).
If However, we witness a lazy choppy move to the upside that stays below the black trend-line, then wave {2} blue remains a possibility, which would suggest a 3rd wave down should move into the 60s there after, crossing 70.80 would kill the LT bull count.
The bull count looks like this on the Weekly chart:
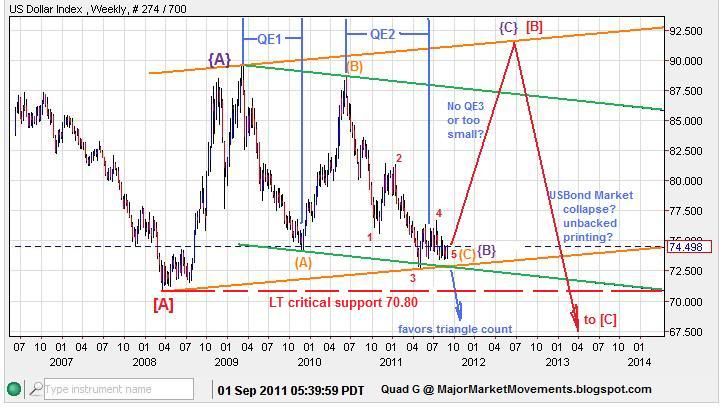
Wave (C) of {B} could be finished right above a confluence of channels (green and orange). Wave {C} up has the potential to move back up to the upper orange channel line above 90 (red projection). However, if the USD turns south unexpectedly and breaks below the lower channel lines, then this should provide plenty of selling pressure to trip the Bull count critical support at 70.80 (blue projection.
Here is a closer look at the count:
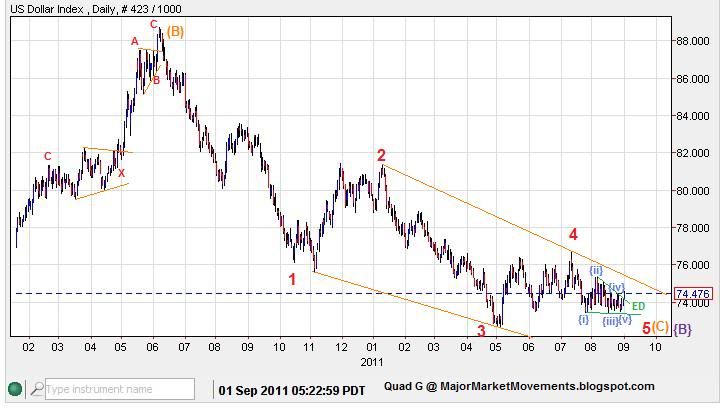
It shows a truncated 5th wave ending diagonal for 5 red, inside a larger ending diagonal for wave (C)orange. Most of the time, ending diagonals are quickly retraced with an impulsive move, in this case to the upside.
Here is the ST count, which is very truncated but has some convincing elements:
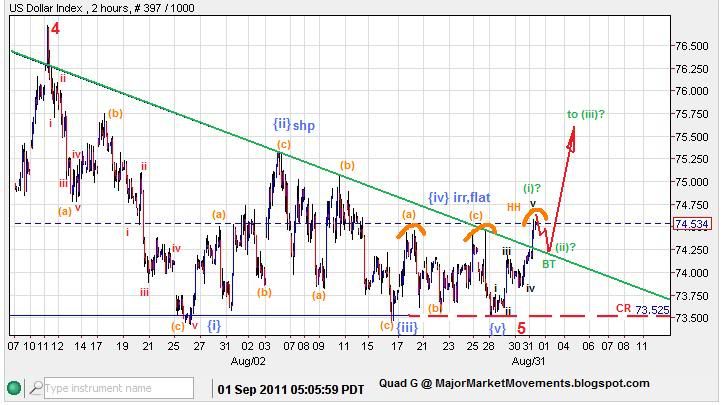
An impulse to the upside can be observed for wave (i)green, a break-out back test is possible as wave (ii) green, and then further upside. 73.52 is critical support for this ST count.
In A Nut Shell:
USD looks like it may have started an impulsive rise to the upside, the move needs to stay above 73.52 for this interpretation to be correct. To confirm the MT and LT counts a move above the black trend-line above at 77.18ish needs to be broken soon. After which an upward assault on 90+ is possible.
The whole USD LT bull count potential dies with any move below 70.80, which would greatly favor the bear count.
...