Showing posts with label Dow. Show all posts

Sunday, August 18, 2013

MMM Weekend Update 8-18-13

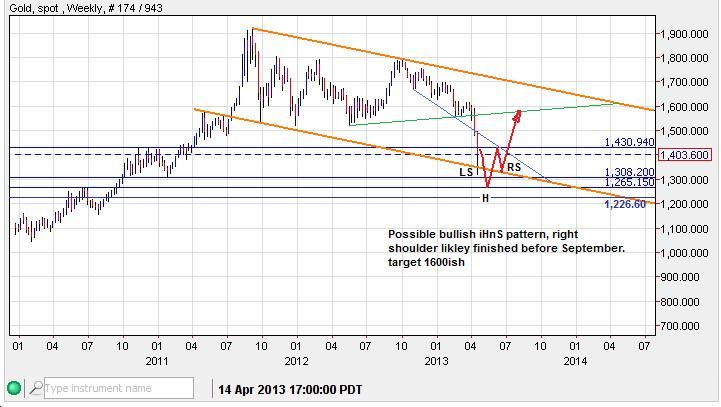
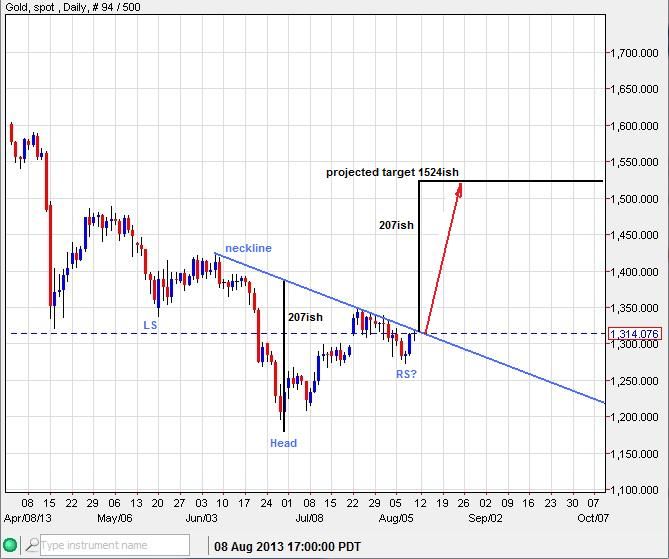
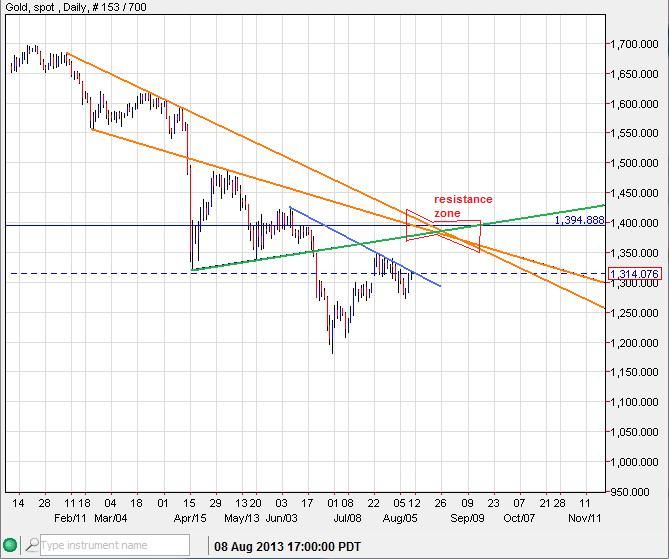
Gold - Last week I depicted the price of Gold coming up to challenge a neck-line of a bullish inverted Head and Shoulder pattern and a potential resistance zone above:


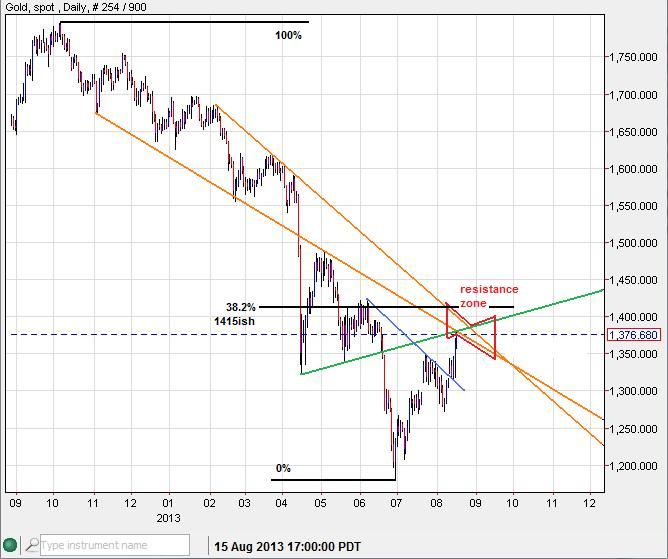
This week's update shows the breach of the neckline (blue) with follow-through up to the resistance zone. In the days ahead we could see the price wrestle with this zone as well as challenge the MT 38.2% fibo retrace level at 1415ish.


The Moon cycle has nailed a few tops and bottoms recently. Next week, there is another full moon on Aug 20th providing a turn date window between the close on Aug 19th to the close on Aug 22nd. The last full moon helped cap a top, this iteration may be no different. If a top is realized next week, another bottom may come into play the next new moon on Sept 5th.
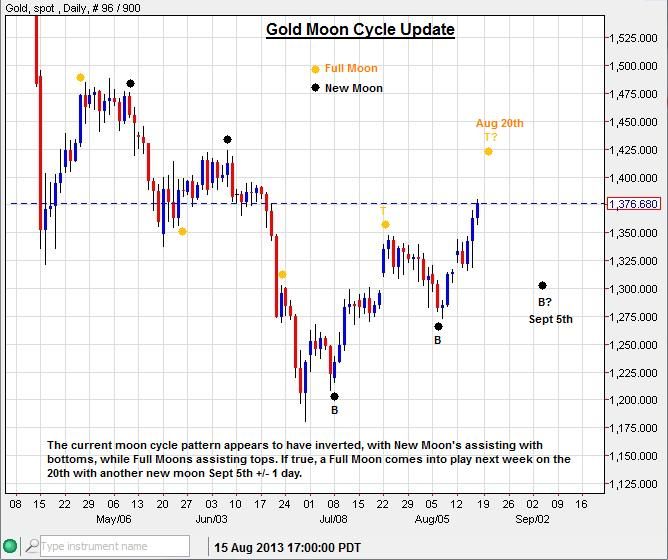


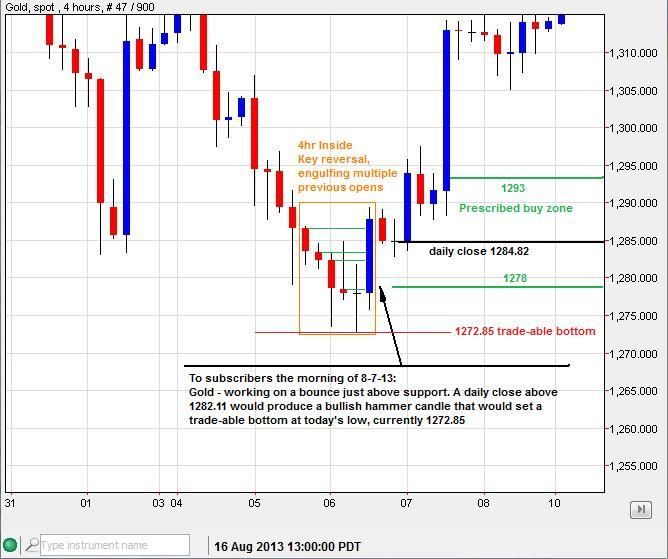
The last New Moon turn date window (Aug 5th to Aug 8th) kept me on watch for potential bottoming action, found some:


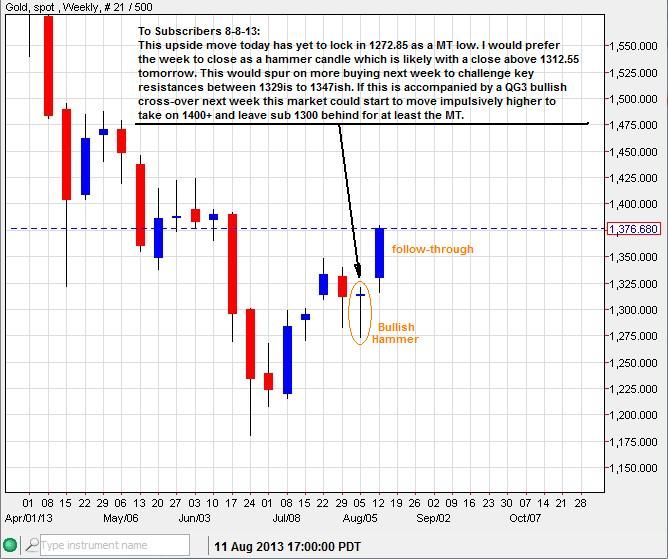
The previous weekly bullish hammer candle saw some substantial follow-through last week:


I suspect that gold could hit some resistance this week, perhaps digesting some of the previous gains before moving higher while remaining above key ST support levels.

----------------------------------------------------------------------------------------------------------------------------------

Silver - Cut right through a resistance zone like a hot knife through butter. Though this bullish stampede has been amazing, it has been seen before. In 2008 a 2 week 34+% rise was seen, no doubt churning the bullish juices. However, Silver and most other asset classes were caught up in the post Lehman deflationary romp with the ensuing stock market collapse after Sept 15th, 2008.
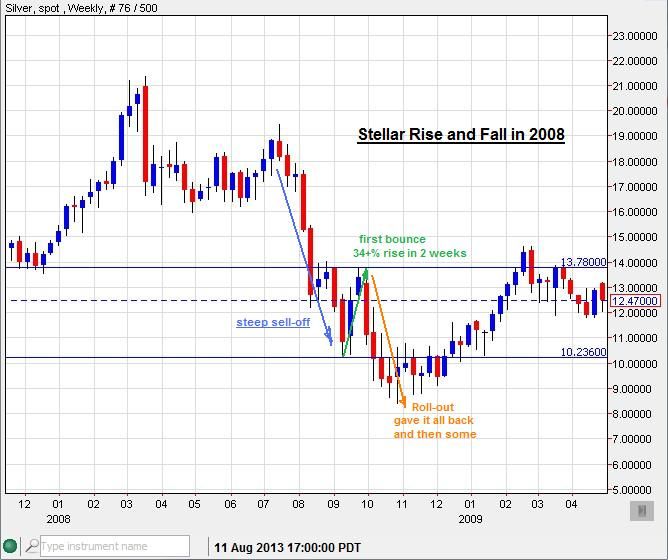


I'm not interested in throwing a wet blanket on the current euphoria, but I find that it's good practice to temper such enthusiasm with some sober judgement.

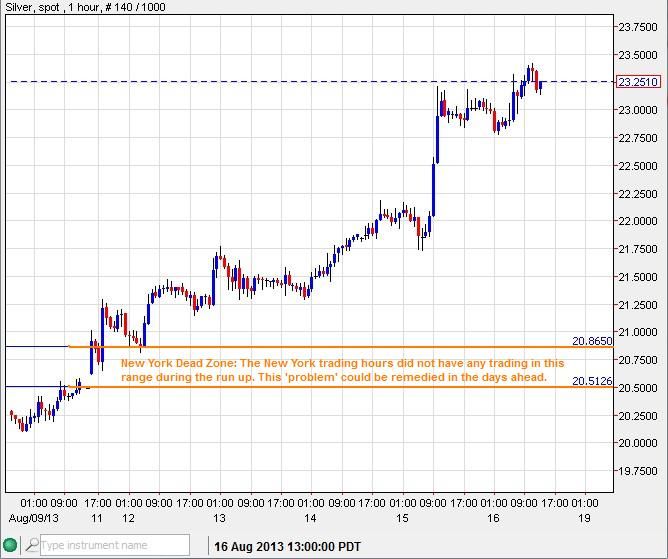
Silver bulls have also left a 'mess behind', taking off with out giving the NY market a chance at the 20.51 to 20.86 level. That could be hit later.


-------------------------------------------------------------------------------------------------------------------------------
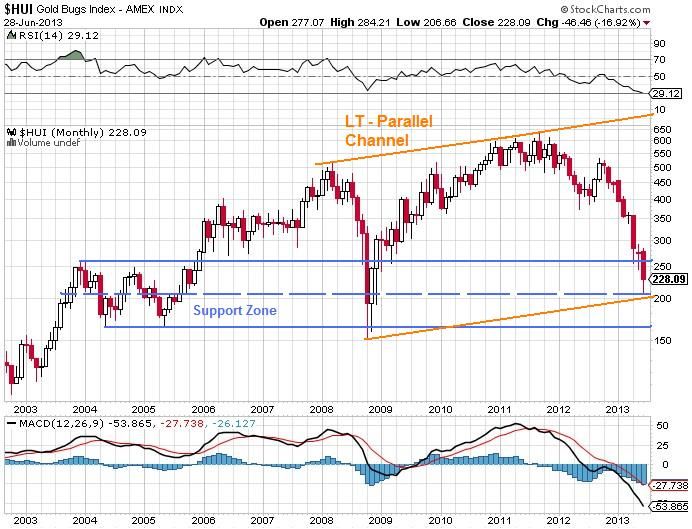
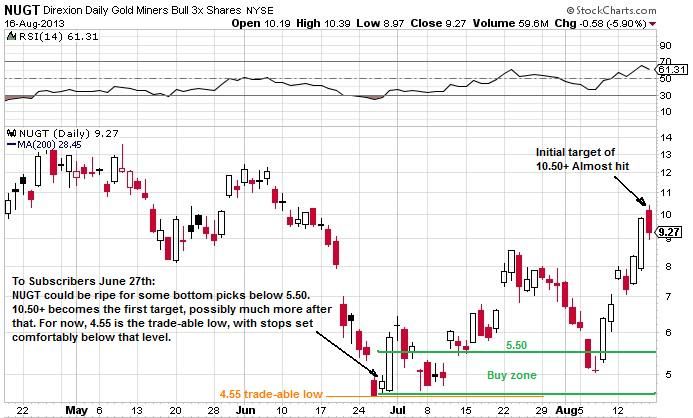
NUGT - Has played very well lately, riding up (about 100% return in just a few weeks) as expected from the long term support channel and bottom in the HUI gold miner index (currently 271ish):
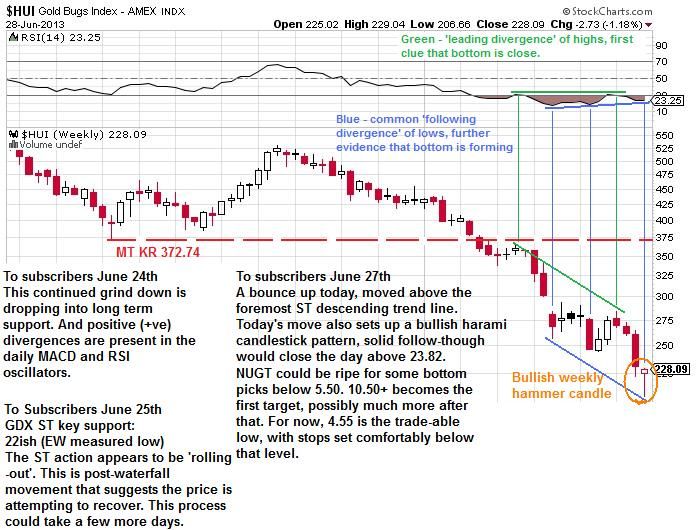


Update:


------------------------------------------------------------------------------------------------------------------------------

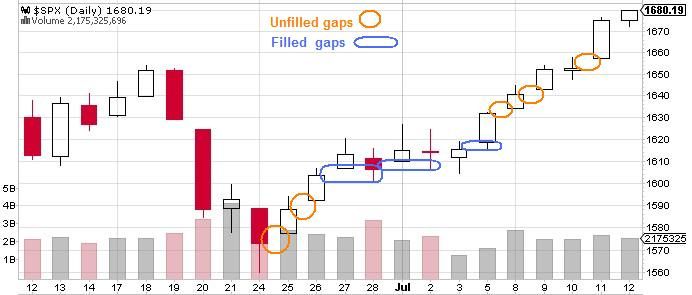
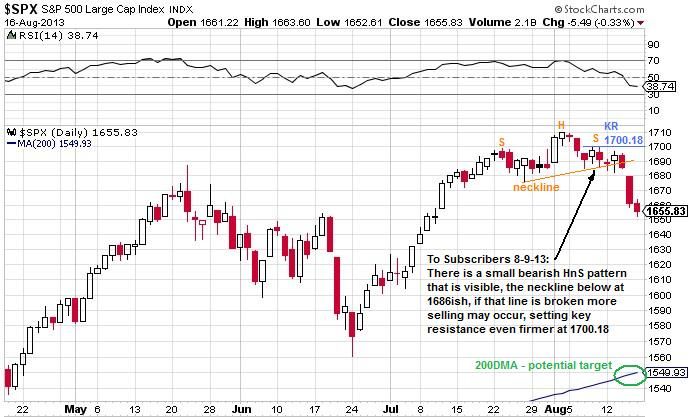
Stock Market - Has been acting 'toppy' for a couple weeks now. Here is some previous analysis that pointed out that the current run up was not likely going to last with out a meaningful correction.

From July 21st:
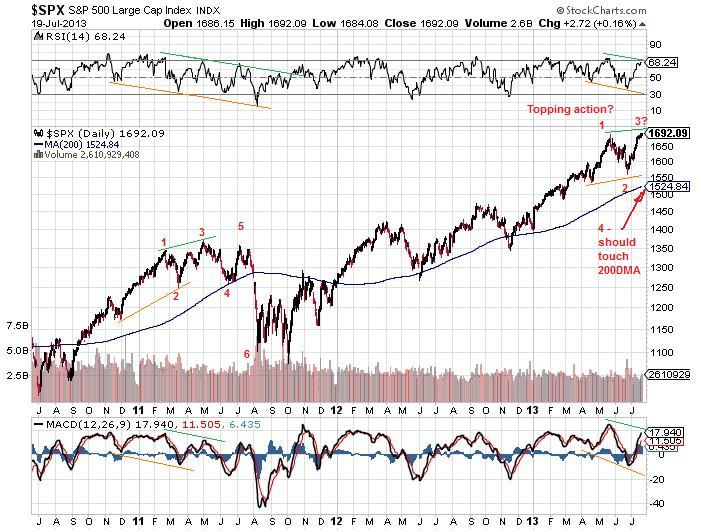

From July 14th:
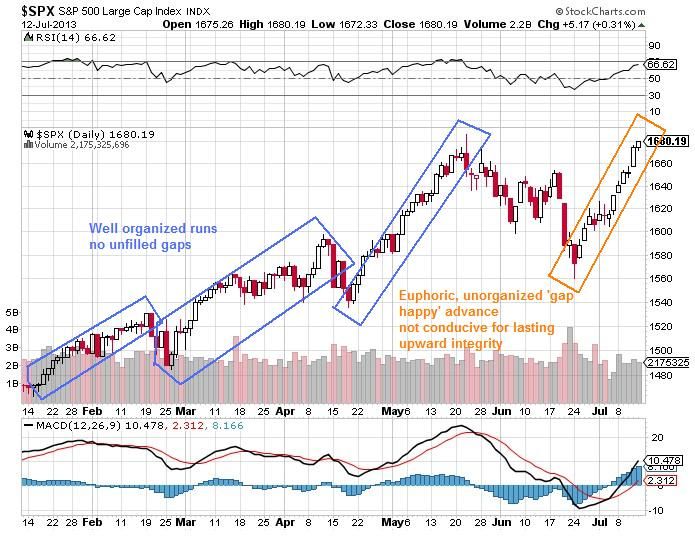


The stock market action the last several days was showing that a top was increasingly likely:
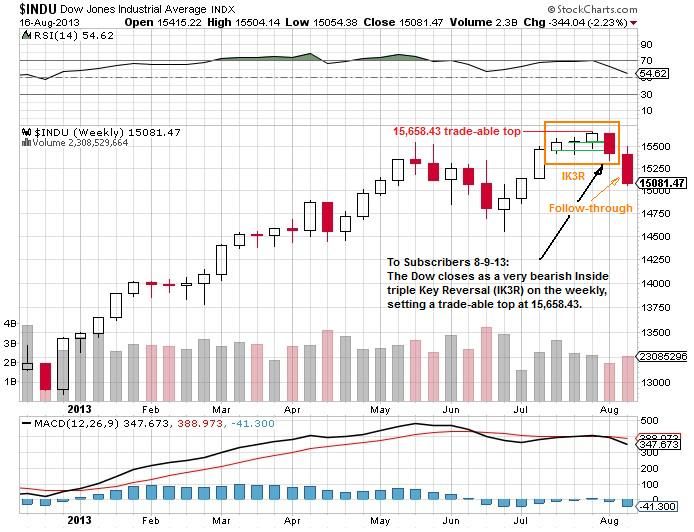


----------------------------------------------------------------------------------------------------------------------------

If you are a trader interested in technical pattern recognition for managing trades, consider subscribing to my daily email service here:
http://majormarketmovements.blogspot.com/p/mmm-market-signal.html

Good Hunting this week,
Quad G
Sunday, April 21, 2013

MMM Weekend Update 4-21-13

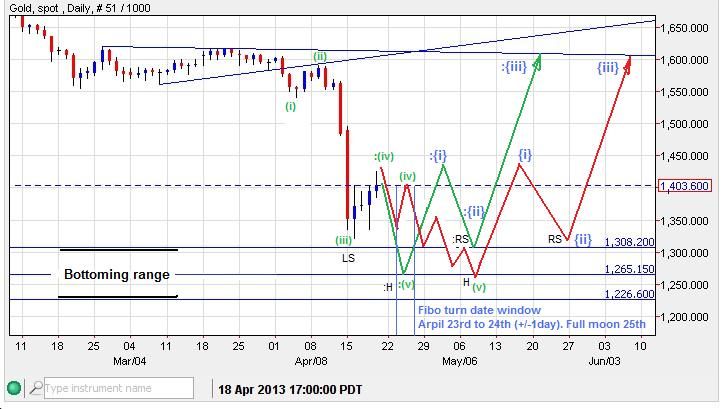
Gold - Though I understood that a break of 1520 would likely start a run down toward a target zone of 1310 to 1430, I did not expect such ferocity in the sell-off reaching the target zone inside 2 days. This run also violated the lower base channel line that I posted last week. This suggests that the channel line is relatively 'soft' support, so further selling in the weeks ahead below 1310 looks possible.

A the next support zone is between 1226 and 1308, with a sweet-spot about 1250 to 1285. With the next Fibo turn date coming this week (April 23rd to 24th +/-1 day and Full moon on the 25th) If the trend continues down into that date then a significant bottom could be forming for at least another Dead Cat Bounce (DCB), if not something greater (green projection). However, continued upward/sideways moves into the turn date window would suggest a top, with another leg down likely into May (red projection). An unexpected drop through 1226 would kill both of these scenarios to favor further downside.


Zoomed out:


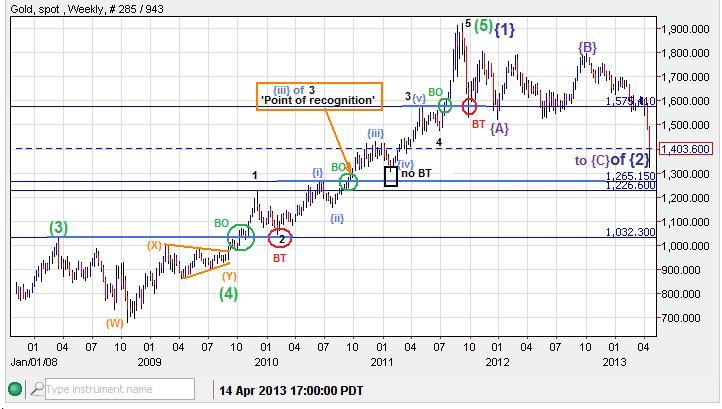
In 2010 the market advanced through its 'point of recognition'. Which is often a point at which the market has gained greater confidence in the prevailing direction. With such confidence latter corrections will often fail to back-test its break-outs adequately. The market is now correcting down in an attempt to fill that void as you'll see in this next slide. Corrections are often 'janitors' that sweep up the disorganized crap left behind by bulls and bears.


Speaking of crap, the 'dump' that the bears made last week will also likely be 'swept' up by the market Janitors at some point. For example, The New York market has yet to spend anytime in the 1404 to 1480 price range since the dump. At some point relatively soon, I think they will.

If Gold does fall down into this weeks turn date window, watch for a potential bullish hammer on a weekly basis, it should look something like this by Friday:


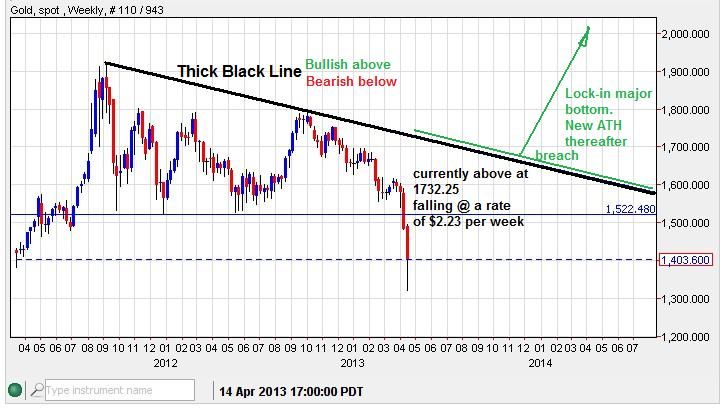
We now have a 'Thick Black Line' TBL established for the gold market:


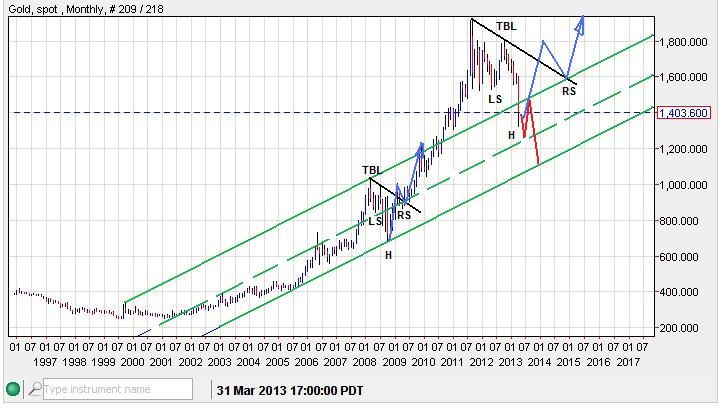
Forward looking potential if price can stay above the mid-channel line (dashed green):


---------------------------------------------------------------------------------------------------

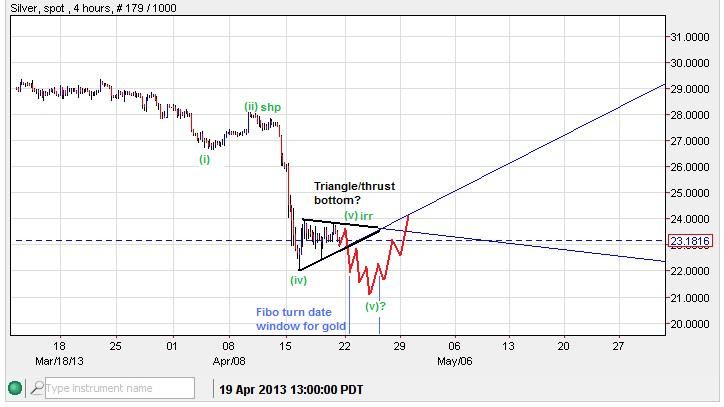
Silver - A triangle thrust bottom could be see this week. If true, the price should stay below 24.00 until heading to a lower-low.


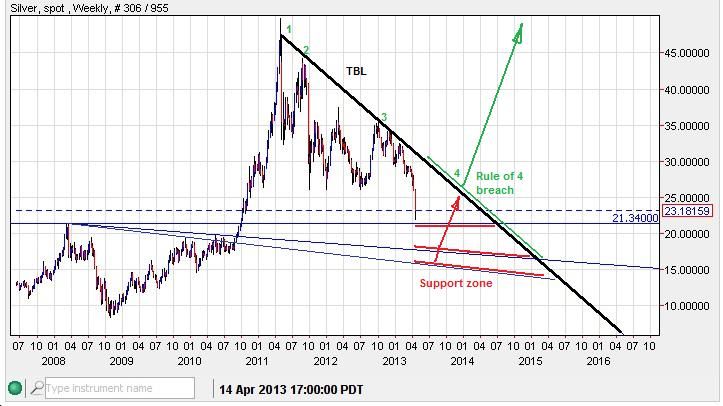
There should be plenty of LT support between 15 and 21ish.


--------------------------------------------------------------------------------------------------

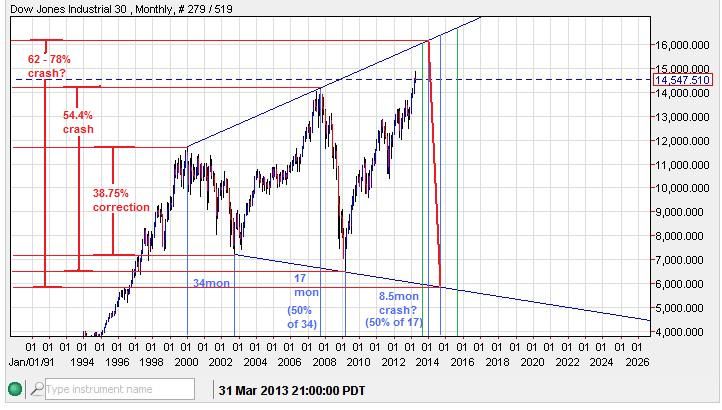
Dow - Just piecing together some cycles and measurements. This scenario looks possible if the price remains under the upper expanding wedge boundary:


-------------------------------------------------------------------------------------------------

If you are interested in receiving my daily updates on market conditions you can sign up here:
http://majormarketmovements.blogspot.com/p/mmm-market-signal.html

Good Hunting,
QG


...


Sunday, April 14, 2013

MMM Weekend Update 4-16-13

Gold - With a new multi-year low, I suspect that we are going to see alot of choppy action to the downside as those that bought above 1500 will likely be panicking out (selling) into the hands of those that have been waiting patiently to buy a larger correction. Sellers will be exiting at the bounces and new buyers will want to get in on the dips. But I suspect the trend will continue down for at least a few months as lower-highs and lower-lows are predominant. The last swing high was 1590, so the trend is MT bearish under that price.

I suspect that the ST trend will continue down into the April 23rd-24th turn date (+/- 1 day) from which a ST bottom could be seen with a bounce up ST (at least). 1440-50ish looks like a probable target by that turn date as long as price remains below 1540 in the interim.

Probably the most important thing to consider in the LT is the price staying inside the base channel. A violation of the base channel with an acceleration channel to the downside would likely kill the Gold bull for decades instead of years.

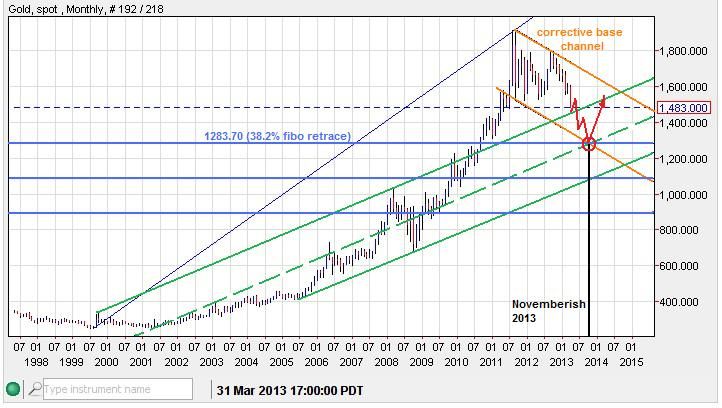
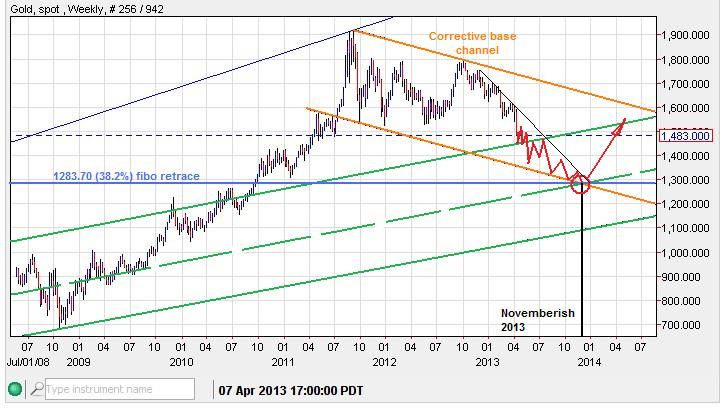
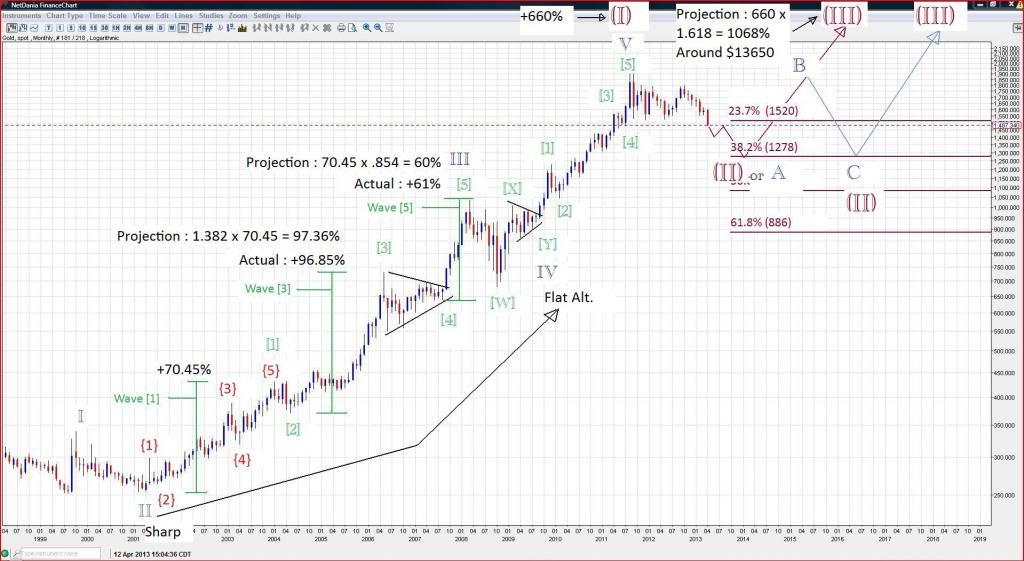
Here are some long term measurements that could be hit in the MT, the red circle is a support cluster of channel and fibo lines, converging around November 2013:


Zoomed in:


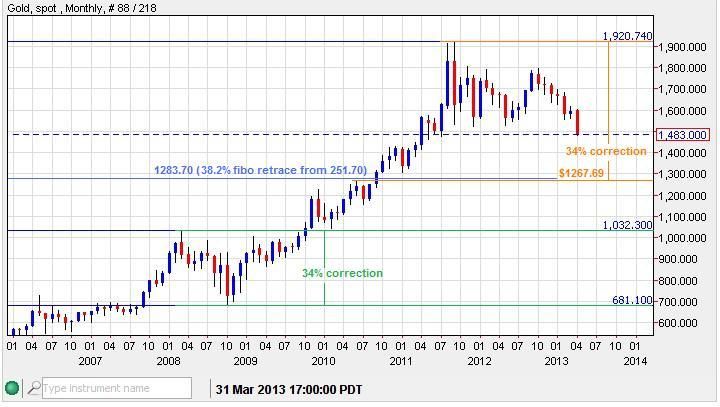
In percentage terms gold could correct as far as 2008:


My fellow contributor HoldemPlayer over at the Kitco Forums beat me to the punch with an updated LT Elliot Wave count that I too would favor at this time:


----------------------------------------------------------------------------------------------------------------------------------------

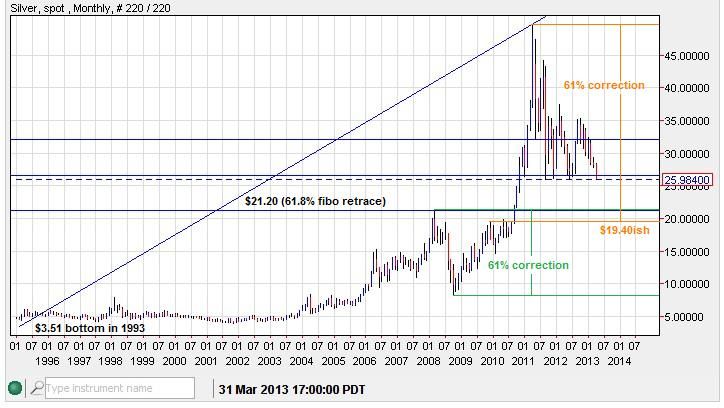
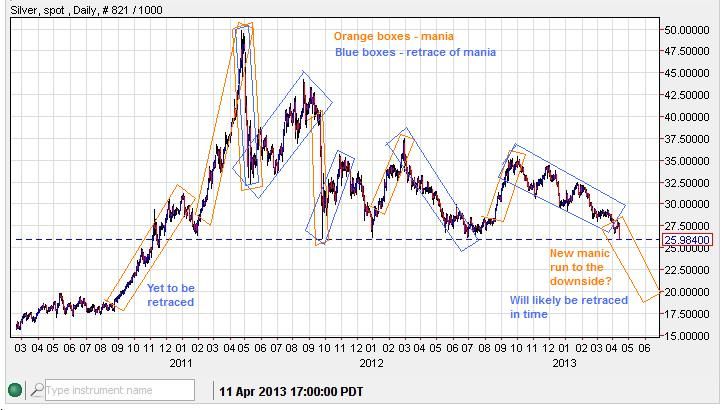
Silver - Friday's wash out closed under 26.00, this almost assures further selling in the weeks ahead. Weeks that close in the bottom 10% of their intra-week range, especially at a new multi-month low, has a very high probability of seeing further downside. Lower targets are 24.20ish (61.8% fibo retrace, not shown) of the 2008 bottom and the 2011 top. And then potetially 19-22ish after a bounce.

This larger correction is probably a larger handle of a multi-decade cup formation with the left rim at $50 in 1980, bottom of cup in 1993 and right rim at $50 in 2011. If and when $50 is broken to the upside the probability of it trading below that level ever again is significantly reduced.


No matter how far a market moves up or down in a manic run, such periods are almost always retraced as irrationality is covered by sanity.


----------------------------------------------------------------------------------------------------------------------------------------

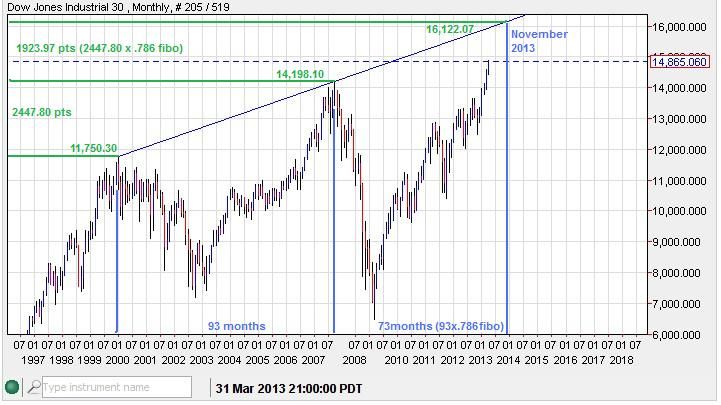
Dow - Here are some interesting fibo relationships in time and price that connect in November 2013 at a price of 16,122ish. Which just so happens to hit a multi-year ascending trend-line. Fascinating by itself, but then add the Novemerish 2013 target for Gold and I become even more attentive. A Dow/Gold ratio could continue to correct upward to 12.60ish by November and then fall toward a new low below 5.69? we'll see.


---------------------------------------------------------------------------------------------------------------------------------------

My QG3 subscription performance tracking will not be posted today. I am working on releasing a quarterly performance portfolio. I will get this posted ASAP.

Quad G


Sunday, February 3, 2013

MMM Weekend Update 2-3-13

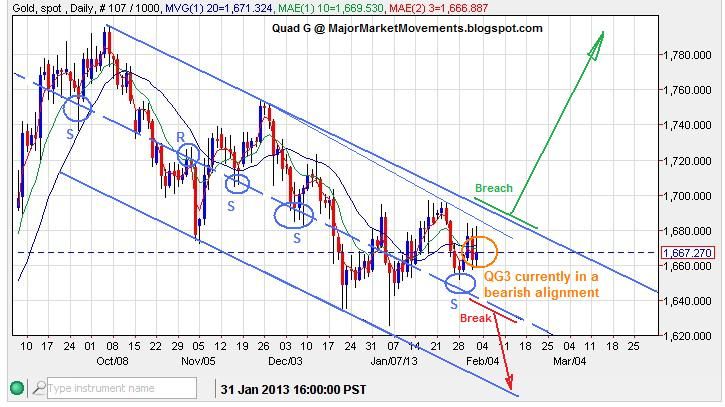
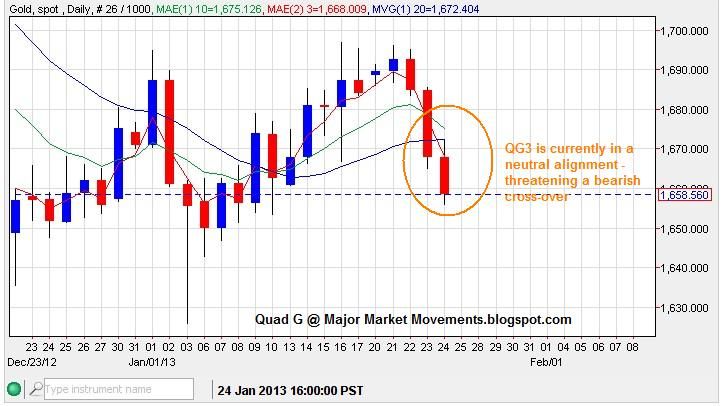
Gold - A bumpy, sideways, range bound ride has developed over that past couple weeks, ending this week with a bearish cross-over of the QG3. Which is the polar opposite of the silver market which has maintained a bullish alignment. The disparity is irregular, but makes sense to some degree. The markets are rising high on a wave of liquidity lately which the silver market in particular is sensitive to. However, the Gold market operates out of two modes - 1)Safe Niche Against Financial Upheaval and 2)A hedge against inflation. Financial Upheaval occurs when banks and countries go into default (unable to pay obligations)often making them a terrible place to keep deposits. Inflation often occurs under threat of default, a mass printing of fiat to plug a deflationary hole. Gold will move up in either circumstance, but takes time to transition from one mode to the other and can drop in that time of uncertainty, as the new money influx makes the economy appear to be getting better for a short while until the inflation mode becomes widely evident. Also understand that the Gold market itself is mostly moved by paper that is traded along side other assets. This creates a an unfortunate link between the asset values of say stocks to that of gold. For example if stocks tumbled again like they did in 2008, margin calls can wreak havok on profitable gold positions that are forced to sell.

The fundamentals can be discussed all day long, but Technical Analysis is the only pure language for trading successfully.

Gold price is in a precarious position with the QG3 making an official bearish cross-over:


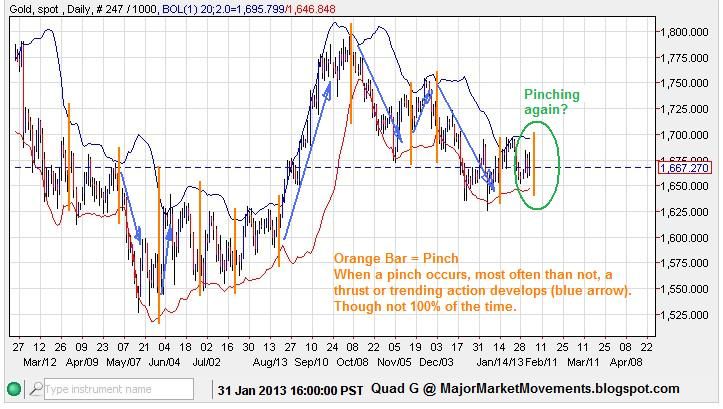
The recent sideways chop could be ending soon unleashing a run, consider the Bollinger Band 'Pinch':


The 'Pinch' doesn't necessarily point to any particular direction, it mainly indicates that an area of consolidation is about to have a break-out into a thrust or trend.


------------------------------------------------------------------------------------------------------------------------------------------

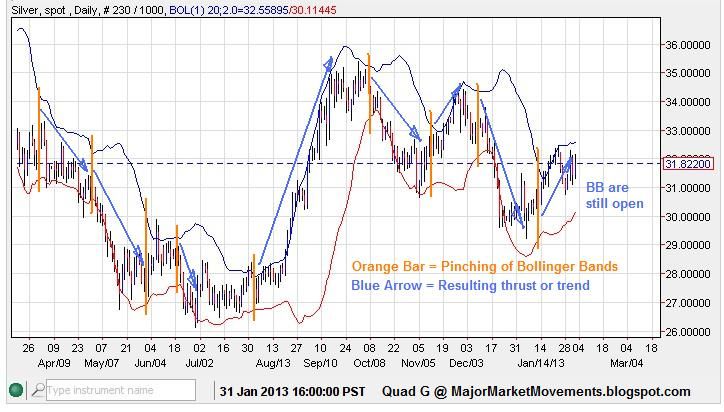
Silver - In much better shape than gold, but has also been plagued with recent chop, as though the market is waiting for something before making a firm decision:


Silver feels the 'Pinch' a little better than the gold price does, currently the BBs are open to the upside:


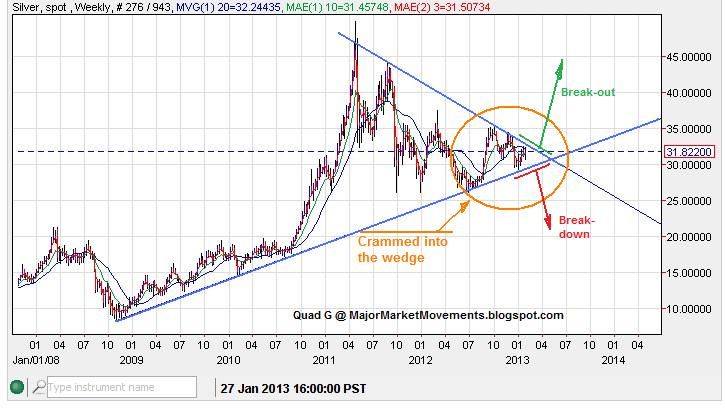
The long term picture continues to tease as price tediously oscillates inside a LT contracting wedge:


------------------------------------------------------------------------------------------------------------------------------------------

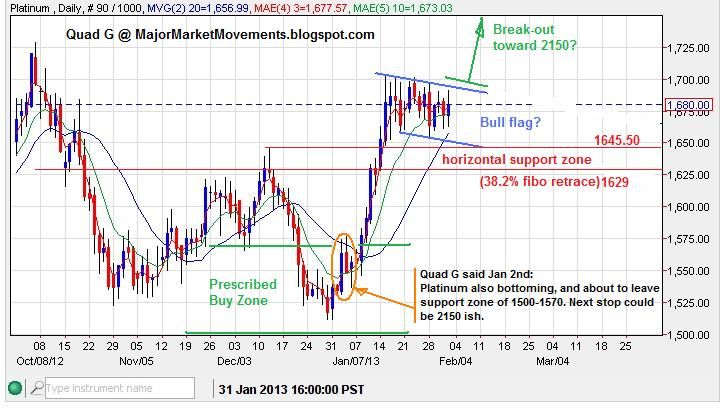
Platinum - Appears to be forming a Bull Flag, a pause in the action before another run higher. But must keep above the support zone:


------------------------------------------------------------------------------------------------------------------------------------------

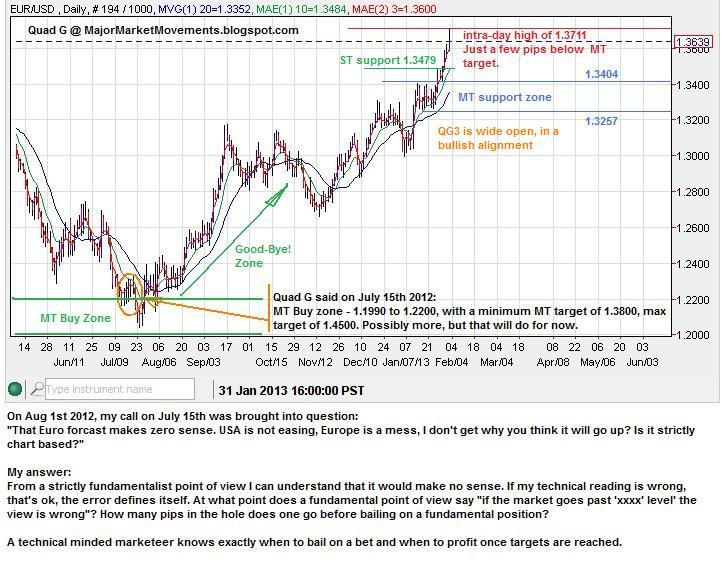
EUR/USD - Performing very nicely as expected, just a few pips away from an initial MT target of 1.3800. Friday almost closed the day with a bearish inverted hammer, no doubt some are taking profits nearing the 1.3800 level.


------------------------------------------------------------------------------------------------------------------------------------------

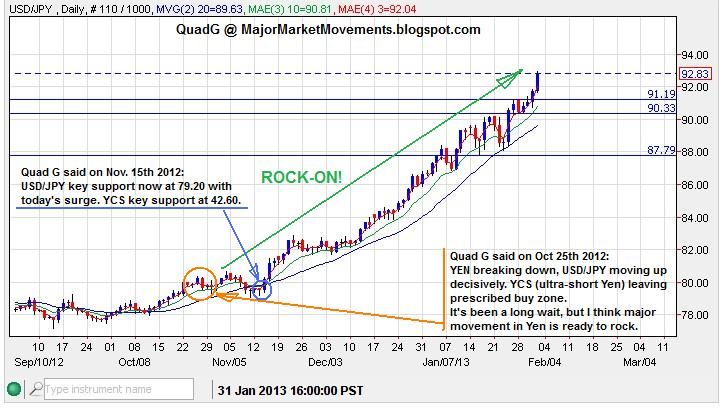
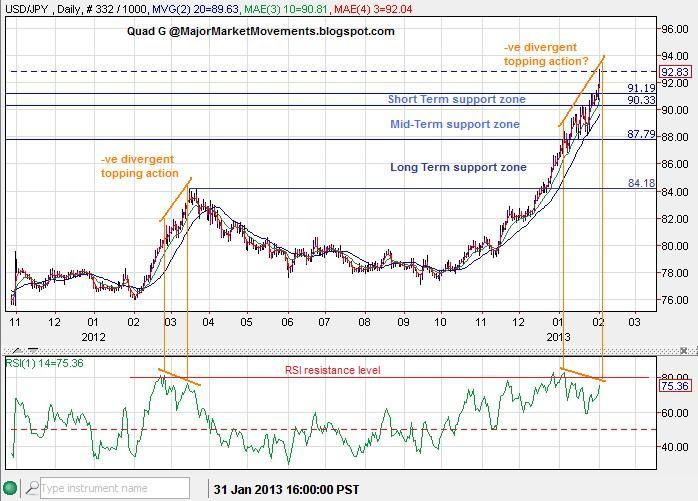
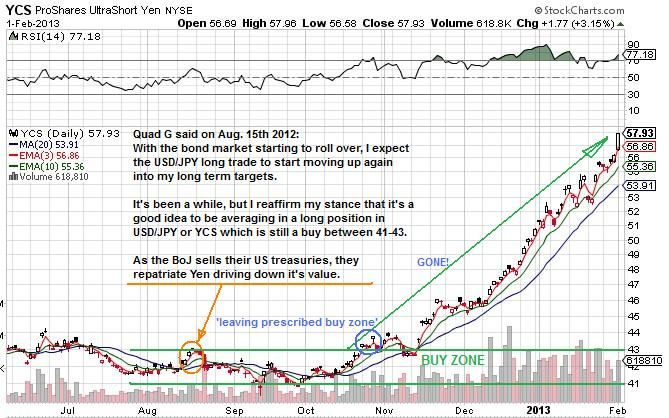
USD/JPY and YCS - It's been a spectacular and very much anticipated quick rise up. As USD/JPY is nearing 94ish, some topping action may become apparent this week and next as negative divergence in the RSI is starting to show itself:


If one had shorted just one JPY/USD futures contract back in mid-november at .012400ish, with the price currently at .010772, you'd be sitting on a gain of about 1628 pips, or about $20,350 (in about 12 weeks time) on a contract that is asking for less than $2500 in margin. But be careful of getting too giddy and greedy, the time to take profits could come very soon.

YCS is a 3x bear ETF that gains when the YEN is moving down in value:


Nice gain so far, about 40% rise out of the buy zone so far. And sure enough, the 30year Bond market confirmed a top in Mid-July.


-----------------------------------------------------------------------------------------------------------------------------------------

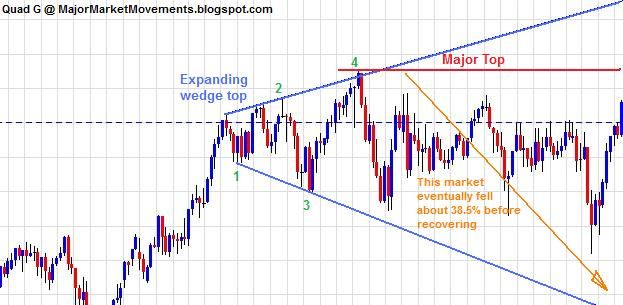
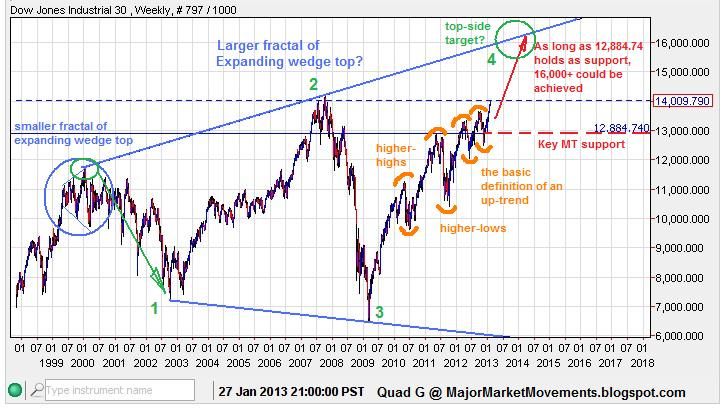
Dow - Does this pattern look familiar to you:


If not, this might jog your memory:


If the same pattern in a larger fractal was to play out, 16,000+ on the Dow looks feasible while the index continues to trade above 12,884.74. The previous resistance zone between 13,400 and 13,800, that is clearly breached, may also serve as support on any ST pull-backs.


-----------------------------------------------------------------------------------------------------------------------------------------

My QG3 Market Signal Service and related video is up and running, you can catch it here: http://majormarketmovements.blogspot.com/p/mmm-market-signal.html

I understand that the video is long, some may not have 52minutes to dedicate. With this in mind, I am also working on a static page that will show much of the same information, though not likely as detailed.

Also, I will be posting monthly results of the QG3 Market Signal Service here, as promised, in just a few hours. I want to thank all those that have decided to subscribe and take a chance with me in this new endeavor.

All the best to you,

Quad G


Sunday, January 27, 2013

MMM Weekend Update 1-27-13

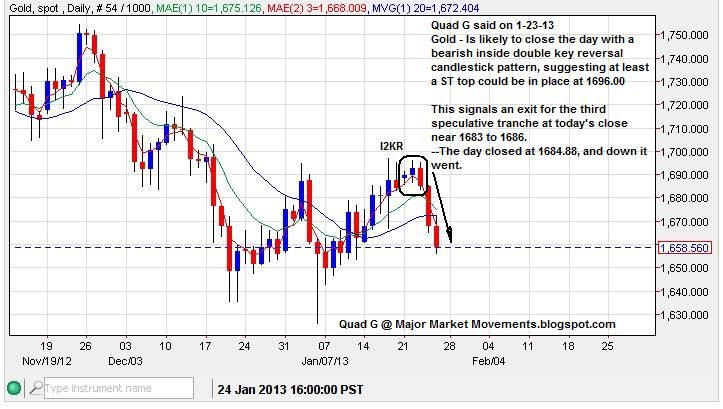
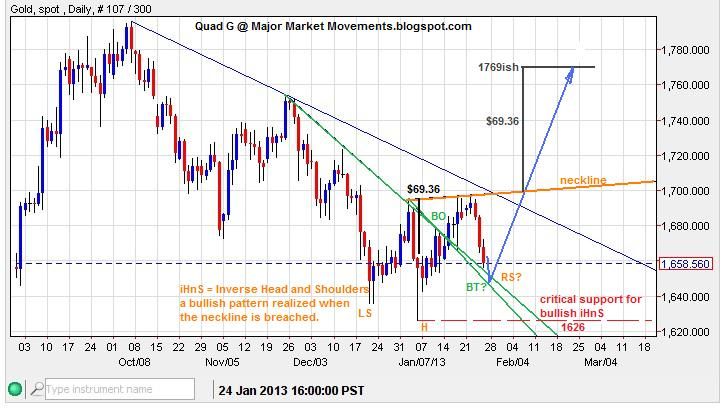
Gold - Very much in a neutral position. A confluence of bullish and bearish indicators presents a muddled picture in the Short Term (ST).


A solid weekly candle closing at the bottom 10% of it's range gives about an 85% probability that further downside with occur this week.


However, even though there is plenty of technical excuse for more downside, keep these potential bullish developments in mind:


------------------------------------------------------------------------------------

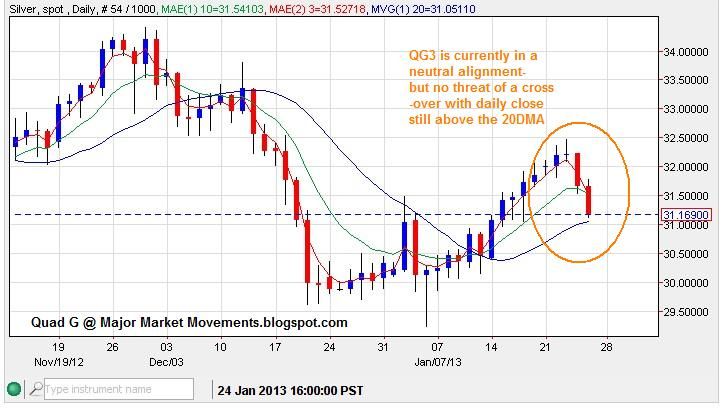
Silver - Also in a neutral position but not as far off as Gold.


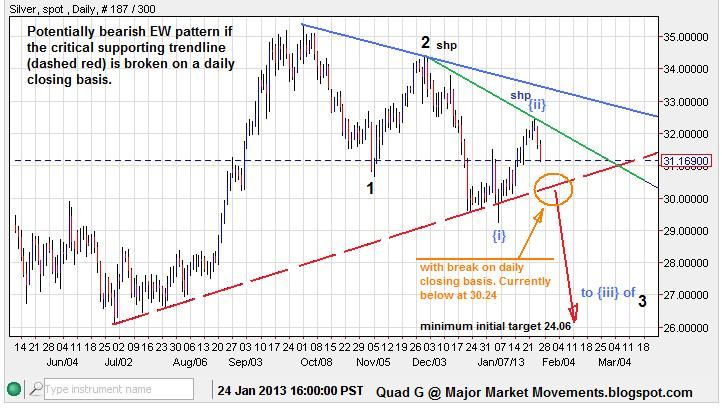
If Silver does not recover back above the green trendline soon and collapses through the critical supporting trendline (dashed red), a potential crash down to an initial target of 24.06 is possible:


------------------------------------------------------------------------------------

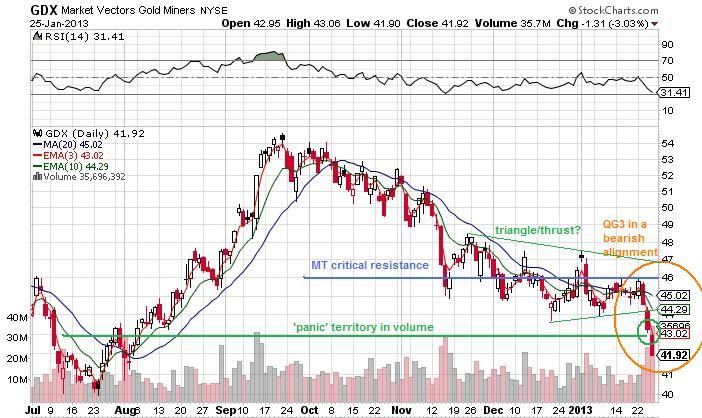
GDX - Had a solid push down last week into 'panic' territory in volume. The QG3 is bearish, so no reason to bottom pick just yet. It's prudent to keep hedges on, such as the ETF DUST. However, this could be a thrust down of a triangle, which is often the last move down before a reversal. We'll see.


------------------------------------------------------------------------------------

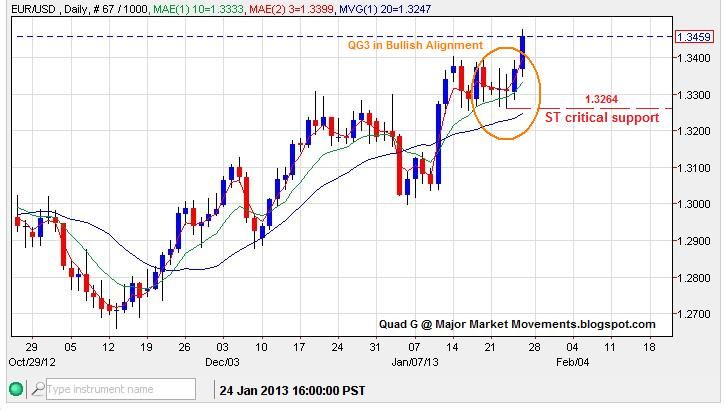
EURO - Keeps cruising higher as expected, but has set a ST critical support level at 1.3264


------------------------------------------------------------------------------------

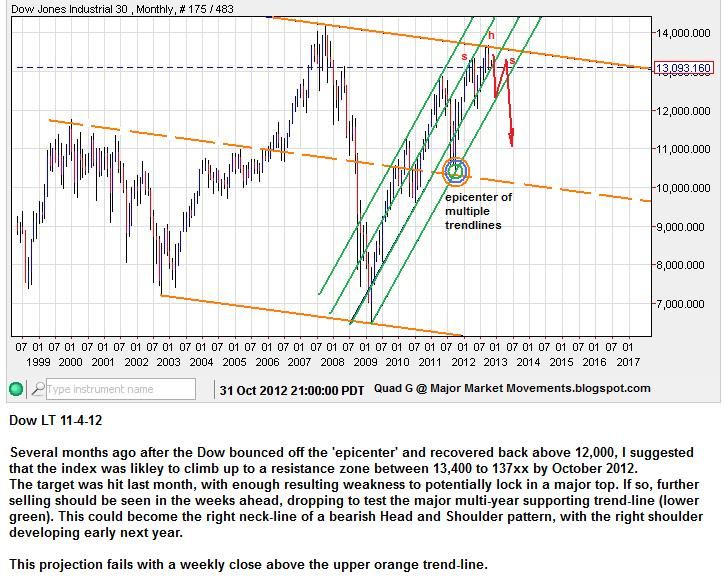
Dow - Back in November I posted this potentially bearish scenario for the Dow:


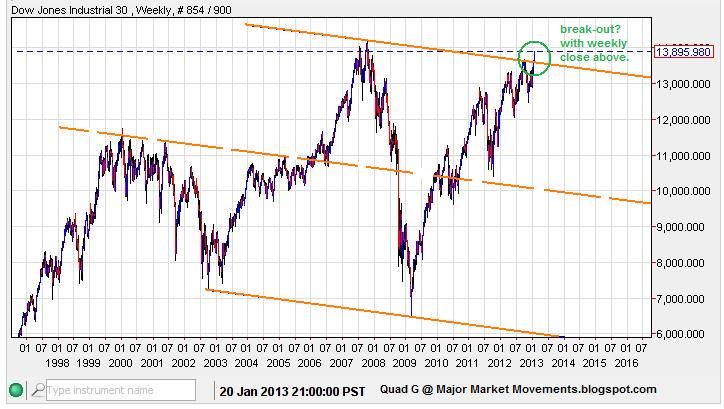
However, the Dow did indeed post a weekly close clearly above the upper orange channel line:


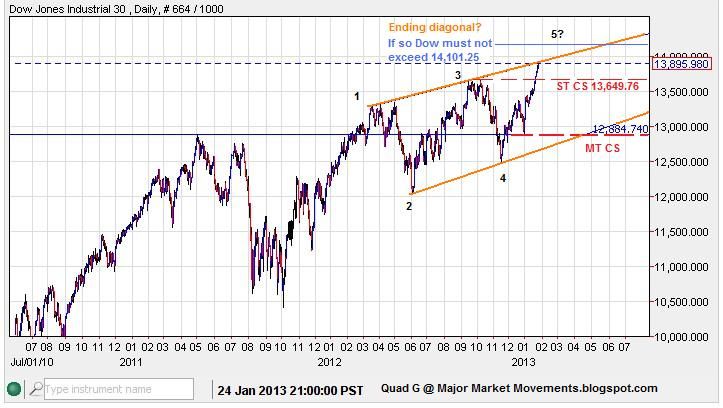
Is this just an exuberant top? or a major break-out? all I can say for now is that the Dow is likely to run higher, as long as it remains above 13,650ish in the ST.


------------------------------------------------------------------------------------

In the next day or two, I should have the QG3 video up and running. It's been a frustrating process, but I finally have some of this video recording/editing business figured out.

I will also be posting my QG3 trading results next weekend, so far it has performed very nicely since December for multiple markets.

All the best,

QG