Tuesday, August 30, 2011

SPY - Dead Cat Bounce at the end of HnS Projection?

Back on July 7th 2011 I posted this article about a possible bearish Head and Shoulder (HnS) pattern for the stock market using SPY: http://majormarketmovements.blogspot.com/2011/07/spx-bearish-hns-pattern-near-completion.html

Here is the chart:


The neckline is a common trend-line drawn between the low points of a HnS between the shoulders and the head. This is the 'trigger' point upon which the HnS projection plays it's hand.

Here is an update of that neck-line break and it's result using SPY:


To measure a HnS projection a measure is taken from the neck-line to the head of the pattern. Then at the point where price moves below the neckline the measure is applied. In the case above, the fall from the Head to neckline was about 11.5pts, this measure is then applied to the underside of the neckline to gage a target price. As you can see in the chart above the price met and exceeded that projected target. A HnS measure like this gives an initial target and does not always mark a bottom. The same rules for applying the HnS measure and projection apply to inverse Head and Shoulder patterns also (iHnS) which is the mirror opposite Bullish pattern.

Now that the HnS pattern has played out, I suspect that a 3 wave Dead-Cat-Bounce is about to be completed. The last leg up right now should start to enter resistance while above 121. The volume on the upside should continue to dwindle as volume on the downside increases. Also watch the 50 to 60 level on the RSI (14) daily, it is often a zone of resistance in a strong bear market. Bears will want to see price stay inside the base channel (yellow) as it proceeds higher to meet various resistance levels indicated. I suspect a top is possible this week or early next. When price falls back below 114 it should confirm the conclusion of the DCB and proceed to fall to lower-lows. A SPY price of 101 or lower looks very possible, producing a 17% or larger drop from 122ish.

The leveraged ETF - SPXU and it's cousins are excellent ways to take advantage of sharp ST drops in the stock market. However, it's best to gage entry and exit points for SPXU based on non-leveraged price action such as SPY, or indicies SPX (S&P500) or the Dow Industrials. From the July 7th top SPY fell approx 19% in just over 20 trading days. At the same time the 3x leveraged inverse ETF - SPXU gained just above 70%. This is not a recommendation to buy or sell any ETF or other equities, for informational purposes only.

Join the MMM Weekly Round Table Discussion here: http://majormarketmovements.blogspot.com/2011/08/mmm-weekly-round-table-discussion-82911.html

Good Hunting.


...

Morning Coffee with Quad G - 8/30/11

Mornin' all,

Case/Shiller home price and Consumer confidence numbers out today. Both are likely to come in lower. The Case/Shiller numbers have finished a multi-year dead cat bounce and the next big slide in real-estate prices are likely underway. I've mentioned this many times before, that a second leg down in RE should begin this year and will likely keep falling into 2015 or later. If my outlook is correct, home prices may come down to their late 1980 to early 1990 levels.

Gold - With the potential for the SM to take another dive lower soon, PoG may see some of the exit money. With 1822 taken out this morning key support is now at 1800. There are multiple EW counts that can be seen, so not very useful at this time. The 3/10/20 is still MT bullish while daily closes remain above the 10EMA (currently 1800).

Silver - The EW picture is far more clear than gold's. Silver may advance higher toward 44+ soon but MUST stay above 38.70. The 3/10/20 is also bullish with daily closes above the 10 EMA (currently 41.00).

USD - Here is the chart that explains much:

For 3 months USD has found support at the 73.40 level. As the trading range narrows a break-out is likely to occur soon. Piercing the green trend-line should initiate a short squeeze that could push the index higher toward Critical Resistance (CR) at 76.70ish. If 76.70 is breached then much further upside in possible, likely on the back of a major market crash. However, breaking 73.40 can be just as powerful, likely many stops are below that level, tripping them would likely force a strong sell off as another bottom is searched for.

Copper - needs to exceed it's base channel soon to the upside to stay bullish, that level is near 4.25 at this time. Shying away from the top of the base channel and falling impulsively back below 3.93 would be bearish and invite more selling.

Dow - Moved back up to the resistance zone above 11,500. If my view point is correct the Dow should not exceed the upper base channel line (currently above at 11,744 today). There is a pocket of resistance between 11,555 (lateral S/R) and 11,679 (50% fibo). Beyond that is a very tight cluster of resistance between 11,862 (lateral S/R) 11,886 (upper daily Bollinger Band), 11,932 (61.8% fibo) and 11,937 (50DMA). 4 types of resistance currently in a tight range of 75pts. The last 'C' leg up of this dead cat bounce could be finished this week or early next and then resume with it's next plunge lower to sub-10k as part of a very long multi-year campaign to reach sub-3000. This bearish projection is in jeopardy if the Dow climbs back above 12,000.
I will have an article on SPY (ETF of S&P 500) out shortly.

Natural Gas - Natgas could be finishing up the D wave down before a E wave up. Price should bounce off the lateral support area between 3.70 and 3.85. If 3.70 fails then natgas will more likely attempt to fill the gap from last October, continuing to move down toward the 3.40 level. That projection can be seen here: http://majormarketmovements.blogspot.com/2011/07/natural-gas-still-inside-long-term.html
The seasonals may kick in soon, as you can see, a significant low is possible this early September:

Keep up with the conversation here at the MMM Weekly Round Table: http://majormarketmovements.blogspot.com/2011/08/mmm-weekly-round-table-discussion-82911.html


Good hunting folks.


...

Monday, August 29, 2011

MMM Weekly Round Table Discussion 8/29/11 to 9/4/11

New discussions for the week can be posted here. I will try to keep a link to this section at the end of all articles that may follow this week. I cannot find a way to 'sticky' this section to the top of the blog. This section will help me find and answer questions and comments much easier, as apposed to be being scattered amongst multiple articles. Please use it as much as possible when you have general comments or questions about the markets or the blog. Thanks!


...

Morning Coffee with Quad G - 8/29/11

Mornin' all,

Gold - So far since the open, gold has consolidated above the 10 EMA. Daily closes above the 10 EMA will keep the MT trend positive.

Silver - Also attempting to consolidate above it's 10 EMA. Critical support for silver is at 38.70ish.

USD - For 3 months now USD has formed a base at the 73.40 level. A 4th attempt to break that base is in progress. The 'rule of 4' says that the 4th attempt to break a level is often successful, but if the market fails to do so the price can swing strongly in the opposite direction. In this case, if the current ST downtrend fails to bust 73.40 soon, then USD bears may have exhausted themselves and bulls will be able to run it higher. The ST upside break-out point is above at approx. 74.46.

Soybeans - Here is the previous chart for reference posted:
(click on chart for full view)

Beans have broken out above the large Bull flag, now at 1427, making a nice bounce off key support below 1300. The break-out at some point may move down to back-test that break-out, then afterward move higher. Ultimately I think the 2008 highs at 1600 could be tested soon.

Corn - looking bullish while above 720, the current uptrend from 690ish could be an impulsive 3rd wave that is not yet complete.

Wheat - The key support for wheat is at 700. So far wheat has managed to challenge it's downward sloping multi-month upper trend channel line at 770ish, but it's approach is somewhat lazy. Bulls will want to see that 770 level breached with conviction and soon.

Dow - Is very close to moving up to the resistance zone again 11500 to 11800. However, the RSI (14) on the daily has hit 50. In a bear trending market, the RSI will often turn down from the 50 to 60 level and rarely exceed 60. I think this current move to the upside is a C leg of a 3 wave corrective pattern to the upside, Upon it's completion another strong move down should develop heading to sub-10k if my interpretation is correct


...

Sunday, August 28, 2011

Gold - Update 8/28/11

Last week closed on a very bullish note, weekly chart:


The weekly chart posted a Bullish Red Hammer candle for last week. To maintain the bullishness of this candle, this week's close must remain above 1702.48. Also, if last week had closed below the previous week's low of 1732.80 it would have posted a bearish Outside Key Reversal (OKR) on the weekly, that would have been very bearish. However, with the Red hammer instead that potential has disappeared.

The daily chart shows even more bullish behavior:


As you can see, the 20DMA has given support over the last 3 days, 2 intra-day bounces and a daily close above to produce a bullish hammer candle. The 3/10/20 had moved into a neutral alignment for a day, but Friday's action returned the ribbon to a bullish alignment which can be maintained with continued daily closes above the 10EMA (currently 1797).

The Elliot wave picture is at an important cross roads:

Friday's close ended just below the 61.8% fibo retrace and the Blue base channel. The Base channel often defines an ABC corrective move (orange :(a),:(b):(c) count) or helps confirm a 3rd wave break-out (green (i), (ii), (iii), (iv), (v) count).
Red Projection - If PoG continues the buying spree and moves above the base channel early next week, staying above 1795, then an impulsive 5 wave structure will be built which could lock-in the wave 2 black low at 1702.
Blue Projection - an early sell-off next week rejecting the 61.8% fibo and upper base channel line, impulsively moving down below 1763 would suggest a retest of the previous low is possible.

Zooming out we can see how these moves would play in the larger MT picture:


A third leg down of an ABC zig-zag would be possible with the conditions of the Blue projection. An obvious target is the daily gap up (1662 to 1682) and the 61.8% fibo at 1643. These are obvious targets, however a very bullish market may not be generous enough to fall to those levels. Again if the blue base channel is breached the low at 1702 could be as good as it gets and wave 3 black higher may be underway. Keep in mind that the 1643 level guards the MT trend higher, falling below that level puts the MT count in jeopardy, not dead, but in trouble. Death would come with any move below 1478.

Wave 1 black moved higher (complete at 1912) than earlier anticipated. This suggests that the next wave up, 3 black, has a new minimum target of 2136 and possible extended target of 2614. Afterward a wave 4 black pull-back (likely irregular,flat) and then a final 5th which could move 'crazy high' then have an even crazier crash.

As I said before the original Primary count up from the 1999 low is technically complete for a major multi-year top. Moving below 1478 impulsively would confirm that view. This is not my favored view at this time, I still think PoG has only finished the first stage of this mania blow-off top as the 5th wave continues to extend higher ala 1980.

Good Hunting.


...


Trade School - Gold 8/28/11

On Friday I saw PoG come up to test the underside of the 10EMA at about 1795ish, The action was starting to look like a rounded head, potentially bearish at a key resistance level (the 10EMA). However, a ST move suggested that a potential to break higher was possible, here is what it looked like:


PoG gave a triple bottom at 1763 with a higher high above 1795, this was a signal that gold could break the 10EMA and move up to the next resistance near 1823.

Here is a zoomed in view of the action:


After my comment at 7:28AM (PST) PoG came down and gave 3 relatively small risk entry points between 1769 and 1775, longs at this point would have risked $6 to $12, for a chance to test 1823. That was an approximate Risk/Reward/Ratio of 1:4 which is very good, 1:3 or better is usually worth while.

This trade could have fell apart, no guarantees, however, the risk was well defined and small. If the blue projection would have played out instead, you would have seen 1763 break likely with a large influx of volume as Stop Losses (SL) are hit. Perhaps a good place to 'flip a trade' quickly go from long to short (ST day trades only, IMHO.) An example of 'flipping a trade' would have looked something like this:
-long position, 3 contracts at 1773.
-SL at 1762 selling 4 contracts.
-Of the 4 contracts, 3 exit the long position for a loss, but 1 new short position is also added to take advantage of any further downside on the break of 1763. The number of contracts can be adjusted as desired.

The 1823 level was breached and the day closed well above the 10EMA, a very bullish move.


...

Friday, August 26, 2011

Trade School - Gold 8/26/11

The recent plunge in gold price gave us a good look at a couple useful patterns that could have been traded off of.

This first is a common rounding over pattern that often occurs in a market that is working on a capitulative sell-off.


Once the the price starts to round down and move below the previous low this is the opportunity to sell or go short. In this case moving below 1823 was the key to further downside.

After the break-down many were wondering where a bottom was at. If you were up very early that morning (2am to 6am PST) you would have seen this bullish pattern and had a chance to take advantage of it.


The end of the shadow of the first red hammer candle was the stop-loss level, under 1702.90. The shadow of the second blue hammer candle was the entry, in this case you would have saw a panic sell down to 1704 then the rebound (approx risk of $2 near the lowest point). This particular set up gave a very low risk buy op. Risking less than 1% in the price of gold these days ($17-19) is very low risk. Of course you have to be awake to be able to see these opportunities. I've noticed that when the market is charging hard either up or down, many of the key tops and bottoms occur in the low-volume hours of the night and early morning.


...


Morning Coffee with Quad G - 8/26/11

Mornin' All,

Gold - I currently suspect at this time (check time date stamp) that This move up in Gold from 1700 to 1794 is a dead cat bounce. Bulls will want to see a lazy move down to re-test the lows of yesterday to finish a 3 wave move to the downside from the 1912 top. Many observe the gap that is below between 1662 to 1682. This should provide significant technical support, if PoG moves below that level it could suggest a serious problem for the bulls.

Silver - If my running flat correction count is correct, the low at 38.72 should be locked in. Any 3 wave move to the downside, staying above 38.72 looks like a good buy op in my opinion. Fibo retrace levels of 40.22 (38.2%, already hit with a bounce), 39.94 (50.0%), 39.65 (61.8%, should be the strongest support) and 39.25 (78.6%, is also strong support). The closer that Silver drops in 3 waves toward 38.72 the less risk that a long position trade will incur. If we see that type of move that I am suggesting, the next wave up should quickly advance back up to 43+, at which point 41.15 will become key support.

Dow - looks like it is working on a C leg of an ABC corrective pattern to the upside. 11,500 to 11,862 is the resistance zone. I still maintain that major downside risk in this market is available. I think any further upside will likely end before the close of next week. If some sort of QE3 is offered this weekend at Jackson Hole, I do not think it will be enough and the majority of speculators will eat up commodities, leaving scraps for the stock market. No QE3 suggests more deflation sets in, and risk-off trades receive the most attention (gold, treasuries, cash).

USD - Daily chart shows a slightly falling wedge which looks bullish while above 73.30. USD moving above 76.72 would be a decisive show of strength. Moving below 72.70 would invite a test of the 2008 lows at 70.80.

Good Hunting.


...

Thursday, August 25, 2011

Silver - Update 8/25/11

The previous sharp correction interpretation for wave {ii} blue died with a cross yesterday of 39.80. But this move has set up a potential running flat correction instead:


Running flats are typically very bullish structures, to confirm, silver needs to move quickly upward and reconquer 44 inside a few days time. Be warned that any choppy lazy moves that stay below the 10 EMA on a daily closing basis are potentially very bearish causing the lower-channel line to break could ignite another cascade.


...

Gold Update - 8/25/11

Hey All,

Gold - The move down from 1912 (spot) has now exceeded the 8% mark and outside the previous wave 3-4 zone with a move below 1722. This is now moving into a level of correction that may take months instead of weeks to recover from.

Many have often heard me mention the 1-3% zone, 5-8% zone, 12-15% zone, and then the 25-38% zone. These zones mark the magnitude of various corrections, each with their own consequences:
1-3% correction - Typically takes a few days to recover.
5-8% correction - Typically takes a few weeks to recover.
12-15% correction - Typically takes a few months to recover.
25-38% correction - typically takes 1-2 years to recover.

With the 8% level exceeded, further selling into the 12-15% area would mark (at a minimum) a month or more of recovery before new highs are seen. However, such a move would be very odd for this time in the seasonals, never before since the bull market started in 1999 has August been a significant topping month.

Considering the 12-15% correction window, we can see various other support levels with-in that zone:


The gap support and 61.8% fibo retrace level are also in this 12-15% area.

I mentioned the weekly turn date window for Gold that started last week of the 14th, along with the daily turn date window around the 18th has initiated this significant turn. Most of those turn weeks have produced swings lasting 4 weeks to dozens of weeks.
This turn may be no exception. This is why I would have preferred a low into that turn date instead of a high, but I do not get to decide these things.

The EW pattern up from the 1999 bull market low is also technically complete with a full set of waves, it is entirely possible that a major top in Gold has been finished. However it cannot be confirmed until Gold moves below 1478. The MT structure that I have favored, pointing to gold hitting 2500-2700 by 1st quarter 2012 will be in jeopardy if Gold moves below the 61.8% fibo retrace level at 1643. Gold will also need to make a choppy 3 wave structure moving down into this support area 1606 to 1682, a 5 wave impulsive structure into or exceeding this support zone would be very bearish to the long term picture.

Silver is showing some strength here, while gold falls much lower. The GSR has kept under the key resistance of 45.20, but is at a point where it needs to fall back down to 40 sharply very soon or risk further upside.


...

Tuesday, August 23, 2011

Silver - Further advances into wave 5 appear underway 8/23/11

Here was the Long Term picture posted back in July:


The anticipation was a completion of wave {i} and then a potential sharp pull-back for wave {ii} before moving higher into wave {iii}:


A wave {ii} sharp looks complete and now wave {iii} is working it's way higher:


In the ST, silver needs to stay above the critical support at 39.80 and bounce off a support zone between 41.40 and 42.60 to finish a small irregular wave iv (black). Then a wave v (black) up to 45 to 47ish fairly soon. Any move down below 41.00 at this time puts the count in jeopardy, below 39.80 kills it. If 39.80 happens to be taken out, then the threat of much deeper declines are back on the table.

The GSR is ready to fall to 25 to 16, giving silver a performance advantage over gold likely for the rest of the year. But the GSR must remain below 45.20, moving back above that level puts the downtrend in jeopardy.


...

Sunday, August 21, 2011

MMM Weekly Round Table Discussion 8/21/11 to 8/28/11

I see a need for a central place for comments and questions. You are welcome to post in the comment section and I will respond when I am able.
I will also use this weekly section to post ST alerts and updates not covered elsewhere.


...

Crude - Fibo Turn Week suggests a bottom may occur this week

The time fibo measurement tool lines up many bottoms and one top. The 55th measure points to this week. The trend is clearly down into this weekly window of time, perhaps a good place for a significant bottom:


On the daily chart a double zig-zag looks possible with one more small leg down to a lower-low. The 50% fibo retrace level is at 74.00, perhaps we'll see an attempt on this level then a rebound.

...

Platinum - Long Term Perspective 8/21/11

Platinum has certainly been a laggard in this metals bull market, most likely because of it's dwindling industrial demand since the cheaper upstart palladium has robbed it of market share.

No doubt recent gold bullishness should prod platinum a bit higher with bullion demand. Even though platinum is more rare than gold, I think the industrial component of platinum has caused many bullion investors to shy away.

The technical picture shows the complications, as platinum is still the one precious metal still under it's 2008 high. As silver, gold and palladium have enjoyed terrific impulses to the upside, platinum has only seen incremental increases.


The long term EW picture shows a potential double zig-zag up from the late 2008 bottom. With a triangle ending and a 5 wave move higher in the next few months, a potential LT top could be established soon. Critical support for this EW interpretation is 1676, any move below this level in the ST kills this interpretation.

Here is a closer look:


The recent week's action has certainly been impulsive, breaching a multi-month trend-line (orange). A back test of that trend-line may occur soon, giving a potential opportunity too enter a long position. Such a back test would need to be 3 choppy waves down. Any sharp reversal that falls back below 1676 may suggest a MT bearish rejection from a triple top zone between 1865 and 1900, and {C} wave down might start earlier than expected.

However, I personally favor further advance for all the metals, including platinum into the first quarter of 2012.


...


Friday, August 19, 2011

Morning Coffee with Quad G - 8/19/11

Gold - upon breaking 1818, gold has accelerated once again as expected. This bull market is in it's mania phase, getting in an out is likely to be very risky. However with MT long positioning the 3/10/20 ribbon is a good guide for using trail stops:


The 3/10/20 is not going to find potential tops or bottoms, but will help you enjoy the majority of a swing trade. Elliot Wave can help find tops and bottoms but are best to enter and exit with smaller ST positions. ST positions can often roll-over to the MT category after a trend has been firmly established.

Gold bullish while above the 10EMA and a swing low at 1723.

Silver - Has made a bullish cross-over in the 3/10/20 ribbon:


to maintain this bullish alignment, silver needs to keep daily closes above the 10EMA (currently 40.11). From an EW perspective, silver needs to stay above 39.80 to keep an impulsive trend moving to the upside.

The previous silver chart:


The PMs are being very stingy with it's corrections. Wave {iii} blue could be under-way, but PoS must stay above 39.80 at this time.

GSR - Looks like a top is in. Now the wave 5 down toward 16 to 25 could be underway. Currently bearish (PM bullish) while the GSR is below 45. Here is the previous GSR article for reference: http://majormarketmovements.blogspot.com/search/label/Gold%2FSilver%20Ratio%20%28GSR%29

Dow - I was keeping track of the SPX, but since netdania does not carry the SPX (S&P500) I will have to use the inferior Dow industrials. Currently the Dow is under selling pressure while below the 10 EMA at 11,331. Target range for this current descent is about 9600 to 9900.

Gotta run folks,
Stay Frosty,

QG

Thursday, August 18, 2011

The Stock Market - From Love to Hate

A friend of mine was recently discussing his grandfather's attitude toward investing. Having grown up during the great depression and witnessing the after-math of the stock market collapse from 1929 to 1932, he and many of his generation have carried with themselves to this day a lingering distrust for the stock market. It's hard to believe but the darling investment of the past several decades was once reviled by the masses some almost 80 years ago. In my estimation we are clearly in the winter season, with another 8-10 years to slog through. For further study, here is a look at the 80 year Kondratieff Long Cycle: http://northcoastinvestmentresearch.files.wordpress.com/2009/01/kondratieff-cycle.jpg

So what does a transition from love to hate for stocks look like? I can think of no better model then that of the past. Here is a look at the stock market crash from 1929 to 1932:


If we were to compare similar moves to that of the stock market crash of 1929 to 1932, I would say the 'dodged bullet' has made a u-turn and homed back in! From the market high in May 2011 at 12,876 an 85% decline would target a Dow of 1,931 points. Does it take this kind of extreme to cause the majority of investors to despise stocks? Since the 20 year 'Winter' is only half way complete, having started in Jan 2000, there is still plenty of time to find out.

The January 2000 top in the market initiated a customary multi-year rounded top. With the latest drop of the last few weeks, the SM is now negative after 11+ years. How frustrating is that? Minus dividends the SM has basically moved in a neutral sideways pattern for 11 years. This has certainly set up a bit of disillusionment with many investors for the first half of this winter cycle. But Stocks have yet to feel the 'hate' by the masses that signifies a long term bottom. I think that time is approaching and quickly.

From my point of view, the stunning fall that started a couple weeks ago is but a drop in the bucket compared to what I anticipate to happen.

Let's take a look at the Dow industrials long term topping action:


From the year 2000 the SM has basically created a very large, rounded head and shoulder pattern. The right shoulder of the pattern appears to be clearly defined as a sharp 3 wave correction labeled wave {2} blue. If this interpretation is correct, the top set on May 2nd at 12,876 should be locked in, most likely for 2 decades or longer before it is exceeded. The Wave count to the downside is idealized. As always I will adjust the count as needed on a wave by wave basis. Similar to the 1929 to 1932 collapse, the next phase is likely to be prolonged and deep.

Zooming in closer we can see a bit more detail and the possible set up of another bearish HnS pattern:


If the Dow continues it's sell-off toward a lower-low preferably into a support zone between 9600 and 9900 this should complete the right neck of another bearish HnS with the built-in potential to eventually plunge the Dow down to 6400 again in just a few months time. The FED may announce another easing program, but since the effects of QEII has already been mostly wiped-out, any new easing may only produce a lower-high as a right shoulder. I think we have arrived at 'Peak-Government' and 'Peak-FED' their ability to affect change in the markets appears to be diminishing.

Now that we have a rough target in price and rough pattern to follow, how about timing. Perhaps a Fibonacci measurement of time will present a clue:


The golden ratio set of numbers in the monthly time frame suggests that roughly march 2015 is a possible target for a low.

Gold continues to push higher in response to the Dow's collapse. These movements are all part of a long journey for the Dow to once again reach parity with the price of Gold, a ratio of 1:1. I currently suspect the meeting will likely take place some time between 2015 and 2016 at roughly $2000 to $3000 an ounce gold.


The Dow:Gold ratio also reached parity back at the gold top in 1980. At that time, a market driven gold market was RISING in an attempt to accurately valuate the Dow in real money. But now in this current cycle, I think the Dow will be FALLING significantly to find it's true value in real money - Gold.


...

Tuesday, August 16, 2011

MMM - Afternoon update 8/16/11

Hey All,

I've been very busy lately with 'real life' so please pardon the absence. I'll tell you right now that I will not be around for coffee tomorrow either unfortunately.

I do however have a few minutes this afternoon to cover some markets.

Gold - Broke key resistance zone at 1780-1785 today, but so far the action has been quite tepid. PoG continues to lean on a supporting trend-line this hour with a lazy move up. I still think that gold is in a corrective mode, with the current wave up from 1723 being a 'B' wave of the continuing correction. Any significant moves down into the remainder of the week should be considered a final leg of the correction as wave 'C'. The daily fibo turn window opens tomorrow afternoon after the daily close and extends into the afternoon daily close on the 22nd. Any further selling into this time frame as a final wave 'C' of this correction should present a good buying opportunity. Further upside from this point in time exceeding 1818 (on a daily closing basis) into the fibo turn window would complicate the matter, possibly suggesting an early break-out toward wave 3 black (2150 to 2225).

Silver - So far the upside is not exhibiting the impulsive behavior often found with a bullish iHnS neckline break. Same as gold, I'm seeing a lazy advance higher leaning against a key supporting trend-line. The action today has produced a small triangle which may suggest a small thrust higher in the next few hours could be a terminus for the current ST uptrend. The daily closed above the 20DMA, but the 10EMA is still under it, so the 3/10/20 picture is still neutral at the moment.

SPX- touched the lower part of the resistance zone that I mentioned previously at 1200. 1180 looks like ST support at this time. This dead cat bounce looks almost cooked. I would eye any gaps higher tomorrow as possible selling opportunities. The downside target zone is about 1000 to 1050. There are a couple bearish EW counts that could play out, the one that I favor sees another panic drop to 1000 to 1050 as the completion of a 5th wave down and the right neck of a very bearish HnS pattern. The right shoulder (DCB II) may arise from later this month, perhaps after Jackson Hole. The right shoulder may move into October to December time frame on another injection of re-flation by the FED. we'll see. Again I restate, with any QEIII or the like that may be announced, I think the markets will react with pouring into tangibles as stocks receive the runt's share. Bond's would likely suffer some as well in such an environment.

USD/JPY - looks to be near the end of a bearish triangle pattern on the daily, clear as a bell. This too would suggest that the next 5 wave impulse down could be terminal, and quickly reverse, look for potential reversal candles on the daily and weekly. Downside target zone is 76.00 to 76.30 for a possible triple bottom.

Wish I had more time to post charts, but it'll have to wait. Good Hunting all!


...


Monday, August 15, 2011

Gold Update - 8/15/11

Previously I suspected that Wave 1 black may end between 1711 and 1760, however those targets were trampled in a bullish rampage! moving to 1814 and the tail end of a turn date window. Wave 1 black now looks complete, with a full EW count up from the 1478 low.


With wave 1 black looking complete, I am anticipating the completion of a wave 2 black near a large cluster of support just below at 1640ish to 1688ish. After which wave 3 black should erupt into September toward a potential target area of 2150 to 2225. Any moves below 1639, would likely put the larger trend in jeopardy and any move below 1478 would kill my bullish counts in favor of very bearish ones.

With wave 1 black having climbed to 1814 for a total of 336pts, the Long Term (LT) count needs a revision to the upside:


Wave 3 black now has a potential target range of 2150 to 2225. A lower target of 1980 could be calculated, but if this is the big blow-off top that I suspect it is, 1980 is much too conservative.

There are many counts and many technical reasons for many projections by many prognosticators. I certainly do not corner the market on analysis. However, based on my interpretations of Elliot Wave and cycles, this current run appears to be a final blow-off top. If my interpretation is correct, this means that what ever price territory is conquered to the upside is likely to be quickly unwound after the top is in place. Price may fall back to 1478 to 1600 very quickly, then see a dead-cat-bounce, then another fall, possibly sub-1300.

JMVHO, DYODD


...

Sunday, August 14, 2011

'Sweet September' - A Look at the Gold Bull Market Monthly Performance

The numbers are finally crunched and packaged ever so nicely:

(click on chart for full view)

The individual monthly performance data shown is calculated using the monthly open and close of each month listed. Intra-month extremes are not considered. Data starts from the beginning of the Gold Bull Market in August 1999.

After reviewing the statistical data, it's easy to see that September is the sweetest month for gold by far. If an investor had simply bought gold at the open and sold gold at the close of every September since the bull market bottom, they would have enjoyed an average monthly Return On Investment (ROI) of 5.17% average per year for a total ROI of 62.06%.

September is also the 'winningest' month, 10 out of 12 months were gainers.
Now it would appear that October is an ominous shadow on the other side of September with the 'losingest' record. However, if the High/low extremes were factored out, eliminating the one glaring eyesore of Oct. 2008, June would actually be the 'losingest' month.

September is also the kick-off month for Gold's most bullish period of the year, extending from the August low till a February top:


Unless the price of gold encounters some statistically improbable inversion against the seasonal trend, this would be the perfect time to witness parabolic advances into the first Quarter of 2012.


...

Friday, August 12, 2011

Morning Coffee with Quad G - 8/12/11

Gold - I see a stand alone impulse, 5 waves down from 1814. A stand alone impulse typically implies that another 5 waves down is needed to complete the minimum basic requirements for any EW pattern, whether a correction or new larger impulse down. One 5 waves series without an attachment to other structures is not allowed. I think a 3 wave move is near complete to the upside, and the second 5 wave impulse down should start soon, targeting a support zone between 1640 and 1682.

Silver - Looks like it's working on a ST bearish triangle pattern on the 2hr chart. I suspect that this is a B wave, with C wave down to follow either today or early next week, targeting 35-36. This bearish triangle pattern requires silver to stay below 39.80. If 39.80 is taken out, an iHnS that can also be observed may cause silver to propel higher to $42.50ish as an initial target. Silverrex has done a good job of depicting my thoughts and other possibilities here: https://www.kitcomm.com/showpost.php?p=1464351&postcount=15515

His chart:
(click on chart for full view)

The Red projection basically reflects the corrective count including the triangle I mentioned. Silver has a fairly broad turn date window for early next week, starting Sunday afternoon at open to Thursday afternoon close on the 18th. The trend is currently down into this fibo turn date window, this could become a very significant bottom.

USD - Still appears to be working on a bear flag while below 76.72, Moving sharply below 73.40 should indicate that a 3rd wave down has started.

Natgas - Wave C of (D) depicted here: http://majormarketmovements.blogspot.com/search/label/Natural%20Gas looks complete, now upward toward wave (E), target range 4.30 to 4.80. E waves of a triangle can often truncate, meaning that they will fall short of hitting the upper triangle boundary before starting the break of the triangle, in this case to the downside.

SPX - squarely into the suspected dead-cat bounce. A choppy move higher may be observed toward 1200+ into next week. If Gold is scheduled to turn significantly higher next week into September, the it's possible that stocks could start another major run down.

Good Hunting.


...

Thursday, August 11, 2011

Interpreting the GSR

The Gold/Silver Ratio is commonly misunderstood, so I will attempt to shed some light on this very important indicator.

The GSR tells of 4 typical scenarios that are possible, 2 for a rising GSR and 2 for a falling GSR:

A rising GSR is caused by gold performing relatively better than silver, wether both are in a down trend or uptrend. Typically an upward move in GSR is driven by deflation or threat of systemic financial upheaval, or mix of the two. In deflation gold and silver will move down in tandem, but typically silver falls faster that gold, thus the GSR increases. With systemic financial upheaval (defaults, downgrades, bank failures, ect.) Gold can increase substantially, as paper takes flight to quality, but silver can lag as growth concerns pop up. This scenario will also cause GSR to rise.

A falling GSR is caused by silver performing relatively better than gold, wether both are in an up trend or downtrend. Typically a downward move in GSR is driven by inflation or improving economic and financial conditions or mix of the two. In inflation silver and gold will move up in tandem, but typically silver rises faster than gold, thus the GSR decreases. With improving economic and financial conditions, gold may continue to fall as hedges are unwound, but industrial demands for silver may support the price of silver sooner, this condition would also cause GSR to fall.

There is a 5th scenario that can happen during an extreme increase in the price of gold. If gold moves to a point where it basically out prices itself, and physical gold becomes difficult to find, silver at that point will perform as 'poor man's gold' and will basically cause silver to chase after a dramatic upswing in gold price, as a massive rush to physical will drive up the relatively cheaper silver price. GSR can explode to the downside in such cases, as long standing historical ratios of 1:10 to 1:16 can be reached.


...

Morning Coffee with Quad G - 8/11/11

Mornin' all,

Gold - I mentioned a bullish triangle that formed as a possible wave (iv) on Tues evening at the Kitco thread, suggesting a pop was possible into a 5th wave up. In the morning I mentioned that 1800 was possible, Sure enough the EW structure met the expectation.

Here's a look:


The key to good triangle observation is to make sure a clear impulse is observed moving into the triangle, watch for the price range to contract forming the triangle (orange), then anticipate another 5 wave structure to the upside. Knowing this was going to be a 5th wave advance from the end of the triangle, a potential expanding wedge (blue) was a possibility. An expanding wedge is a choppy 5 wave structure made of 5 sets of 3 waves. Upon completion of the 5th wave, a 5 wave impulse was then possible to the downside. The current fall from yesterday's high could be counted as a Leading Diagonal (LD). I would not advise trading solely on EW counting, but when a text book triangle is observed, chances are usually very good. Also note that when a triangle is a 4th wave, the 5th wave up is usually the last impulse to the upside from which price will often fall back down toward the center of the triangle at a minimum, and we see that now with price currently back at 1753. All very predictable movements even in volatile extremes.
Gold might be able to fall back to a support zone between 1640 and 1682, but must first get past the 10EMA which is currently at 1706 and climbing.


Soybeans - I've mentioned a few times about Soybean's multi-month bull flag. That flag has now entered a cluster of support:

(click on chart for full view)

Beans have found their way down to support at the lower green channel line, The lower bull flag channel line (orange) and the 38.2% fibo retrace price of 1260ish.

There is also a seasonal low very close:


If Soybeans do see a rally above the bull flag approx 1400, I think a thrust is very likely to the upside (red projection) and could easily challenge the 2008 high above 1600.
Failure of support at 1260ish could open a trap door down to 1000 (blue projection).

SPX - Looks like it's still working on a dead cat bounce, Price could come up to back test the break-down in a zone between 1200 and 1260, very possible before the end of the month. Then another very long and deep plunge possibly dwarfing the latest major sell-off. Again I think SPX could be headed sub-400 from this point forward. Any move back above 1300 would likely kill this scenario. The 50DMA moved below the 200DMA, a major sell signal commonly referred to as the 'death cross'.


Good Hunting!


...


Wednesday, August 10, 2011

Morning Coffee with Quad G - 8/10/11

Mornin' all,

Gold - A ST bull triangle has formed on the hour chart, this could be a 4th wave with a 5th wave thrust to come to the upside. Very likely the thrust will be a psycho test of the 1800 level. A pattern I have noticed with gold when producing new highs is it's reaction to the price territory 1% below a centennial level. Ususually when PoG violates this zone, it proves that gold is not afraid of that level. It may pull-back out of that level, but it's generally a buying opportunity, because it is very rare for gold to come with in 1% of a centennial top and not exceed it eventually, no matter how far a pull-back. No major tops have formed in the 'psycho test zone'. Also, a full moon is also coming up this Saturday, I give the shadow of the moon cycles +/- 1 trading day.

SPX - I think we saw a bounce yesterday basically of the 38.2% fibo level around 1100. A small positive divergence can also be seen on the hourly oscillators, MACD and RSI. This could start an anticipated Dead Cat Bounce (DCB), but price must stay above 1100. I suspect that a dead cat bounce would move to at least the 10 EMA, and possibly higher over time to 1240 to 1260ish as a back-test of the break down area. You'll notice on my calendar below, the bradley turn date for July 29th and 30th, seems to have nailed this major break-down. Next major bradley turn date is December 28th 2011.

Corn, Wheat and Soybeans - The grains all held up very well under the recent stock market sell-off a sign of strength IMHO. Wheat's correction expanded a bit, but has put in a reversal candle, looks bullish while above 645. Corn has bounced off a previously strong lateral support at 660, looking bullish while above 660. Soybeans still inside it's massive bull-flag, moving above 1400 could produce a massive break-out in price.

Crude - Slid much further than I would have anticipated, it fell down to the 50% level and squarely in the middle of a long term support zone between 73.00 and 80. The daily candle pattern yesterday posted a bullish hammer. However, be careful, this market has a 3/10/20 bearish cross-over, but a daily close above the 10EMA (currently 87.42 and falling fast) would signal a potential bullish recovery.

Good Hunting.......


...

Silver - Update 8/10/11

Silver has finished a 5 wave impulsive series and is now into a correction phase. The 3/10/20 ribbon bears witness:


The bearish cross-over certainly ended the previous impulsive trend stepping into a correction. If PoS continues to operate below the 20DMA on a daily closing basis, the trend will still remain to the downside. I would advise caution with buys while the 3/10/20 is in this configuration.

There is a possible Fibo turn date coming up on the daily chart:


The trading day that starts on the 15th, +/- 1 day covers a window of time from Sunday's open on the 14th to the afternoon close on Wednesday the 17th. If the current downward trend continues into that turn date window then I would anticipate a turn to the upside (red projection). But the opposite is also true, if PoS moves higher into that date, then a top is possible. A turn date only suggests a possible turn of the trend that arrives into it.

Here is a current EW perspective:


I currently suspect that Silver's correction is nothing but a Back-Test (BT) of the previous broken trend-line (green). If so, further selling may bring silver down into the Aug 15th turn window, which may end a wave {ii} blue sharp correction. Based on the size of wave {i}, a wave {iii}blue should have little trouble moving p to 51.13 or better as an initial target.

If Silver breaks the dashed red trend-line, the larger bull-trend is in jeopardy and a slide down to sub-30 is very possible.


...


Monday, August 8, 2011

Gold Update - 8/8/11


Mornin' all,

Gold:
Since 1660 was taken out, Gold continues to bend the parabolic envelope steeper. IMHO, this market is preparing to go vertical soon in a final manic buying spree.

Here is an older chart depicting the concept of building a parabola:


Here is an update on how the parabolic move is progressing:


Today is August 8th and a potential fibo turn-date window here, centered on August 9th (+/- 1 day). Netdania shows it's dates in the measuring tool as the beginning date, which actually starts in the afternoon of the previous day, pardon the confusion. Chart:


You'll notice that every point except one has marked a turn, some bigger than others. A Fibonacci turn-date is not a certainty, but adds to the probability.

Here is the MT count for Gold that I am currently working off of:


Update:


The current 3/10/20 ribbon and ST EW count:


I would not be surprised to see PoG come back to fill the gap at least partially, test the 10EMA again, and then gap higher into a small wave (v) green toward 1742 to 1760ish to finish wave 1 black. But the 10 EMA must hold on a daily closing basis.


...


Sunday, August 7, 2011

The Impact of the Credit Rating Downgrade

The news that has been warned about for years has finally come to reality. The incessant threats made by Moody's and now S&P have now become promise. The USA left the small cadre of countries that hold a AAA rating, knocked down a notch to AA+. They now will be rubbing elbows with Belgium that already has a similar rating. Not so bad, perhaps we will learn how to make really good waffles and Chocolates, clogs are also becoming very fashionable here in the states already.

I'm sure the question that most traders are curious about is: 'what will happen next week?'

My answer is not simple nor complete, for many factors direct market action, however here is a list of factors to consider:

1)Investment firms and insurance companies - Many fixed income investment vehicles and insurance company savings have a policy to keep a significant portion of invested capitol tied to AAA instruments in AAA rated countries. The kind of rock solid, Steady Eddie investments that are usually about as exciting to watch as drying paint, growing grass and bread slices in a toaster. However, with the USA now downgraded below AAA, this will likely cause these firms to formally move out of USA sovereign debt (US treasuries, particularly the 30 year long bond) and give a greater share to those countries that take their budget and debt seriously, like Australia, Austria, Canada, Denmark and other found here: S&P sovereign ratings list
These firms would need to sell their US treasuries, which means moving to cash (USD) for a time before converting to a foreign currency to buy the Bonds of foreign nations. Yep, gonna 'out-source' your nest eggs. In this process buying pressure would be applied to USD for a time as treasuries are converted to cash, followed by selling pressure as that USD converts to foreign currencies in order to buy foreign AAA rated sovereign debt. Many firms have already moved large sums in anticipation, but Friday's downgrade will seal the deal. Unfortunately Gold is not considered a AAA rated investment, so don't expect gobs of money to flow from these institutions into the metal markets. However, those countries that are net exporters of metals and other precious commodities (i.e. Australia, Canada and Norway for example) would likely benefit handsomely. The TC (Transfer and Convertibility) for the USA will still remain AAA, basically suggesting there is no threat of default or market interruption.

2)Sovereign wealth funds, foreign reserve banks - Most of these are likely ahead of the curve, having already diversified away from long term US debt and into commodities and other investments a bit more promising. Whatever portions are left will likely be sold over time and converted. Gold will likely receive a lion's share of the proceeds.

3)Risk-off traders - This could be the fly in the ointment for a time. As you have noticed, US Bonds and metals have been moving up together as a risk-off, safe haven trade away from a volatile stock market. If the 10, 20 and 30 year treasuries fall off sharply come early next week, leveraging on margin would be unwound, followed by margin calls ringing off the hook. Those traders with Gold and Silver holdings will likely be forced to sell their metal positions to cover margin on their losing long side bond bets.

4)The FED - If you look at the trading calendar at the bottom of the blog, you'll notice that August 9th (Tues) is a FOMC meeting. Pressure will be on the FED to 'do something'. If the bond market plummets and yields reverse strongly, the FED may be justified in announcing a federal funds rate increase in an effort to stem a rapidly receding bond market tide. Such a move would be an attempt to shore up the Dollar and thus shore up the US Bond market. Metals would likely have a knee-jerk reaction to the downside, but I suspect only temporarily. However, if the FED Comes out swinging with a hugely unexpected rate increase of over 1%, metals could dive significantly. The FED is in a pickle - Do they continue to ease in order to foster growth and employment, also putting a floor under equities (QE3)? OR do they protect the country's 'credit score'? AT this point, I think the FED has exhausted it's ability to affect change. Trillions in easing, trillions spent.......employment about the same, stock markets still at a lower-high. I imaging that the bulk of any QE3 attempt would march right into tangibles (metals, energy, food).

5)Buy the Rumor, sell the fact - This event has been anticipated for months, it's very possible that the market has already priced it in.

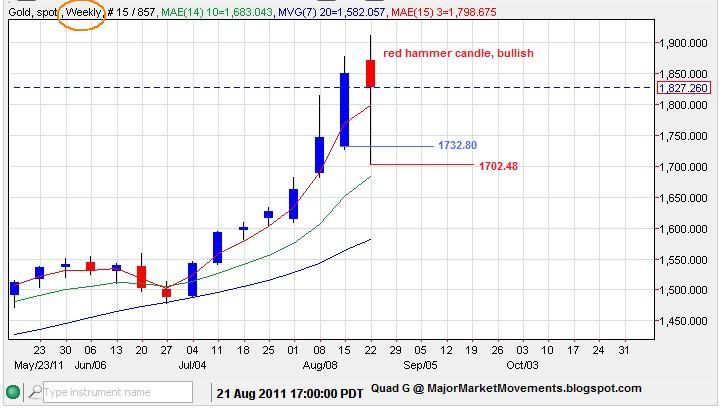
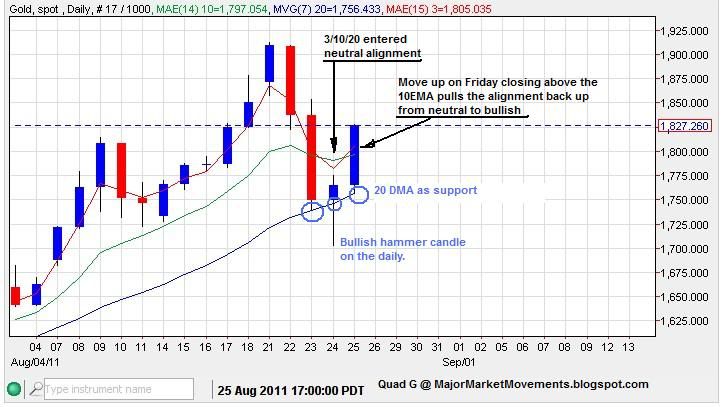
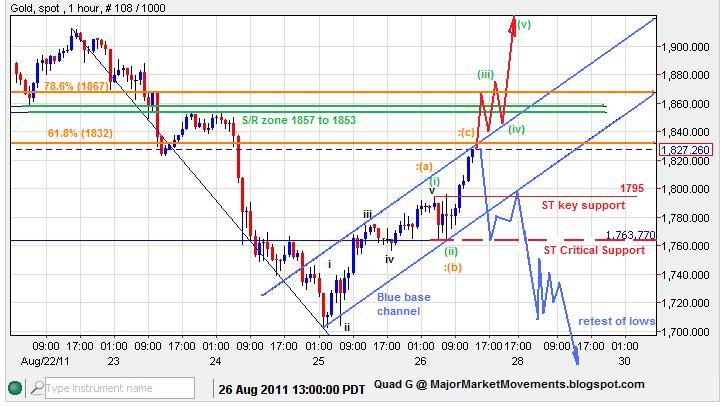
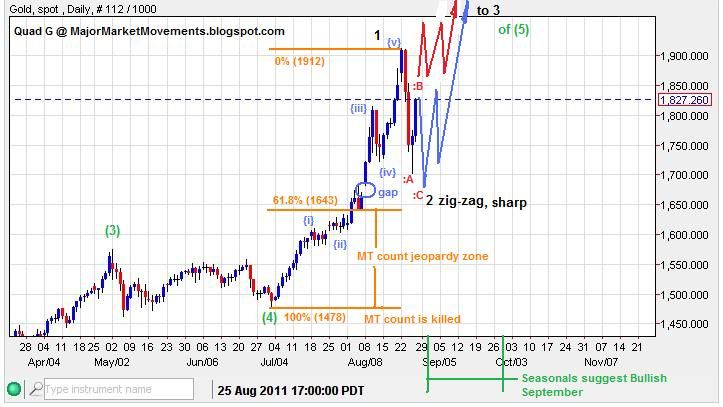
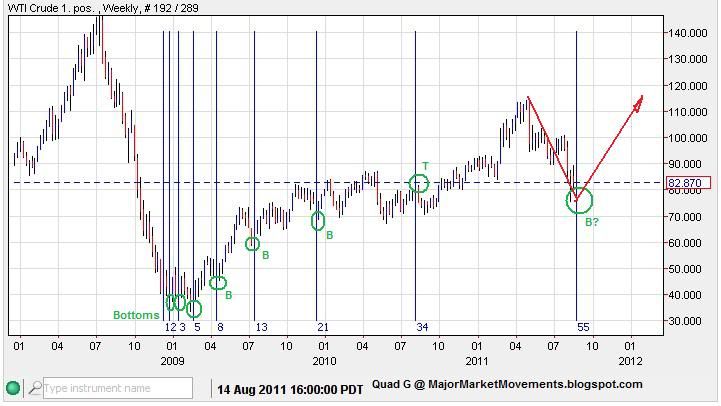
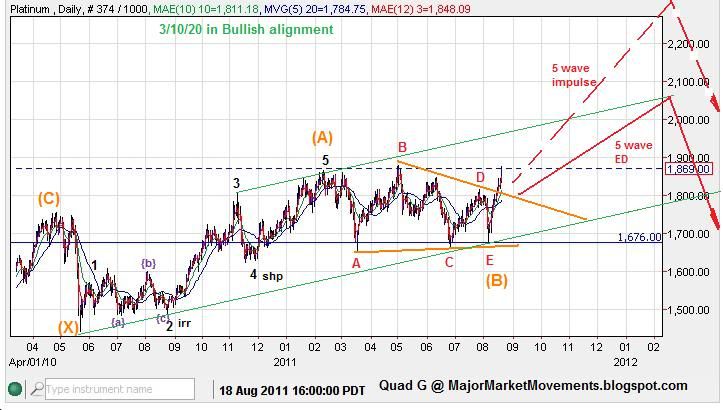
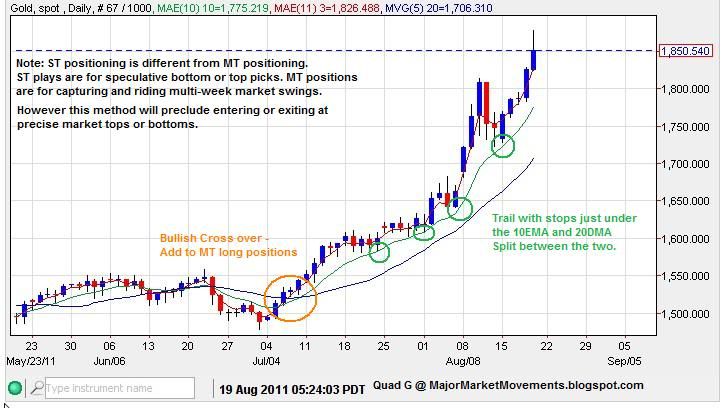
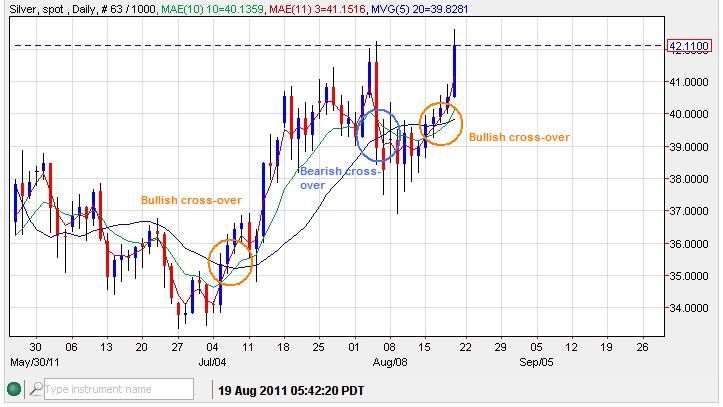
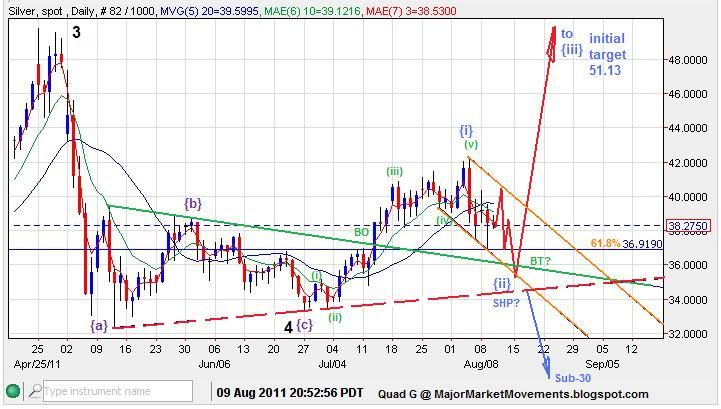
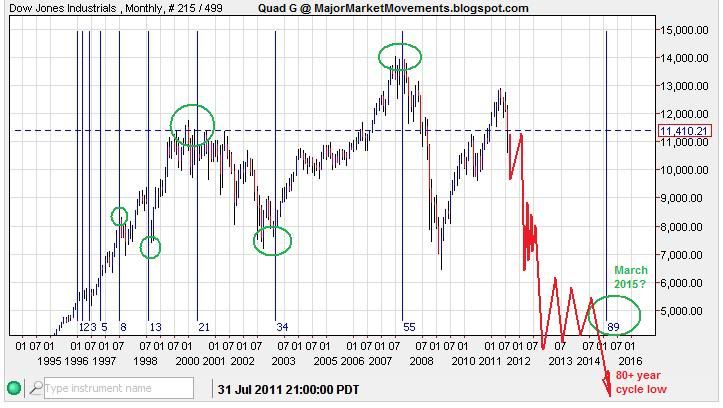
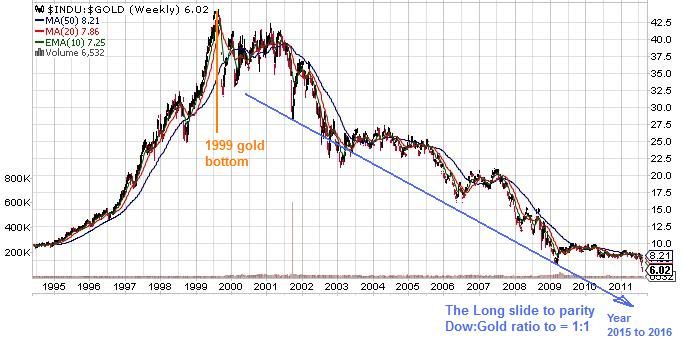
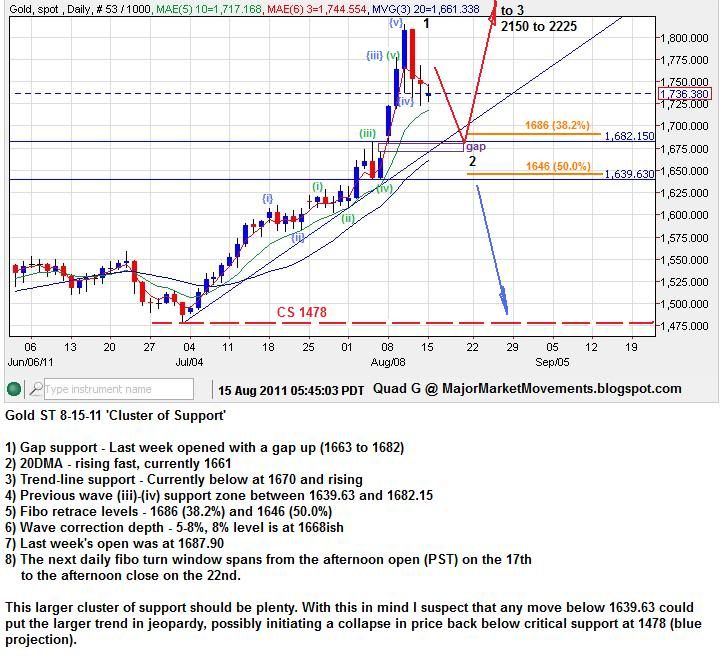
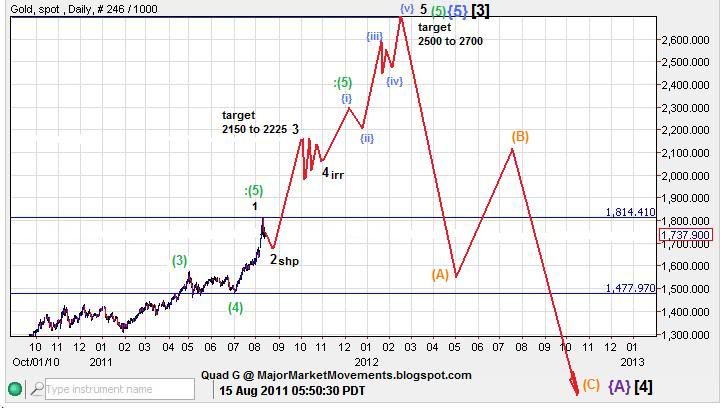
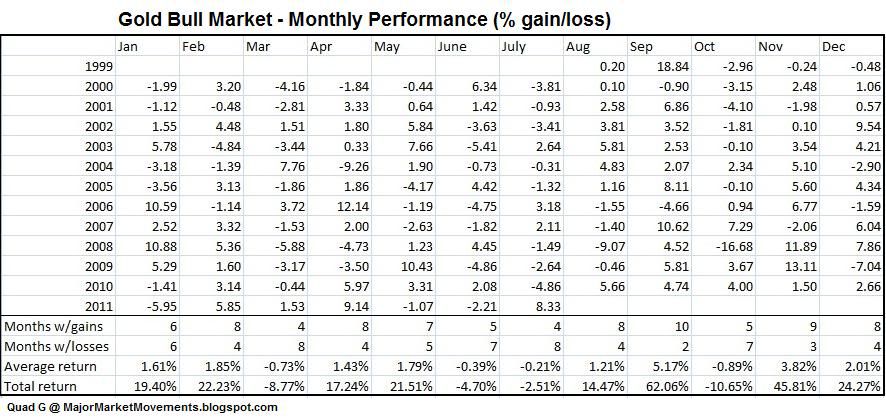
The markets are moving into a chaotic period this month, the clear winners will arrive through the August dust cloud into September onward. I fully expect that Gold will be on top, what ever August flings at it.

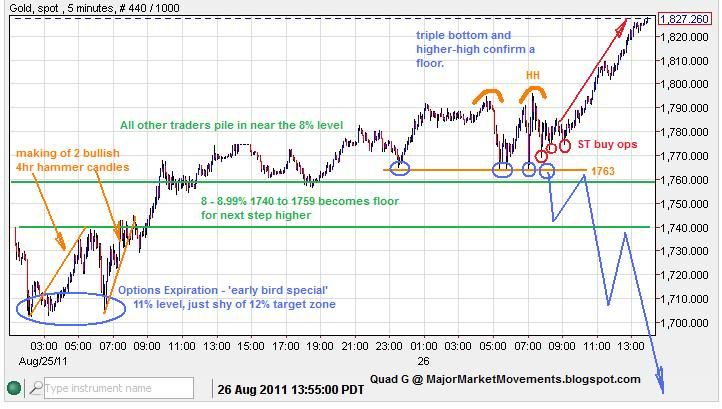
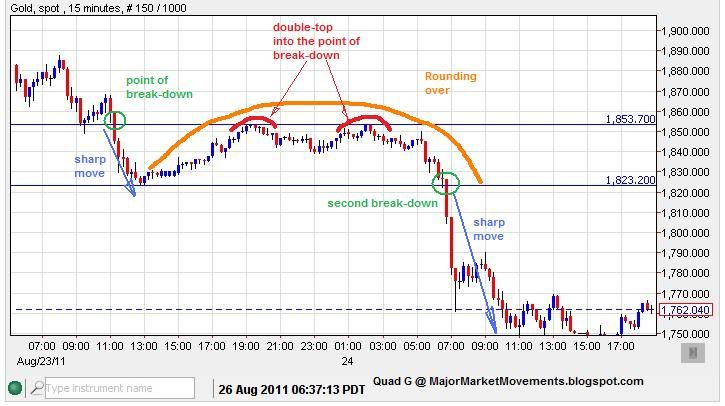
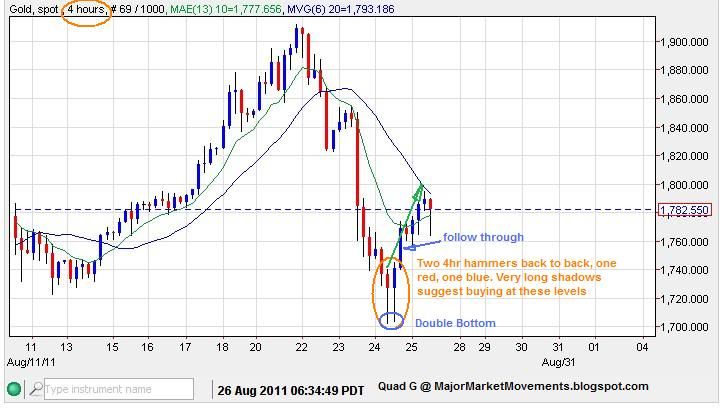
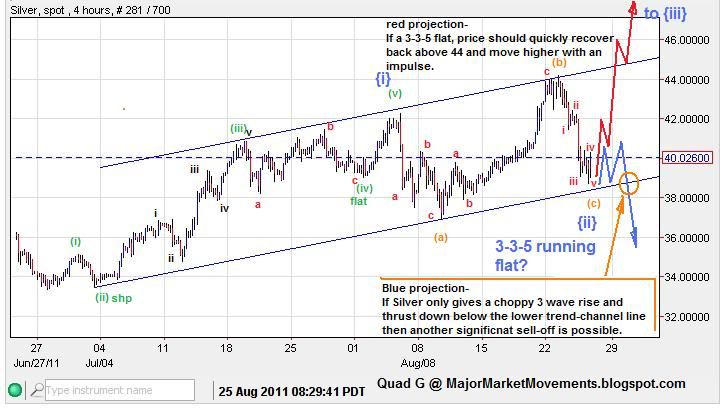
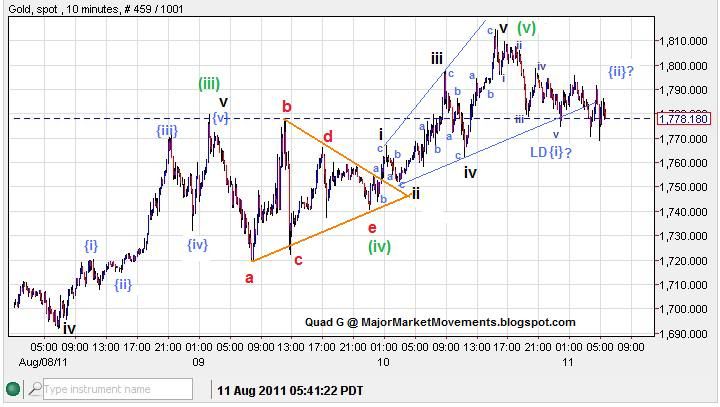
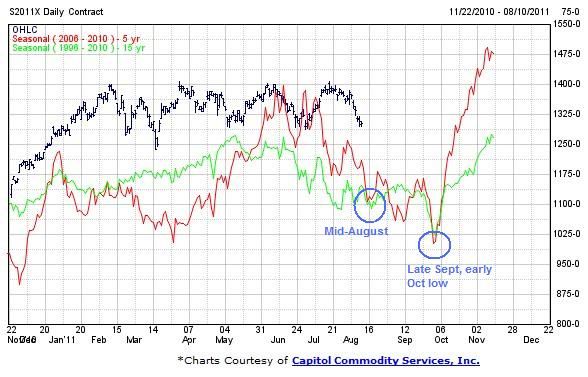
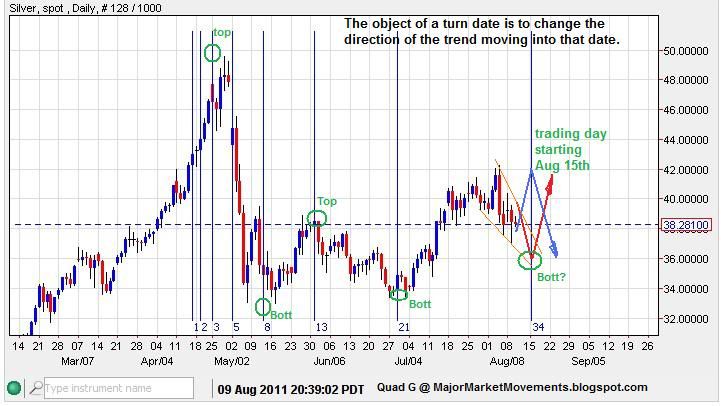
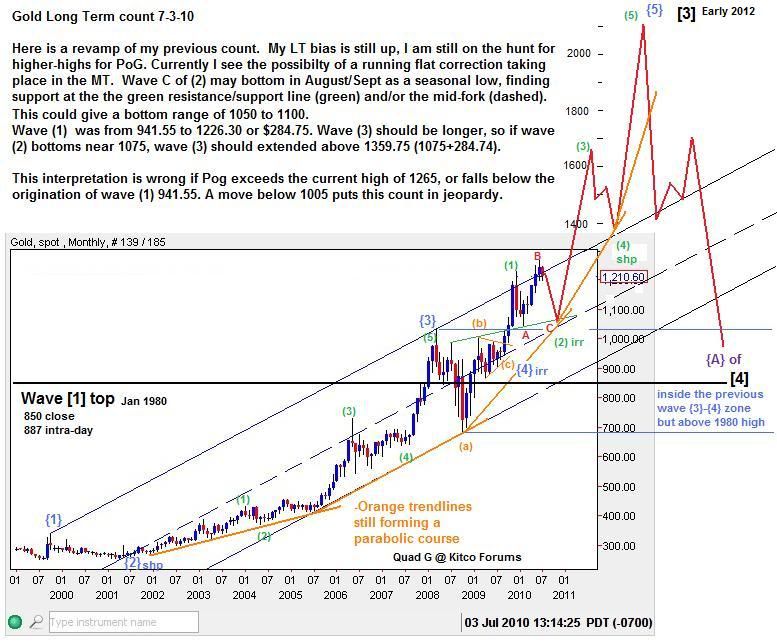
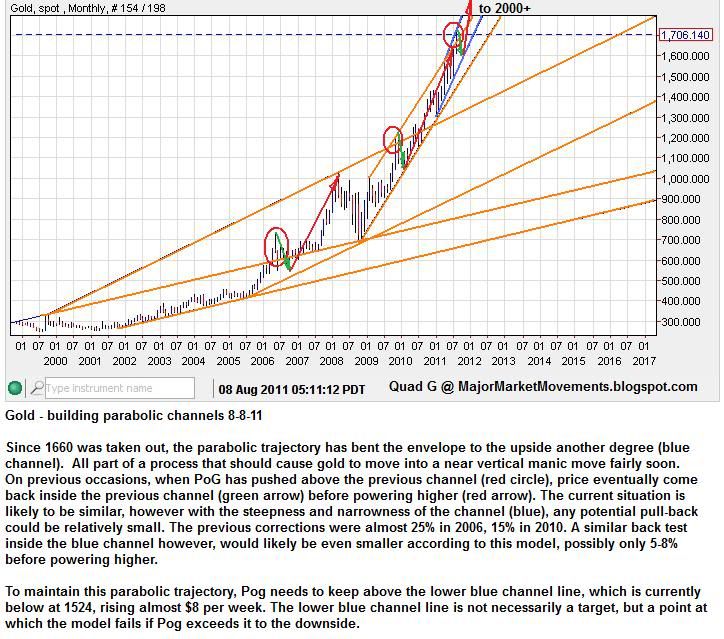
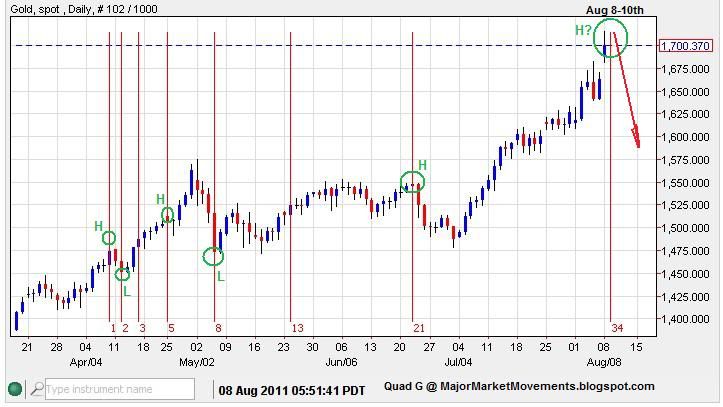
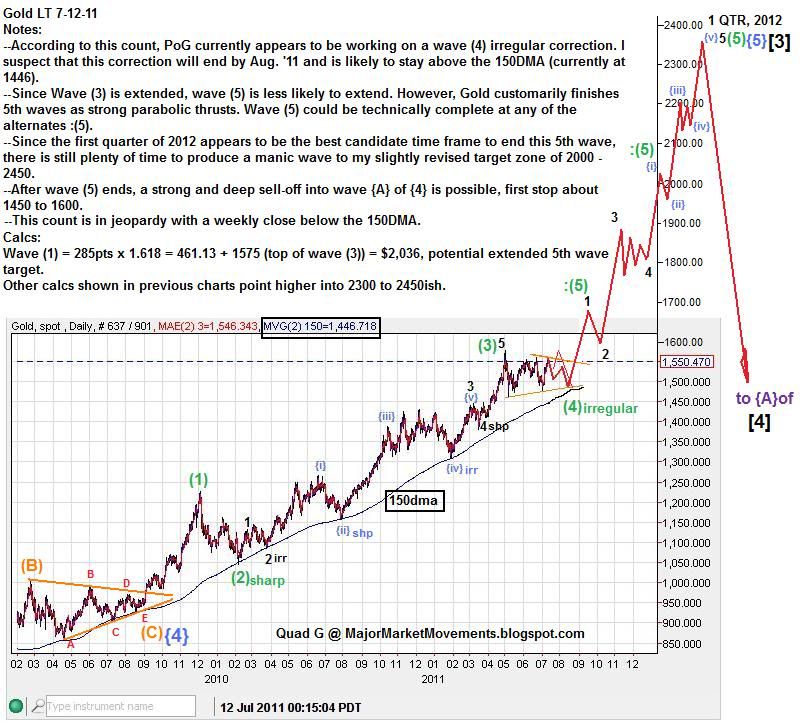
Here are a few charts to give some perspective:


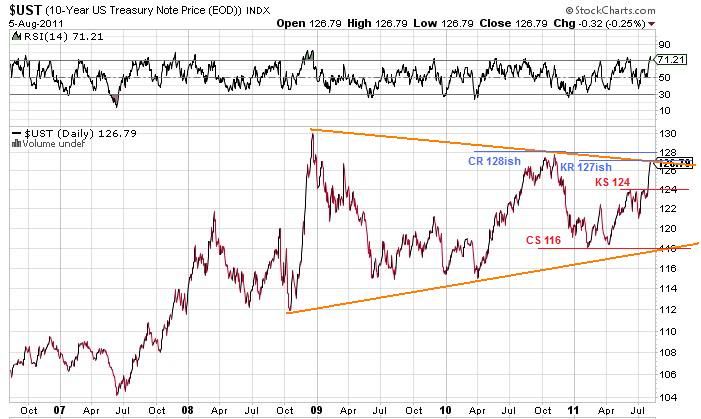
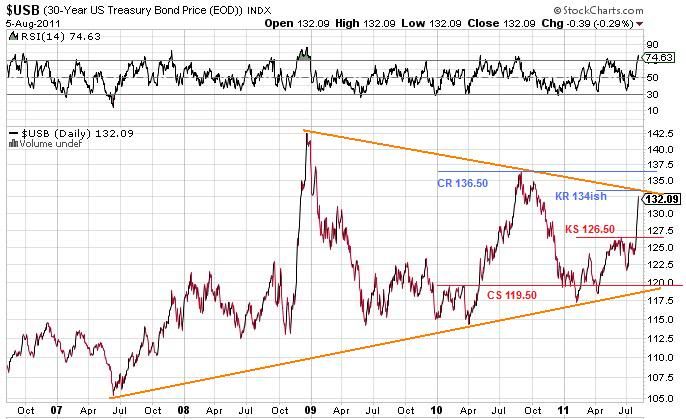
The 10 year and 30 year price have come up recently to test major trend-line resistance. Further upside above Key and Critical resistance would suggest a major break-out. However a rejection here and falling through support would likely spark a major slide. The pattern is neutral as consolidation narrows, but a break-out either way is likely to be violent.


The 10 year yield has also fallen to test a multi-year trend-line.


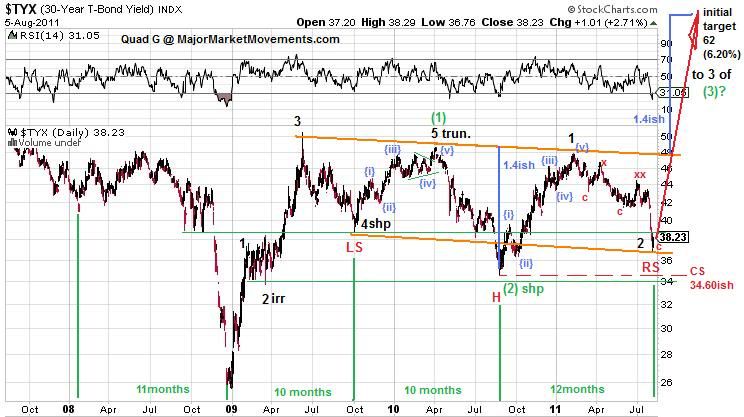
The 30 year yield gives us a workable EW count and bullish iHnS pattern. A fairly consistent 10 to 12 month pattern of cycle lows can also be observed, overdue in this last cycle.


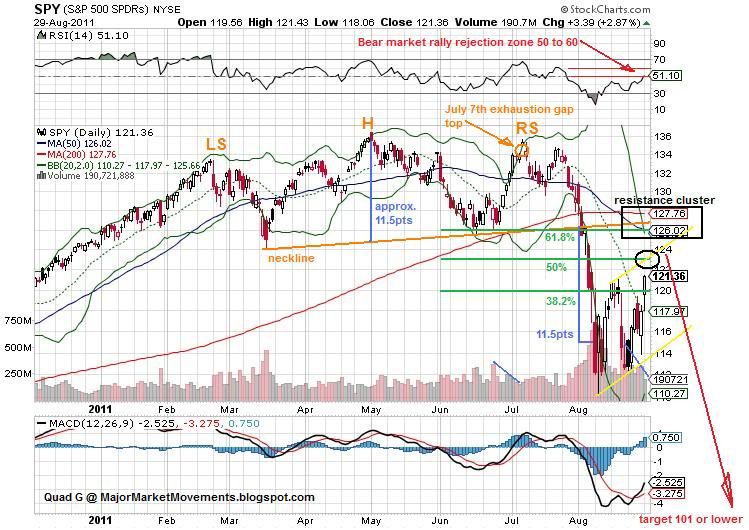
Great risk is to the downside, a failure of support at the lower-orange channel-line (below at about 119) would invite a significant selling as another bottom is searched for,potentially $80 to $90 initially.

In A Nut Shell: If the bond market (price) reverses it's present course, the downside potential is very large. Yields could climb to 6.20% initially on the the 30 year, and double digits eventually.


...