Gold - I mentioned a bullish triangle that formed as a possible wave (iv) on Tues evening at the Kitco thread, suggesting a pop was possible into a 5th wave up. In the morning I mentioned that 1800 was possible, Sure enough the EW structure met the expectation.
Here's a look:
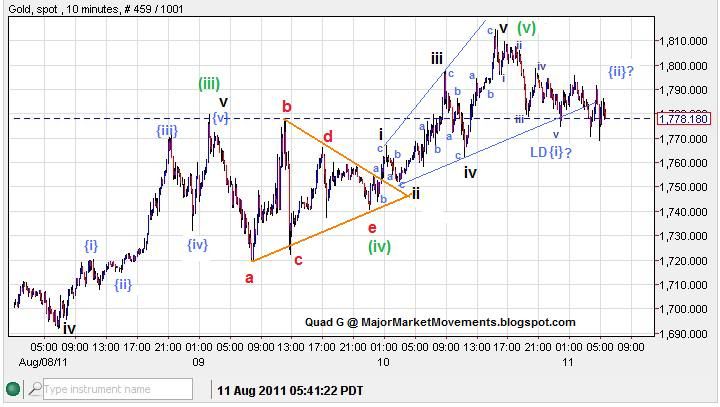
The key to good triangle observation is to make sure a clear impulse is observed moving into the triangle, watch for the price range to contract forming the triangle (orange), then anticipate another 5 wave structure to the upside. Knowing this was going to be a 5th wave advance from the end of the triangle, a potential expanding wedge (blue) was a possibility. An expanding wedge is a choppy 5 wave structure made of 5 sets of 3 waves. Upon completion of the 5th wave, a 5 wave impulse was then possible to the downside. The current fall from yesterday's high could be counted as a Leading Diagonal (LD). I would not advise trading solely on EW counting, but when a text book triangle is observed, chances are usually very good. Also note that when a triangle is a 4th wave, the 5th wave up is usually the last impulse to the upside from which price will often fall back down toward the center of the triangle at a minimum, and we see that now with price currently back at 1753. All very predictable movements even in volatile extremes.
Gold might be able to fall back to a support zone between 1640 and 1682, but must first get past the 10EMA which is currently at 1706 and climbing.
Soybeans - I've mentioned a few times about Soybean's multi-month bull flag. That flag has now entered a cluster of support:
(click on chart for full view)
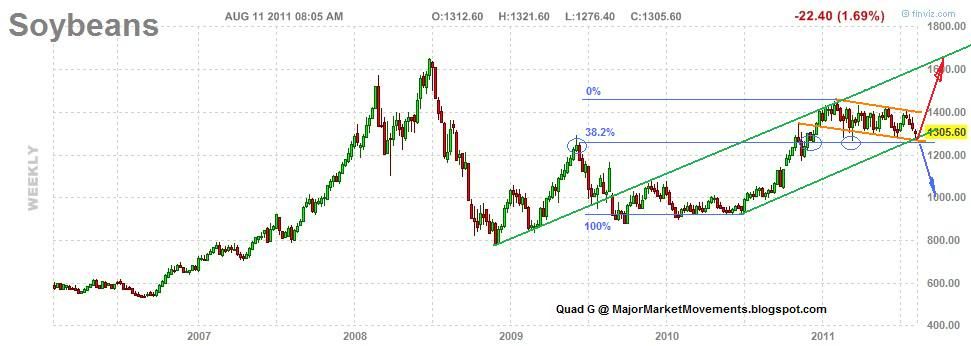
Beans have found their way down to support at the lower green channel line, The lower bull flag channel line (orange) and the 38.2% fibo retrace price of 1260ish.
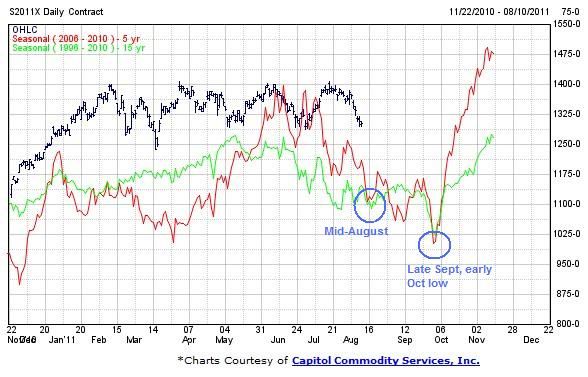
There is also a seasonal low very close:
If Soybeans do see a rally above the bull flag approx 1400, I think a thrust is very likely to the upside (red projection) and could easily challenge the 2008 high above 1600.
Failure of support at 1260ish could open a trap door down to 1000 (blue projection).
SPX - Looks like it's still working on a dead cat bounce, Price could come up to back test the break-down in a zone between 1200 and 1260, very possible before the end of the month. Then another very long and deep plunge possibly dwarfing the latest major sell-off. Again I think SPX could be headed sub-400 from this point forward. Any move back above 1300 would likely kill this scenario. The 50DMA moved below the 200DMA, a major sell signal commonly referred to as the 'death cross'.
Good Hunting!
...