Here is the chart:

The neckline is a common trend-line drawn between the low points of a HnS between the shoulders and the head. This is the 'trigger' point upon which the HnS projection plays it's hand.
Here is an update of that neck-line break and it's result using SPY:
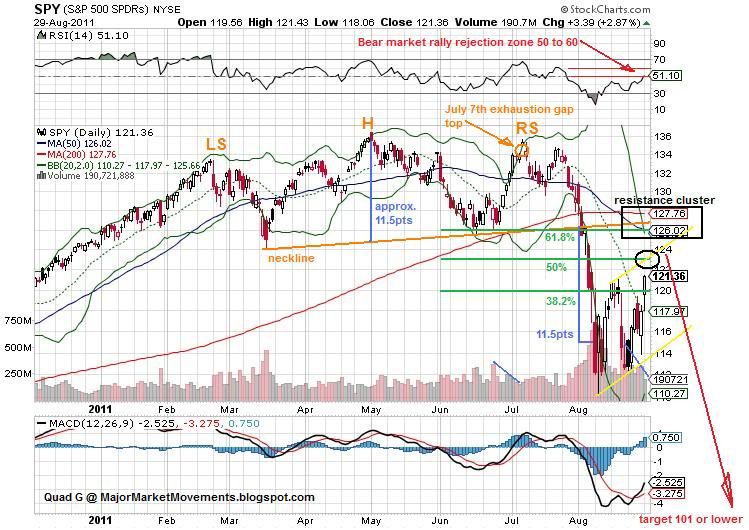
To measure a HnS projection a measure is taken from the neck-line to the head of the pattern. Then at the point where price moves below the neckline the measure is applied. In the case above, the fall from the Head to neckline was about 11.5pts, this measure is then applied to the underside of the neckline to gage a target price. As you can see in the chart above the price met and exceeded that projected target. A HnS measure like this gives an initial target and does not always mark a bottom. The same rules for applying the HnS measure and projection apply to inverse Head and Shoulder patterns also (iHnS) which is the mirror opposite Bullish pattern.
Now that the HnS pattern has played out, I suspect that a 3 wave Dead-Cat-Bounce is about to be completed. The last leg up right now should start to enter resistance while above 121. The volume on the upside should continue to dwindle as volume on the downside increases. Also watch the 50 to 60 level on the RSI (14) daily, it is often a zone of resistance in a strong bear market. Bears will want to see price stay inside the base channel (yellow) as it proceeds higher to meet various resistance levels indicated. I suspect a top is possible this week or early next. When price falls back below 114 it should confirm the conclusion of the DCB and proceed to fall to lower-lows. A SPY price of 101 or lower looks very possible, producing a 17% or larger drop from 122ish.
The leveraged ETF - SPXU and it's cousins are excellent ways to take advantage of sharp ST drops in the stock market. However, it's best to gage entry and exit points for SPXU based on non-leveraged price action such as SPY, or indicies SPX (S&P500) or the Dow Industrials. From the July 7th top SPY fell approx 19% in just over 20 trading days. At the same time the 3x leveraged inverse ETF - SPXU gained just above 70%. This is not a recommendation to buy or sell any ETF or other equities, for informational purposes only.
Join the MMM Weekly Round Table Discussion here: http://majormarketmovements.blogspot.com/2011/08/mmm-weekly-round-table-discussion-82911.html
Good Hunting.
...