Dow - The EU mess is still the lead item that the market's are set to react to. So far the stock market appears to be buying the rumor of a EU fix, while climbing a wall of worry. Perhaps at some point they will sell the 'news'. The Eurozone 'leaders' have done a masterful job of keeping hope alive from one week to the next with pure jawboning.
The Dow technical picture in the MT is decisively bullish while above 11,391. Multiple measurements, trend lines and moving averages provide a net of all kinds of resistances from 11,860 to 12,350, with a semi-tight cluster spanning 11,930 to 12,070. Friday last week gave a solid break out on the daily and weekly chart. Barring a major reversal early this week back below 11,391, the Dow is likely to move higher challenging the resistance zone between 11,860 to 12,350, all part of an attempted back test of the previous HnS neckline (currently above at 12,262).
The end of this week ends the month of October, looking at the monthly chart a very bullish outside key reversal could be in the making if Friday this week closes the month above 11,613. Such a strong monthly candle would be a buy signal for many investors, likely spurring further buying into November and December.
Also interesting to note: the COT data on the E-mini S&P 500 futures (the most traded of stock market futures) is showing an even greater short side interest by large traders, at levels not seen since just a few weeks before the Oct 2007 top.
Gold - A weekly close below 1643 would be bearish, a weekly close at or above 1680 would be bullish. Some lateral resistance at 1655 to 1665. A move above 1702 would allow PoG to move up to 1770ish or better. 1595 appears to be set up as critical support in the short term, a break of which invites a move down to test 1440 to 1510.
Silver - Key ST resistance at 32.00 to 32.33. Key MT support still at 28.41. There is a bullish CnH formation present that could propel PoS to a calculated target of 37.55 if the rim line is breached at 32.70 this week. This bullish pattern will die if 28.41 is broken first and possibly produce a fall into the $25 range.
USD - Looks bearish under 77.20 for the ST. A cluster of support is present between 75.75 and 76.07. A break of that support would open a path back down to 74.00 and lower and could change the MT EW picture back to bearish, possibly very bearish.
...
Sunday, October 23, 2011
MMM Weekly Round Table Discussion 10/23/11 to 10/30/11
Again this week I'll be pulled in every direction with little time for analysis and charting. I feel like a 'jack of all trades, but master of none'. Sometimes I kid that it would be nice to have a clone to take care of some of my duties. Unfortunately my analysis and charting fall behind, compared to my other priorities it ranks low on the list. From what I can see, this situation will likely last into the rest of the year. I will pop in to post some observations when I am able.
All the best to you,
Quad G
...
All the best to you,
Quad G
...
Wednesday, October 19, 2011
Morning Coffee with Quad G - 10/19/11
I know it's not morning in the states right now, but it's morning somewhere!
Much to cover today. Some of these charts were prepped yesterday but didn't have the time to post.
Dow - Not much has changed so far. The tops that I called recently are still good and the mid-channel that I mentioned is still holding as resistance:
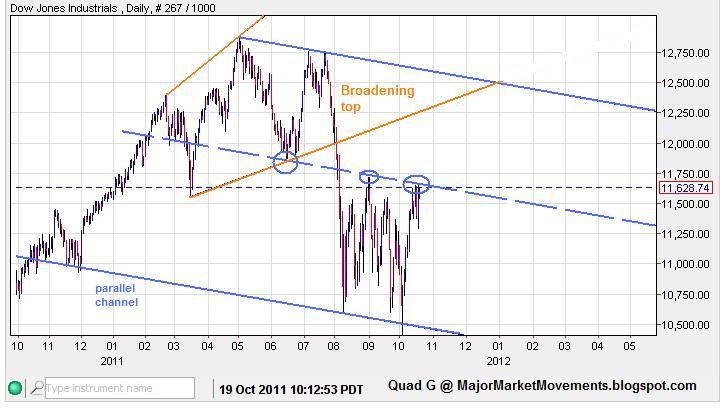
The blue dashed line is what I call a mid-fork. It's often a point of resistance or support inside a larger channel. We are certainly seeing that line providing resistance.
I recently called two tops in the Dow and explained briefly why. Here is a chart to better explain:
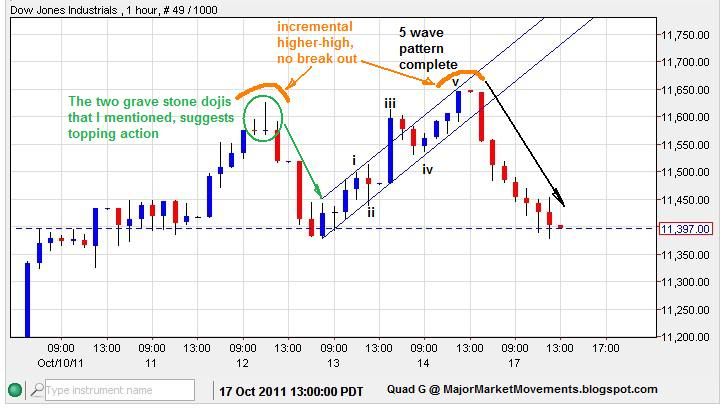
The back to back gravestone dojis is a good ST indicator of topping action. And then a 5 wave move up to an incremental high (no break-out) is also suggesting a top.
That 5 wave move was also back-testing the previous channel that was broken to the downside:
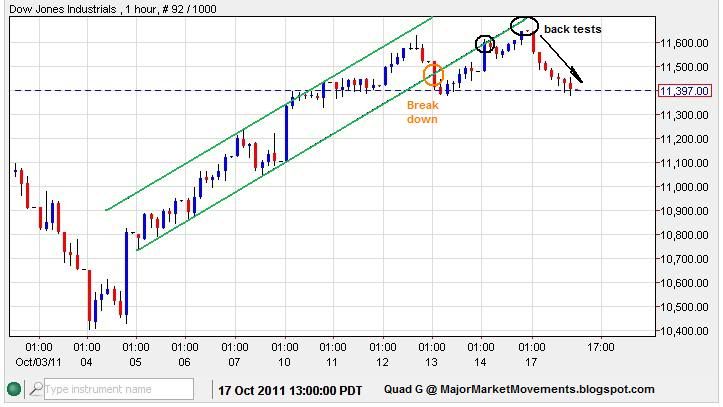
Then yesterday and today we see the Dow attempting a 3rd time to break resistance:
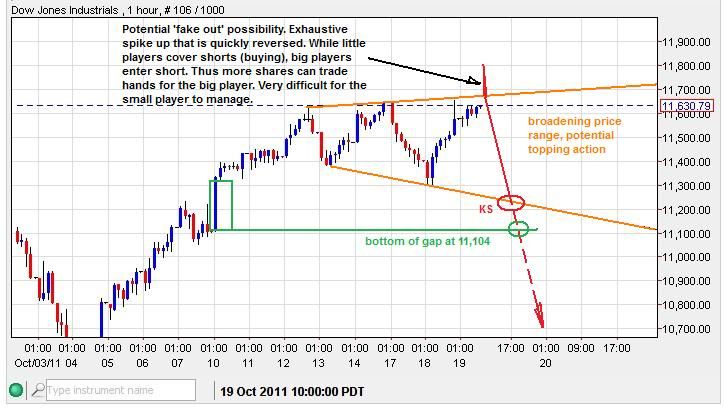
Be wary of a potential 'fake out' today or tomorrow. That probability will likely die with a move below 11,430. The gap at 11,140 and the lower orange trend-line may give some support. I didn't mark it on the chart, but if that support holds and a 4th attempt is made to the upside and breaks the higher orange trend-line, then the 'rule of 4' would suggest that such a move will likely break out strongly to the upside. However, a solid break of that lower orange trend line and 11,104 should keep the selling moving along strongly.
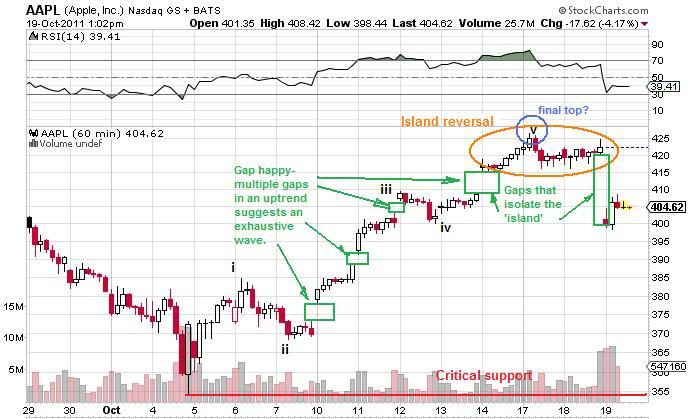
AAPL (Apple Inc.) I suggested that one may want to 'sell the news' on AAPL. Their numbers were strong but they still 'missed' guidance, investors are unforgiving. In the wake, AAPL has put in an 'Island Reversal' at the end of a 'gap happy' streak, often a very strong reversal pattern:
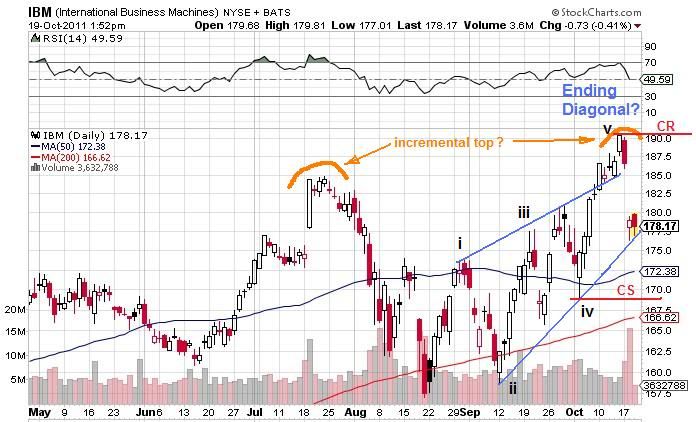
IBM also displaying some topping action:
Overall, the market is looking close to confirming another significant turn, Dow down impulsively another 100pts since I started this post.
Silver - Close to filling out a convincing triangle wave {iv} with a wave {v} down to come which is likely a final fifth:
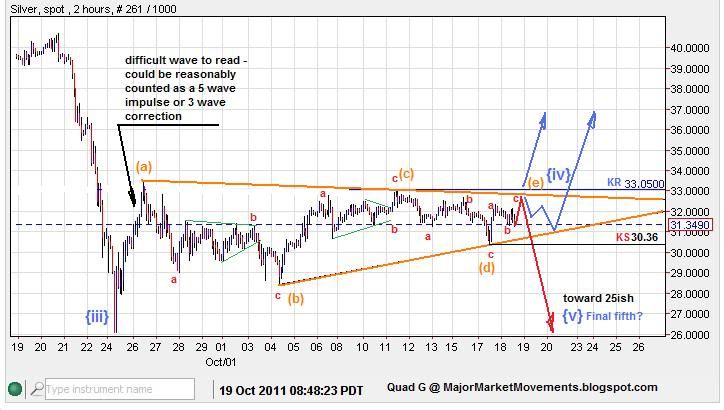
If this triangle is complete, then Key Support (KS) should be taken out soon, inviting a final thrust to the downside. The end of a final fifth would likely give an excellent buying opportunity, preferably $25ish. I think Gold will likely follow silver down and challenge 1500-1510, with an off chance at 1440ish. I would like to see the GSR (Gold/Silver ratio) not exceed 60ish. If Key resistance is exceeded (33.05), then the triangle denies the dowside potenial and allows for a move up to 36+.
Euro - And the USD, Displayed some good structure indicating a turn, Here is how it looked at the Euro end:
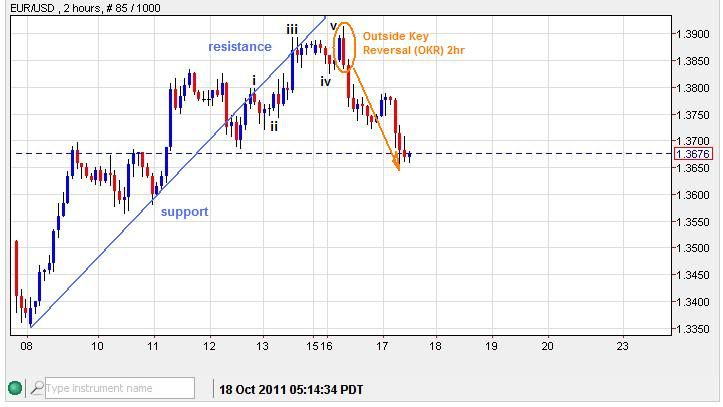
First clue was an (OKR) in the 2hr time frame at the end of a 5 wave structure on the back side of a trend-line that was once support but now resistance.......all coming together to suggest a top, at least ST, was likely.
Then the 4hr time frame added to the signal:

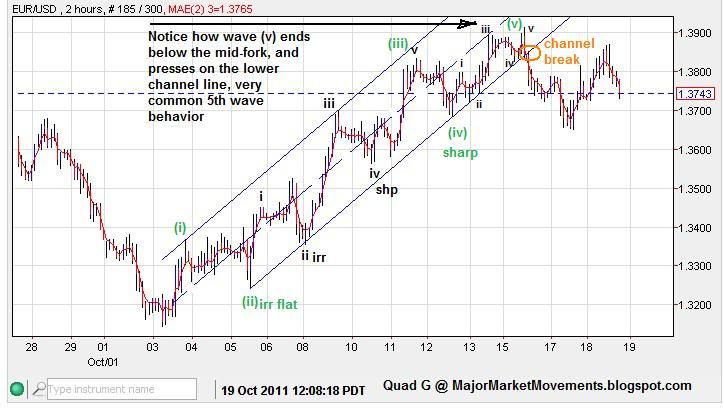
EW counting suggests a 5th wave is finished, a well formed 5 wave impulse, text book example:
The daily BBs were also provinding resistance:

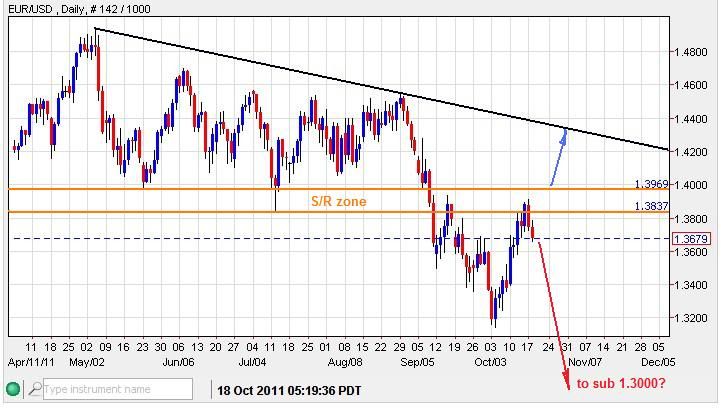
And the larger picture shows the move was inside the multi-month support/resistance zone:
Using mutiple tools at the same time can help hone in on market turns.
Key resistance for the Euro is now at 1.3914. The move down so far could be corrective or something more substantial, not sure yet, but the move looks somewhat choppy. A move below 1.3440 would likely lock in the current top at 1.3914.
...
Much to cover today. Some of these charts were prepped yesterday but didn't have the time to post.
Dow - Not much has changed so far. The tops that I called recently are still good and the mid-channel that I mentioned is still holding as resistance:
The blue dashed line is what I call a mid-fork. It's often a point of resistance or support inside a larger channel. We are certainly seeing that line providing resistance.
I recently called two tops in the Dow and explained briefly why. Here is a chart to better explain:
The back to back gravestone dojis is a good ST indicator of topping action. And then a 5 wave move up to an incremental high (no break-out) is also suggesting a top.
That 5 wave move was also back-testing the previous channel that was broken to the downside:
Then yesterday and today we see the Dow attempting a 3rd time to break resistance:
Be wary of a potential 'fake out' today or tomorrow. That probability will likely die with a move below 11,430. The gap at 11,140 and the lower orange trend-line may give some support. I didn't mark it on the chart, but if that support holds and a 4th attempt is made to the upside and breaks the higher orange trend-line, then the 'rule of 4' would suggest that such a move will likely break out strongly to the upside. However, a solid break of that lower orange trend line and 11,104 should keep the selling moving along strongly.
AAPL (Apple Inc.) I suggested that one may want to 'sell the news' on AAPL. Their numbers were strong but they still 'missed' guidance, investors are unforgiving. In the wake, AAPL has put in an 'Island Reversal' at the end of a 'gap happy' streak, often a very strong reversal pattern:
IBM also displaying some topping action:
Overall, the market is looking close to confirming another significant turn, Dow down impulsively another 100pts since I started this post.
Silver - Close to filling out a convincing triangle wave {iv} with a wave {v} down to come which is likely a final fifth:
If this triangle is complete, then Key Support (KS) should be taken out soon, inviting a final thrust to the downside. The end of a final fifth would likely give an excellent buying opportunity, preferably $25ish. I think Gold will likely follow silver down and challenge 1500-1510, with an off chance at 1440ish. I would like to see the GSR (Gold/Silver ratio) not exceed 60ish. If Key resistance is exceeded (33.05), then the triangle denies the dowside potenial and allows for a move up to 36+.
Euro - And the USD, Displayed some good structure indicating a turn, Here is how it looked at the Euro end:
First clue was an (OKR) in the 2hr time frame at the end of a 5 wave structure on the back side of a trend-line that was once support but now resistance.......all coming together to suggest a top, at least ST, was likely.
Then the 4hr time frame added to the signal:
EW counting suggests a 5th wave is finished, a well formed 5 wave impulse, text book example:
The daily BBs were also provinding resistance:
And the larger picture shows the move was inside the multi-month support/resistance zone:
Using mutiple tools at the same time can help hone in on market turns.
Key resistance for the Euro is now at 1.3914. The move down so far could be corrective or something more substantial, not sure yet, but the move looks somewhat choppy. A move below 1.3440 would likely lock in the current top at 1.3914.
...
Sunday, October 16, 2011
MMM Weekly Round Table Discussion 10/16//11 to 10/23/11
I'm still on a busy schedule so updates will still be infrequent and irregular.
You'll notice that the ads are gone. Google AdSense has disabled the account due to 'invalid activity'. They didn't give me any details, just cut off. An appeal was immediately rejected. I can only assume at this time that some 'click-a-holics' out there thinking they are 'being generous' with clicking on my ads a lot have generated this 'invalid activity'. I requested that the hyper active clickers be banned from registering clicks, but it was ignored are is not possible, not sure.
I find it amazing that perhaps 1 or 2 clickers can shut down a whole AdSense account. No warning, just boom done..........Ridiculous.
Ads or not, I'm still here.
...
Dow - Update 10/16/11
The recent stellar run up in the Dow is amazing, not seen since the march 2009 bottom with regards to intensity. This has caused me to pause and take a look at the long term weekly charts to do a trend line study. What I found was very interesting:
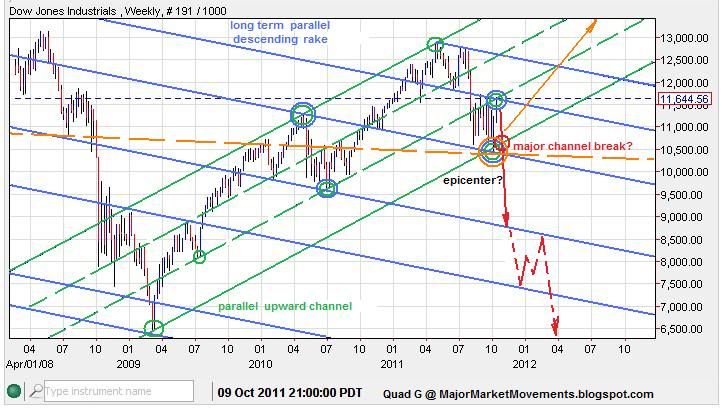
We are seeing a bounce off what looks like a major epicenter of trend lines. Which sets up a major cross road.
Zooming out:
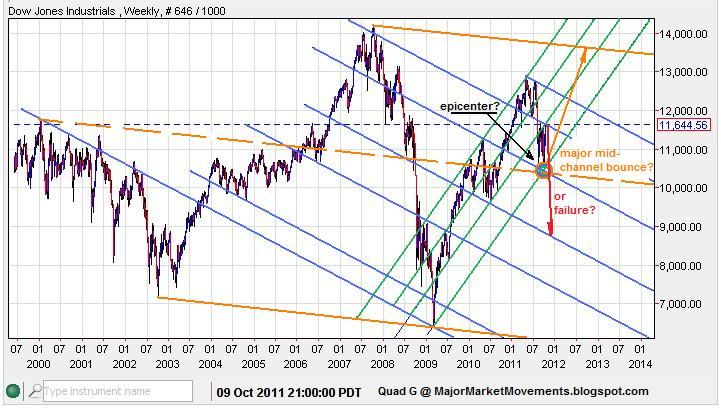
If the orange mid-fork is going to be respected with a strong surge, then I think it's entirely possible that the SM could attempt another higher-high. However, such a move is dependent on the recent low of 10,404 holding as support. Failure at that point would suggest a major channel break is occurring, allowing a drop to 8700ish and lower.
I imagine that the PTB are aware of this situation and are doing their utter best to keep the market afloat. With short interest at a high level, climbing a 'wall of worry' is entirely possible with a little help. The trades going forward are not going to come easily, likely plagued with a great roller coaster of volatility.
...
We are seeing a bounce off what looks like a major epicenter of trend lines. Which sets up a major cross road.
Zooming out:
If the orange mid-fork is going to be respected with a strong surge, then I think it's entirely possible that the SM could attempt another higher-high. However, such a move is dependent on the recent low of 10,404 holding as support. Failure at that point would suggest a major channel break is occurring, allowing a drop to 8700ish and lower.
I imagine that the PTB are aware of this situation and are doing their utter best to keep the market afloat. With short interest at a high level, climbing a 'wall of worry' is entirely possible with a little help. The trades going forward are not going to come easily, likely plagued with a great roller coaster of volatility.
...
Silver - Update 10/16/11
'What was once Support is now Resistance'.
I've mentioned before how $33.50 to $34 was critical support for continued uptrend and that a break of that level invited a move into the 20s. Now that it's firmly established as fact, that same critical support has now become resistance, take a look:
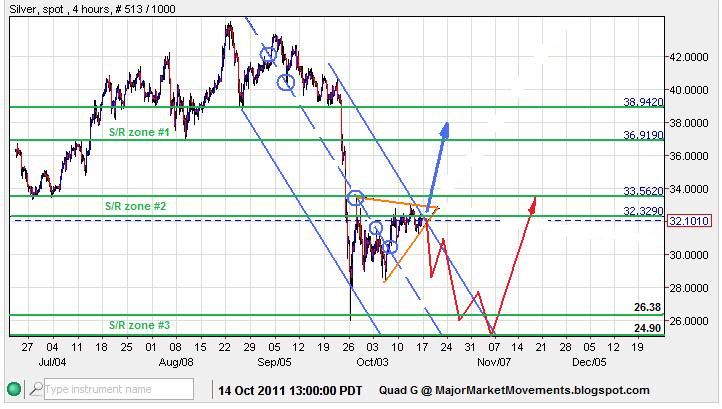
S/R zone #2 is the current area that silver is struggling to overcome, along with the upper blue channel line. If this resistance continues to hold, another drop is possible into S/R zone #3 (24.90 to 26.38) red projection. A lazy drop and hugging the upper channel line would promote bottoming action. If however, S/R zone #2 fails to contain price action (blue projection) then a shot up to zone #3 could be in the works (36.92 to 38.95).
Zooming out we see a larger trend that may also affect price:
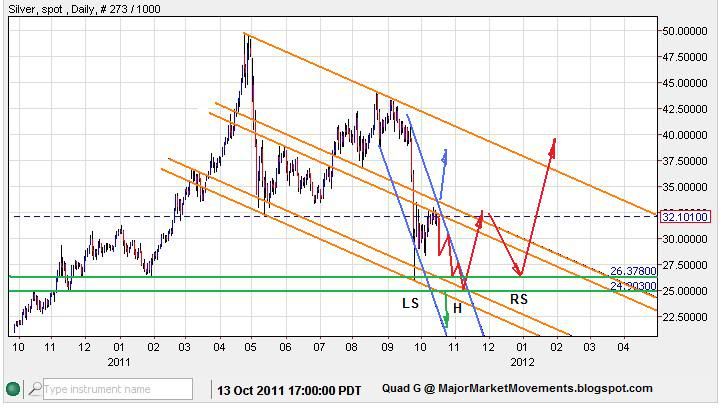
The mid-forks of the larger orange base channel (which is blue in previous charts) is also adding to resistance, but the lower channel lines may provide support if another drop were to occur. Moving below the lower orange channel line (green projection) especially in an impulsive fashion, would be very bearish and could set up a challenge of long term support at $21 to $22.
Looking at the seasonal chart, another secondary low comes into play near the end of the month, from which bullish seasonality should help silver climb higher or soften any further downside:
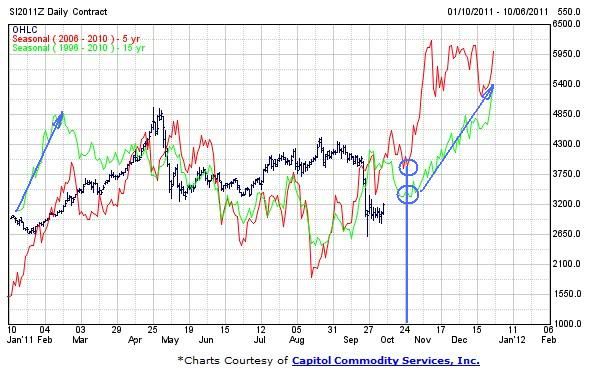
Ultimately I would like to see silver stay above 24.90, gold stay above 1500 and see the GSR remain under below 58 to 60. If pattern, price and time match up by the end of the year, I think another major low will be in place and a surge back up to challenge 50+ again will be likely.
...
I've mentioned before how $33.50 to $34 was critical support for continued uptrend and that a break of that level invited a move into the 20s. Now that it's firmly established as fact, that same critical support has now become resistance, take a look:
S/R zone #2 is the current area that silver is struggling to overcome, along with the upper blue channel line. If this resistance continues to hold, another drop is possible into S/R zone #3 (24.90 to 26.38) red projection. A lazy drop and hugging the upper channel line would promote bottoming action. If however, S/R zone #2 fails to contain price action (blue projection) then a shot up to zone #3 could be in the works (36.92 to 38.95).
Zooming out we see a larger trend that may also affect price:
The mid-forks of the larger orange base channel (which is blue in previous charts) is also adding to resistance, but the lower channel lines may provide support if another drop were to occur. Moving below the lower orange channel line (green projection) especially in an impulsive fashion, would be very bearish and could set up a challenge of long term support at $21 to $22.
Looking at the seasonal chart, another secondary low comes into play near the end of the month, from which bullish seasonality should help silver climb higher or soften any further downside:
Ultimately I would like to see silver stay above 24.90, gold stay above 1500 and see the GSR remain under below 58 to 60. If pattern, price and time match up by the end of the year, I think another major low will be in place and a surge back up to challenge 50+ again will be likely.
...
Tuesday, October 11, 2011
MMM Weekly Round Table Discussion 10/11/11 to 10/16//11
Hey All,
Still a busy time for me. I have much to say and charts to update but have little time. Pardon the calendar, it has 'holes' that need to be filled also.
I will go back to last weeks discussions and answer questions soon.
...
Still a busy time for me. I have much to say and charts to update but have little time. Pardon the calendar, it has 'holes' that need to be filled also.
I will go back to last weeks discussions and answer questions soon.
...
Monday, October 10, 2011
Morning Coffee with Quad G - 10/10/11
Mornin' all,
Just a quick update:
Dow - Took out stops above 11,370, the bearish pattern is busted. 'Recapitalization' and 'nationalization' are the new buzz words to replace 'bailout' for the Euro banking industry. So I guess everything is fine now, move along, nothing to see here. The short squeeze has produced a gap up this AM above 11,100. That gap may be filled at some point, if they fill it quickly and close the day in the red, then it might be a reversal (hang man candle). The Dow is now in a position to possibly produce a bullish iHnS in the next few days, with the right shoulder down needed. The right shoulder cannot move below 10,404 or that bullish potential may die. Daneric's count appears to be the correct one at this time.
USD - Now testing critical support at 77.50ish. It too may produce a bearish HnS in response to the stock market's new found momentum.
Gold - In a range bound triangle between 1597 and 1678, not sure how this is going to play out, USD looking bearish, so a pop through 1678, calcs suggest a target of about 1760 to 1775. But a drop though 1597, points to an initial target of about 1510ish.
Silver - Not behaving as expected. I suspected that it would be going up handily with the stock market, but it still remains at a lower high. Key support for silver is about 28.50ish, a drop through that level invites a move down to the $25 range.
Bonds - Added some TBT. I think some of the new found 'liquidity' in the Euro zone could be coming from the sale of US treasuries. Add to that the risk-on appetite for stocks.
Unfortunately the charting will have to wait.
All the best,
QG
...
Sunday, October 9, 2011
Grains - Update 10/9/11
Corn - Here is the previous chart from July suggesting a handle was forming on a cup, but I didn't know what type of correction was forming or how deep, just that further weakness was likely:
(click on charts for full view)
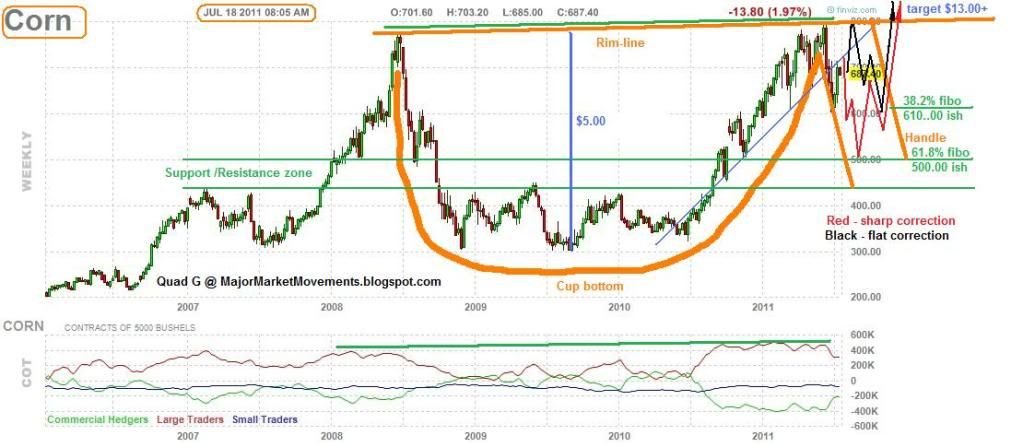
Here is the Update:
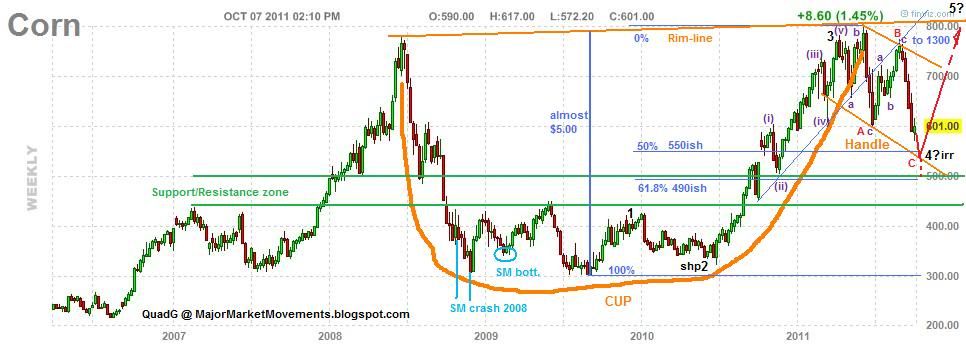
The end of wave C red of 4 black may be finished soon near the 50% to 61.8% retrace level just above the multi-year S/R zone. If however, Corn continues to slide below the S/R zone, then this CnH pattern is likely dead.
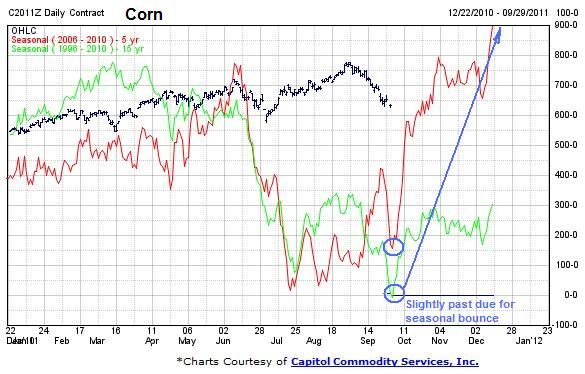
The seasonals suggest that a low is close and a bit over due:
Soybeans - The recent thrust higher failed at the mid-fork of the previous up channel (green), failures at the mid-fork often suggests that the channel is likely to be broken, and it did:
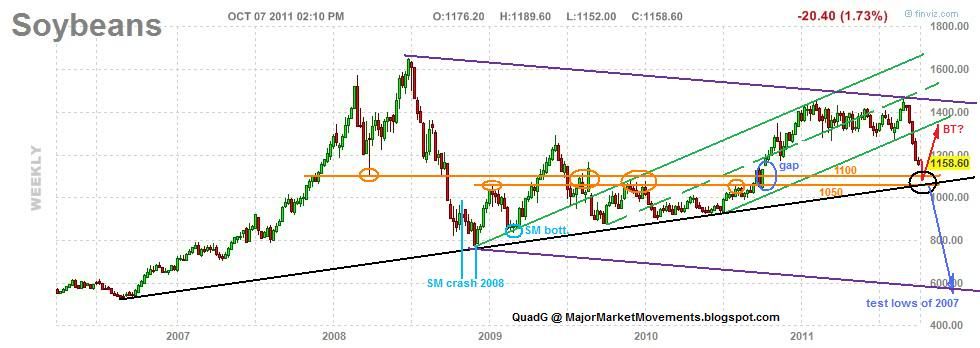
A S/R zone is present between 1050 and 1100, as well as a multi-year uptrend line (black). This should lend plenty of support for at least a bounce up to back test the previous channel at a minimum. If however the black trend-line breaks (blue projection) then capitulation has likely set in and a larger C wave down to the 600s is possible.
The seasonals, like corn, suggest that a bounce is possible soon, if a bit over due:

Wheat - I think the conclusion of a wave 2 black correction could be seen soon. The pattern looks like a possible 3-3-5 expanded flat. It should conclude soon above the lower-green channel line, 61.8% fibo retrace level and the support/resistance area (orange):
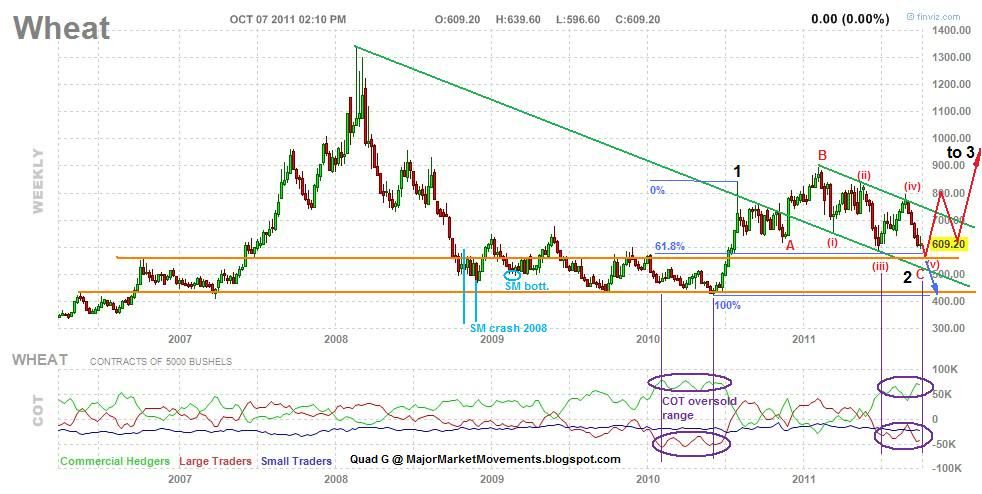
If this level provides support, then a bounce back up to the mid-700s to 800 seems probable, possibly the right neck of a bullish iHnS. The COT levels are entering an oversold area. If however, the price of wheat falls below the lower-green channel line (blue projection), then the 400 level is likely to be tested along with further downside if the previous green channel becomes resistance instead of support.
The seasonal chart suggests a minor up swing is possible soon into November, but further weakness expected into the end of the year:
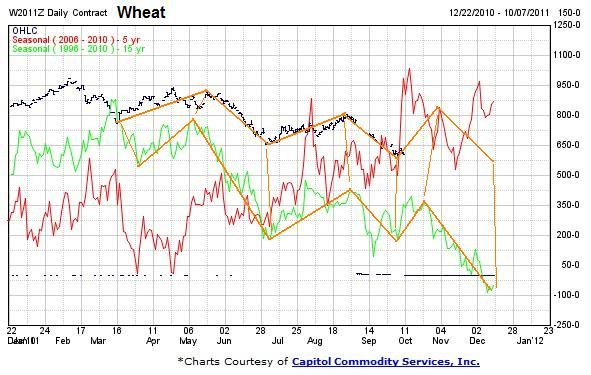
Also note the pale blue areas of each chart. The bracket shows where the worst of the 2008 Stock Market (SM) dump occurred. Notice how the grains barely moved in comparison. The pale blue circle was near the end of the SM decline in March 2009, yet the grains put in higher-lows.
...
(click on charts for full view)
Here is the Update:
The end of wave C red of 4 black may be finished soon near the 50% to 61.8% retrace level just above the multi-year S/R zone. If however, Corn continues to slide below the S/R zone, then this CnH pattern is likely dead.
The seasonals suggest that a low is close and a bit over due:
Soybeans - The recent thrust higher failed at the mid-fork of the previous up channel (green), failures at the mid-fork often suggests that the channel is likely to be broken, and it did:
A S/R zone is present between 1050 and 1100, as well as a multi-year uptrend line (black). This should lend plenty of support for at least a bounce up to back test the previous channel at a minimum. If however the black trend-line breaks (blue projection) then capitulation has likely set in and a larger C wave down to the 600s is possible.
The seasonals, like corn, suggest that a bounce is possible soon, if a bit over due:
Wheat - I think the conclusion of a wave 2 black correction could be seen soon. The pattern looks like a possible 3-3-5 expanded flat. It should conclude soon above the lower-green channel line, 61.8% fibo retrace level and the support/resistance area (orange):
If this level provides support, then a bounce back up to the mid-700s to 800 seems probable, possibly the right neck of a bullish iHnS. The COT levels are entering an oversold area. If however, the price of wheat falls below the lower-green channel line (blue projection), then the 400 level is likely to be tested along with further downside if the previous green channel becomes resistance instead of support.
The seasonal chart suggests a minor up swing is possible soon into November, but further weakness expected into the end of the year:
Also note the pale blue areas of each chart. The bracket shows where the worst of the 2008 Stock Market (SM) dump occurred. Notice how the grains barely moved in comparison. The pale blue circle was near the end of the SM decline in March 2009, yet the grains put in higher-lows.
...
Wednesday, October 5, 2011
Morning Coffee with Quad G - 10/5/11
Mornin' all,
Dow - Here is the 2008 analog that I have been tracking for the past few weeks:
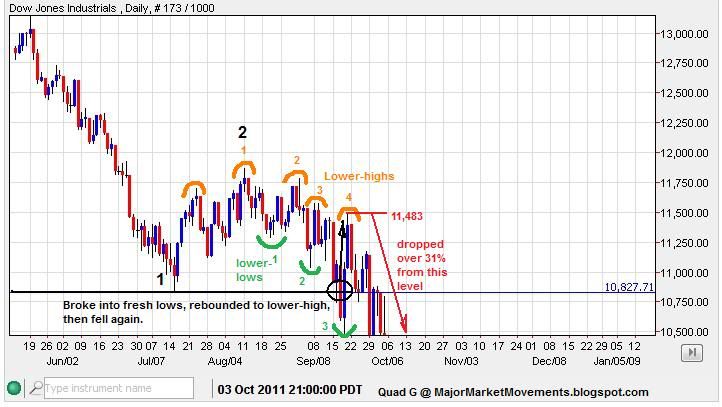
Notice the similarities to the current movements in 2011:
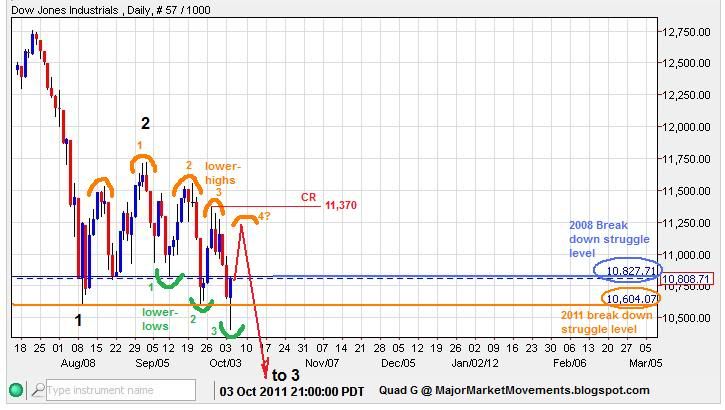
And then zoom out to the larger picture:
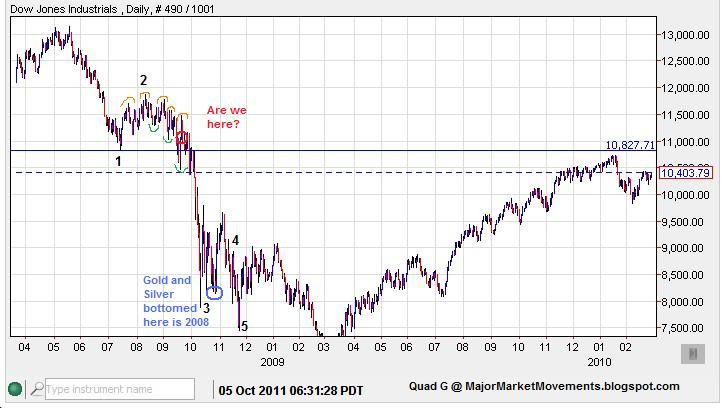
Wave 3 black down could be a doozy. This bearish pattern will be killed if the Dow breached 11,370.
Now you might be wondering why I didn't start tracking the analog from the 2007 top. Let me explain: The drop from Oct 2007 to March 2009 was a large wave (1). The rebound up to 12,751 in July was larger wave (2). Now I think large wave (3) down has started, but since wave 3s are most often much stronger in conviction than wave 1s, I suspect that this wave (3) down is going to start off looking like the worst part of the previous wave (1).
Gold - Currently looking bearish after a failure to move above critical resistance and the 10EMA. A small 5 wave impulse down is likely to lock in a ST top at 1678. I expect 2 more legs down to complete a 5 wave series that should retest and possibly exceed the low at 1532. But this low could finish the bearish pattern since 1912, possibly providing a major bottom.
Silver - Still looks ST bearish while below 31.50 and the 10EMA (currently 31.75). A retest of the lows at 26 looks likely while below those levels. But it's very possible that this is a major low.
USD - Making odd EW patterns, so I always fall back on the 3/10/20 ribbon. The trend still remains bullish while daily closes remain above the 10EMA (currently 78.45) and intra-day remains above 77.50. Sinking below those levels suggests the uptrend is jeopardy.
Good Hunting.
...
Dow - Here is the 2008 analog that I have been tracking for the past few weeks:
Notice the similarities to the current movements in 2011:
And then zoom out to the larger picture:
Wave 3 black down could be a doozy. This bearish pattern will be killed if the Dow breached 11,370.
Now you might be wondering why I didn't start tracking the analog from the 2007 top. Let me explain: The drop from Oct 2007 to March 2009 was a large wave (1). The rebound up to 12,751 in July was larger wave (2). Now I think large wave (3) down has started, but since wave 3s are most often much stronger in conviction than wave 1s, I suspect that this wave (3) down is going to start off looking like the worst part of the previous wave (1).
Gold - Currently looking bearish after a failure to move above critical resistance and the 10EMA. A small 5 wave impulse down is likely to lock in a ST top at 1678. I expect 2 more legs down to complete a 5 wave series that should retest and possibly exceed the low at 1532. But this low could finish the bearish pattern since 1912, possibly providing a major bottom.
Silver - Still looks ST bearish while below 31.50 and the 10EMA (currently 31.75). A retest of the lows at 26 looks likely while below those levels. But it's very possible that this is a major low.
USD - Making odd EW patterns, so I always fall back on the 3/10/20 ribbon. The trend still remains bullish while daily closes remain above the 10EMA (currently 78.45) and intra-day remains above 77.50. Sinking below those levels suggests the uptrend is jeopardy.
Good Hunting.
...
Tuesday, October 4, 2011
Trade School - Dow and the 78.6% fibo retrace 10/4/11
The most common Fibonacci retrace levels are the 38.2%, 50.0% and 61.8%, these levels have stopped and started trends for decades. But also of significant importance are the 23.6% and 78.6% retrace levels. For today's discussion we'll focus on the little known 78.6% level. The Dow is being used for this particular demonstration, but the same concept can be applied to any market.
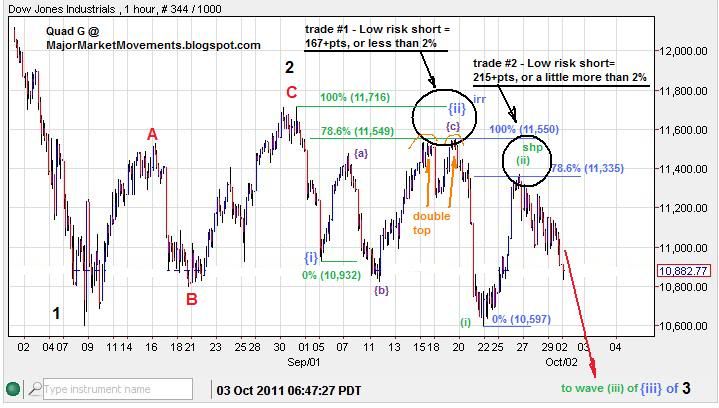
In the past couple weeks the Dow has provided 2 very low-risk entries to initiate short positions. Notice that I have them both counted as 2nd waves, the 78.6% fibo can often be reached during a 2nd wave.
Trade #1 - Since a 2nd wave is not allowed to retrace 100% of wave 1, the top of wave 1 becomes the stop loss level. In this case the stop loss level is 11,716 as the origination of wave {i} blue down. Eying the 78.6% retrace level of wave {i}, a double top is formed right at that level, providing a less that 2% risk for a Dow short position. With a potential 20%+ drop according to my wave count, That provides an approximate Risk/Reward/Ratio of about 1:10, which is well worth my attention.
Trade #2 - Was another 'gimme'. Wave (ii) green also retraced and stalled right at the 78.6% fibo of wave (i) green. This provided a second low risk entry on a short position of just over 2%.
Now with stops set between 11,150 and 11,370 I have two short positions with good odds of greater downside loaded with minimal risk. At worst these trades could be stopped out for a small gain and break-even.
Many traders will often wait to enter a position after some kind of confirmation or strong move. I actually discourage that thinking because the risk can be greater. In my way of thinking, it's better to top pick or bottom pick starting with a partial position, then chase a trend that has already started. When the bus has left the station, chasing it can have greater risks. What if the bus suddenly stops and reverses while you are trying to get on? you could soon see your position under the bus. No, a better place to gage risk is at the designated bus stops, when price action is calmer and more organized. Trade management is risk management, in any market the ONLY thing you can positively control is the amount of risk one is willing to take......the ONLY thing. You have 0% control over price action, but you have 100% control over risk, therefore it's best to find and act on the conditions that provide the least amount of risk.
...
Morning Coffee with Quad G - 10/4/11
Mornin' all,
Gold - Currently struggling with the 10EMA, which is the first sign that a recovery is possible soon. The 3/10/20 still maintains it's bearish alignment, so bottom picks are generally small, exploratory positions.
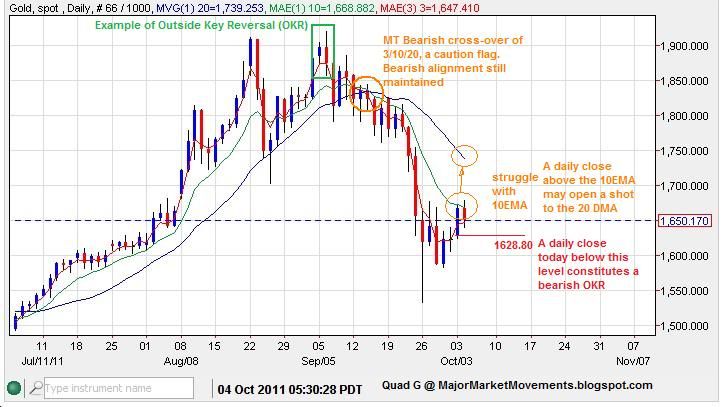
A daily close above the 10EMA may be able to pull the 3EMA above, causing the alignment to become neutral, which may open up a shot to test the 20DMA (currently at 1739ish. However, looking ahead at potential candle patterns, a daily close below 1628.80 would signal an Outside Key Reversal(OKR) inviting more selling with a potential ST top at 1678ish.
The ST EW pattern is starting to remind me of the Bullish barrier triangle that was formed in late August. Still early to tell, but staying above 1582 in a choppy sideways action will encourage this concept.
Dow - Plenty of bearish sign lately:
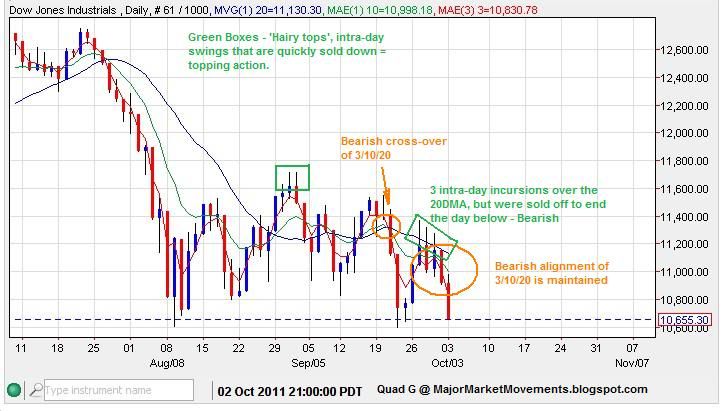
'Hairy' tops and closing under the 20DMA has helped maintain a bearish alignment of the 3/10/20 ribbon. I see a gap down this morning after breaking into fresh multi-week lows. The Bollinger bands are starting to expand as the lower band is 'pushed'.
I mentioned the 78.6% Fibonacci retrace level on some ST rallies recently. I will post a separate Trade School article depicting their importance.
Bernanke is going to speak at 7AM (PST). This would be a fine time to announce a surprise to gin up the markets.
We,ll see....
Good Hunting
...
Gold - Currently struggling with the 10EMA, which is the first sign that a recovery is possible soon. The 3/10/20 still maintains it's bearish alignment, so bottom picks are generally small, exploratory positions.
A daily close above the 10EMA may be able to pull the 3EMA above, causing the alignment to become neutral, which may open up a shot to test the 20DMA (currently at 1739ish. However, looking ahead at potential candle patterns, a daily close below 1628.80 would signal an Outside Key Reversal(OKR) inviting more selling with a potential ST top at 1678ish.
The ST EW pattern is starting to remind me of the Bullish barrier triangle that was formed in late August. Still early to tell, but staying above 1582 in a choppy sideways action will encourage this concept.
Dow - Plenty of bearish sign lately:
'Hairy' tops and closing under the 20DMA has helped maintain a bearish alignment of the 3/10/20 ribbon. I see a gap down this morning after breaking into fresh multi-week lows. The Bollinger bands are starting to expand as the lower band is 'pushed'.
I mentioned the 78.6% Fibonacci retrace level on some ST rallies recently. I will post a separate Trade School article depicting their importance.
Bernanke is going to speak at 7AM (PST). This would be a fine time to announce a surprise to gin up the markets.
We,ll see....
Good Hunting
...
Monday, October 3, 2011
MMM Weekly Round Table Discussion 10/3/11 to 10/9/11
This month is going to be very busy and erratic for me. There may be days and even whole weeks that I will not be able to post at all.
I am able to respond to questions and comments on the road thanks to the smart phone. But I do not always have access to a laptop or desk top to view charts on the Netdania platform, so some details will not be available to me and producing charts will be difficult at times
...
I am able to respond to questions and comments on the road thanks to the smart phone. But I do not always have access to a laptop or desk top to view charts on the Netdania platform, so some details will not be available to me and producing charts will be difficult at times
...
Sunday, October 2, 2011
HUI - Why Alternation Matters 10/2/11
Back in early July I presented this chart of HUI:
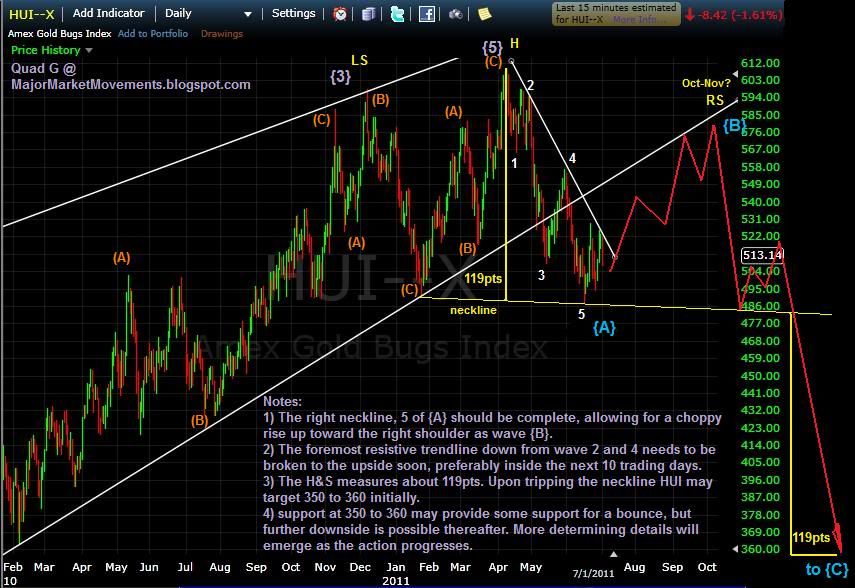
I was counting on a final 5th wave and the start of impulsing to the downside (5 waves down into wave {A}blue). What I failed to consider is that wave {4} was likely an expanded flat to alternate with the sharp wave {2} as depicted in this chart:
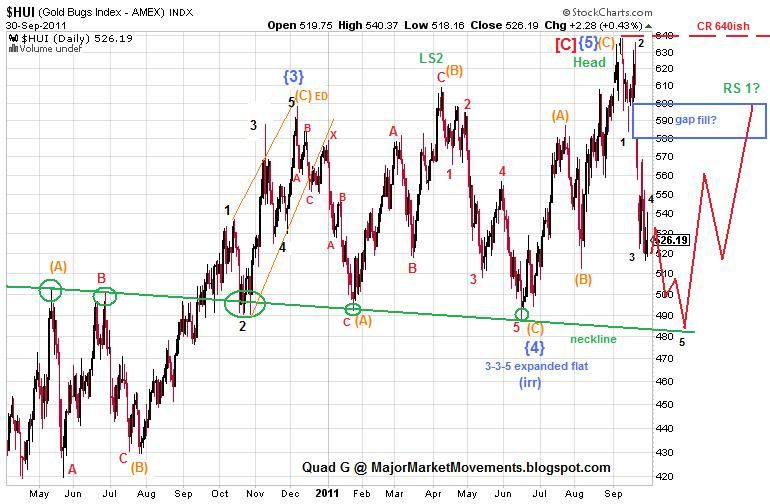
I also didn't consider that wave (C) orange of wave {3} blue could have been an ending diagonal with a very short lived and excitable 3rd wave.
Another HnS pattern could be setting up again, possibly with two sets of shoulders, with a Right Shoulder #1 (RS1) likely to fill the large gap down (blue box). The right neckline likely to be completed soon in October.
Here is what the pattern would look like zoomed out to incorporate the 2000 bottom:

This larger view also requires us to consider that a very larger ABC structure could be complete here. Wave [C] red now equals wave [A] (about 490pts a piece) a common EW relationship. Wave [A] was a well organized impulse to the upside, but wave [C] has so far produced a very choppy move to the upside with many overlaps, a quality of ending diagonals. I suspect that a right shoulder bounce should arrive soon, but needs to stay above that neckline (green) on a weekly closing basis. If that neckline does not give support (blue projection) then a right shoulder could be denied and a test of the previous area of price congestion may come much sooner than later.
This HnS idea is killed if price moves above the head near 640ish.
One more thought to throw into the mix, that of the expanded triangle count:

Expanding triangles are rare, but the current pattern is very close to producing one. Wave (C) would need a reinterpretation, and wave (E) should stay above the neckline as a 3 wave move. This would allow for another 3 wave move up as a final 5th above 640.
From a fundamental stand point, if crude continues it's MT trend to the downside (target 60 next, then 33 to 45 eventually), but gold finds a significant bottom this month. The profitability of miners will gain as fuel costs would likely shrink considerably. Those miners with little or no debt and large dividends will likely survive the best under another stock market sell-off. Some juniors with pristine balance sheets, good management and proven reserves may become take over targets by some seniors if their stock prices are dumped into an attractive buy zone.
Good Hunting.
...
I was counting on a final 5th wave and the start of impulsing to the downside (5 waves down into wave {A}blue). What I failed to consider is that wave {4} was likely an expanded flat to alternate with the sharp wave {2} as depicted in this chart:
I also didn't consider that wave (C) orange of wave {3} blue could have been an ending diagonal with a very short lived and excitable 3rd wave.
Another HnS pattern could be setting up again, possibly with two sets of shoulders, with a Right Shoulder #1 (RS1) likely to fill the large gap down (blue box). The right neckline likely to be completed soon in October.
Here is what the pattern would look like zoomed out to incorporate the 2000 bottom:
This larger view also requires us to consider that a very larger ABC structure could be complete here. Wave [C] red now equals wave [A] (about 490pts a piece) a common EW relationship. Wave [A] was a well organized impulse to the upside, but wave [C] has so far produced a very choppy move to the upside with many overlaps, a quality of ending diagonals. I suspect that a right shoulder bounce should arrive soon, but needs to stay above that neckline (green) on a weekly closing basis. If that neckline does not give support (blue projection) then a right shoulder could be denied and a test of the previous area of price congestion may come much sooner than later.
This HnS idea is killed if price moves above the head near 640ish.
One more thought to throw into the mix, that of the expanded triangle count:
Expanding triangles are rare, but the current pattern is very close to producing one. Wave (C) would need a reinterpretation, and wave (E) should stay above the neckline as a 3 wave move. This would allow for another 3 wave move up as a final 5th above 640.
From a fundamental stand point, if crude continues it's MT trend to the downside (target 60 next, then 33 to 45 eventually), but gold finds a significant bottom this month. The profitability of miners will gain as fuel costs would likely shrink considerably. Those miners with little or no debt and large dividends will likely survive the best under another stock market sell-off. Some juniors with pristine balance sheets, good management and proven reserves may become take over targets by some seniors if their stock prices are dumped into an attractive buy zone.
Good Hunting.
...
Subscribe to:
Posts (Atom)