Showing posts with label Wheat. Show all posts

Sunday, March 3, 2013

MMM Weekend Update 3-3-13

Gold - There is much in the way of technicals that are suggesting that Gold could be bottoming this week. Other than the Fibo turn date window (March 6th to March 11th)that I have outlined on previous blog posts, Elliot Waves and candle sticks are all suggesting a turn is quickly developing for both Gold and Silver.


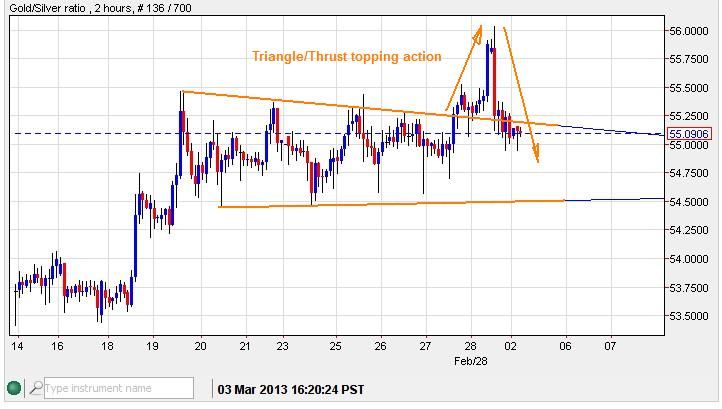
The GSR has posted another inverted hammer candle (bullish for PMs) while GSR is diverging from the price of Gold with a lower-high. Also, a Triangle/Thrust topping pattern was printed last Friday.


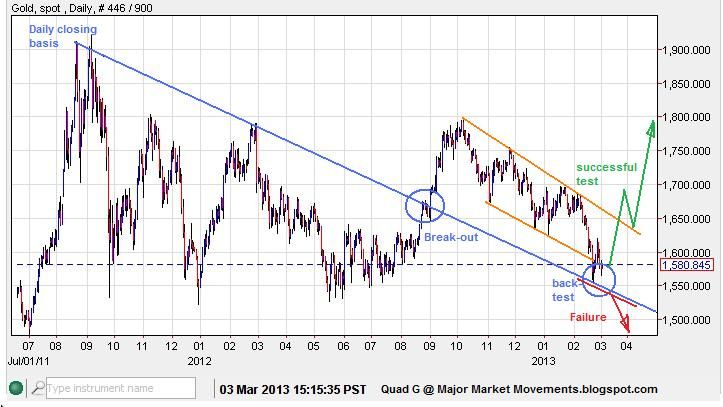
Gold has also performed a prefect back-test of the previous break-out of a trend-line formed by the daily closing highs of the past several months.


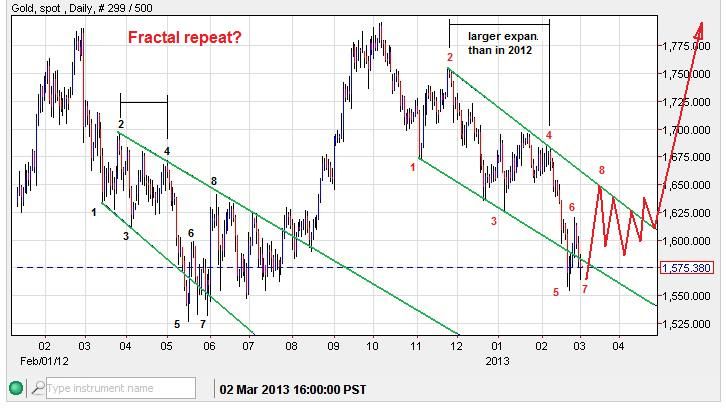
Also of interest, there is a peculiar fractal repeat that mimics much of the previous sell-off in mid- 2012:


There is plenty of technical excuse for Gold to bottom and start moving higher, a failure to do so would likely draw the price down as longs are fleeced.

--------------------------------------------------------------------------------------------------------------------------------------

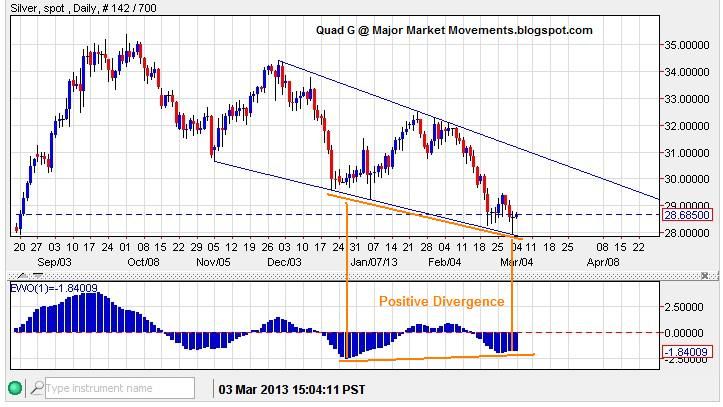
Silver - A complete EW pattern is finished to the downside, confirmed with a move above 29.47. Since the pattern is made of 3 sets of impulses, a nesting set of corrections could be pointing to an impulsive 3rd of a 3rd move to the downside, but price will need to stay below the upper trend-line. A break above it would promote the Ending Diagonal count.


Compared to the EWO (Elliot Wave Oscillator)a 5th wave +ve divergence can be seen.


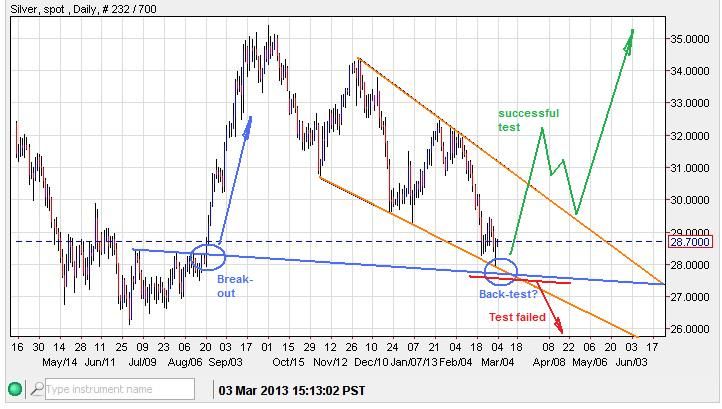
In August 19-20 of 2012 I called for a break-out with a move above 28.50, and the market delivered. However, the price took off and never gave a back-test of that significant break-out. It is not an absolute requirement that break-outs or break-downs provide a back-test, however price movement is generally more healthy when it does.
For Silver, that back-test is finally here:


--------------------------------------------------------------------------------------------------------------------------------------

USD - The second right shoulder that I have shown previously is about cooked:
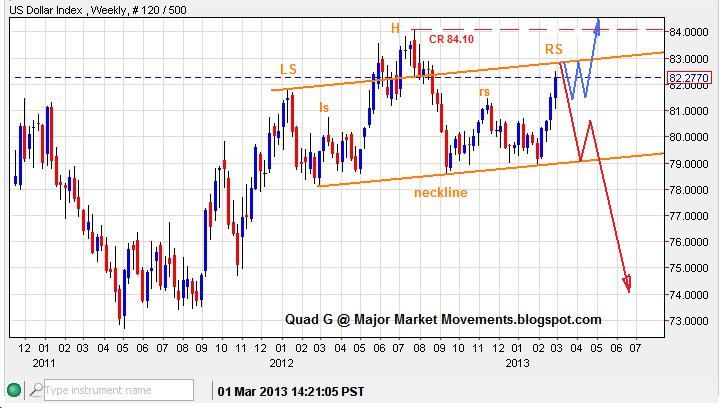


If this is the completion of the right shoulder, then price should respond with a fairly quick drop back down to the neckline.

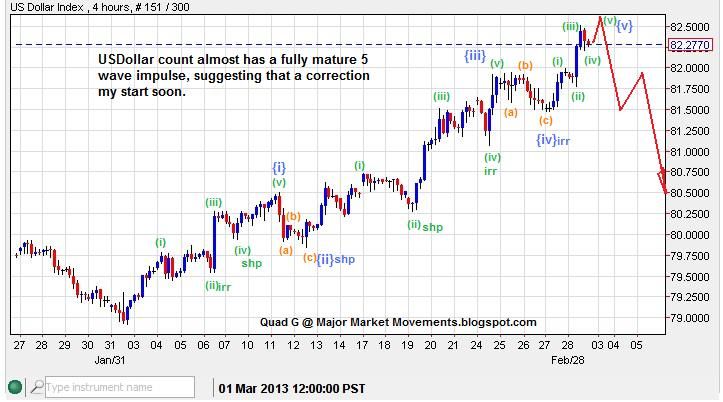
A ST EW count suggests the move is terminal with a final 5th wave up.


-------------------------------------------------------------------------------------------------------------------------------------

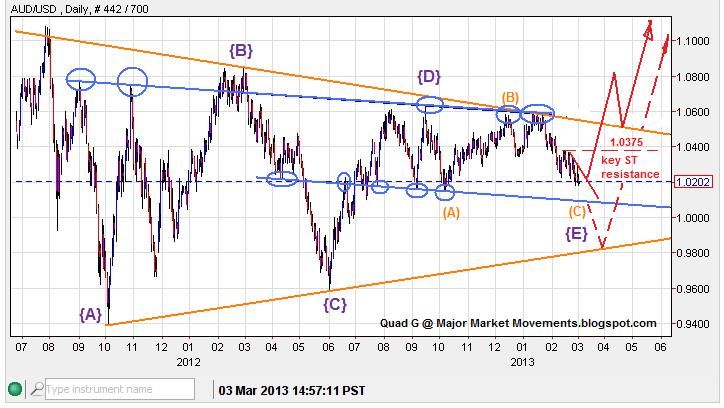
AUD/USD - The triangle pattern that I have been chasing could be completed soon as wave {E} could be finished with a move above 1.0375


-------------------------------------------------------------------------------------------------------------------------------------

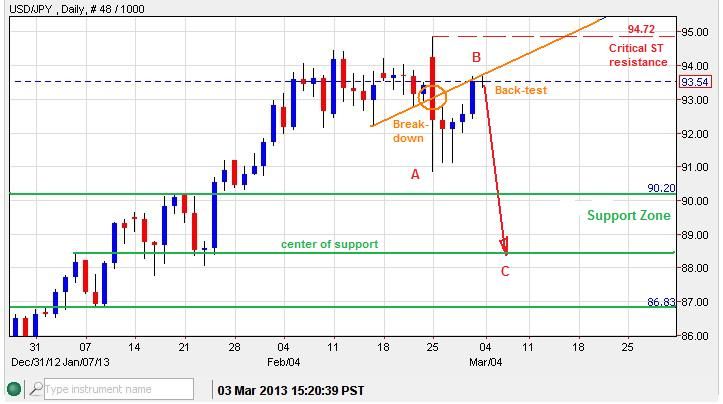
USD/JPY - Subscribers were warned of a possible top due to a triangle/top pattern that popped and reversed very suddenly. Now price is back-testing the break-down, possibly as a wave B bounce, followed by wave C down. But price will need to keep below 94.72


------------------------------------------------------------------------------------------------------------------------------------

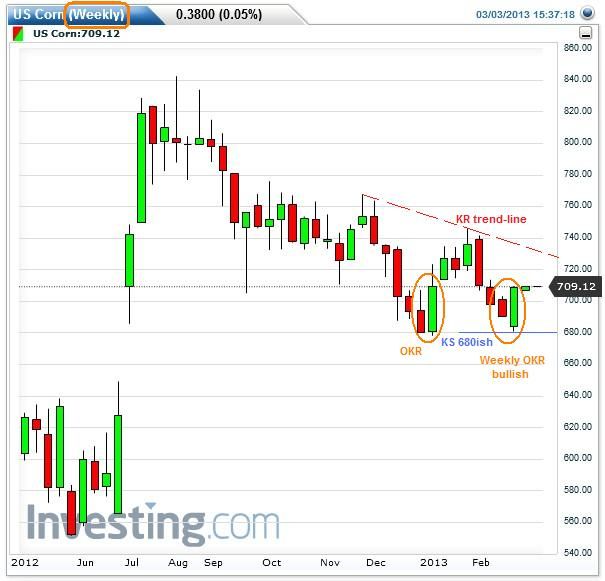
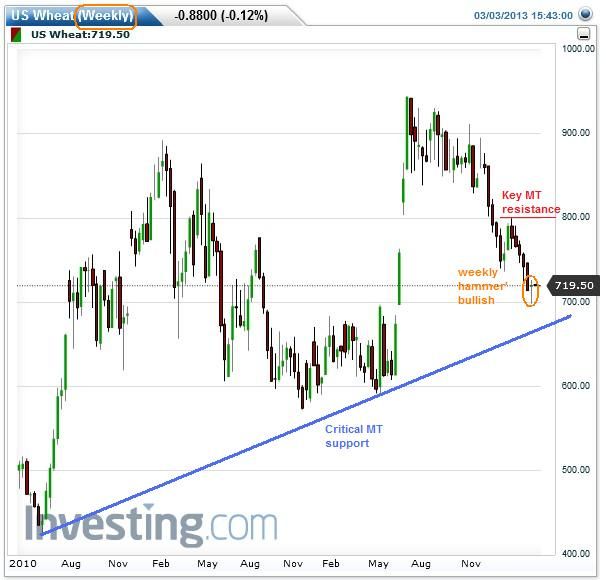
Corn and Wheat - Both have posted reversal candles on the weekly chart, suggesting buyers are taking interest again at these levels.


-----------------------------------------------------------------------------------------------------------------------------------

This week is set up for some exciting moves, keep frosty.
Quad G

If you are interested in receiving daily email updates concerning the QG3 and other 'Major Market Movements', sign up here:
http://majormarketmovements.blogspot.com/p/mmm-market-signal.html


Sunday, January 13, 2013

MMM Weekend Update 1-13-13

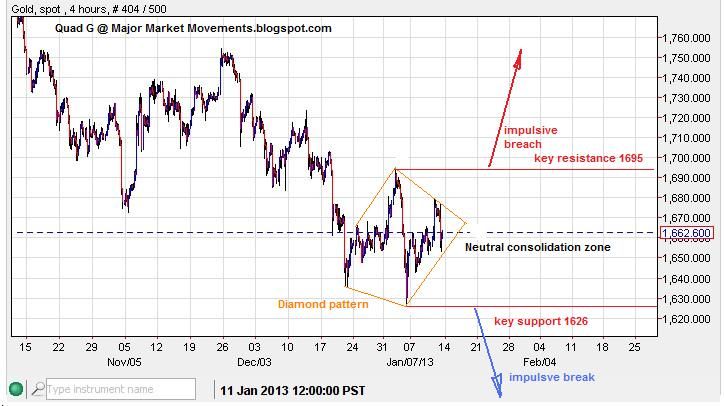
Gold - Has built a rare, but powerful 'Diamond' pattern. If the extremes of the pattern are exceeded the result is usually an impulsive move.


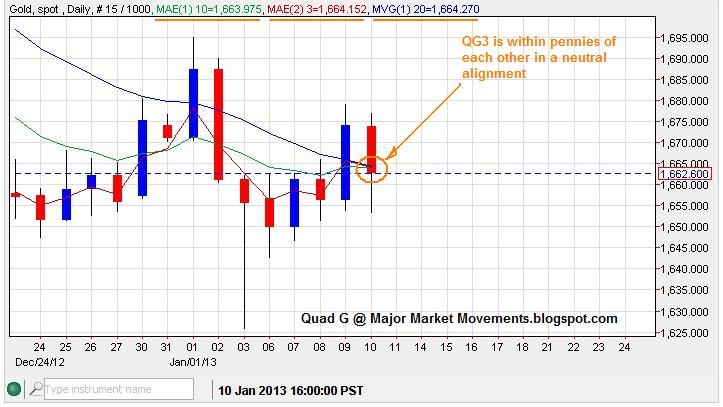
The QG3 is in a neutral alignment, flat, not bullish or bearish:


There are some fibo turn date windows just ahead.
- daily windows: From the open on Jan 14 to the close on Jan 18th. And the Feb 3rd open to the Feb. 6th close.
-Weekly window: Starting Sunday Jan. 13th till close on the 18th. So much greater potential for a turn next week than the single daily turn I posted back around December 18th which only spear headed a multi-day bounce. The weekly trend is certainly down into the window, so it's most likely a bottom.

-------------------------------------------------------------------------------------

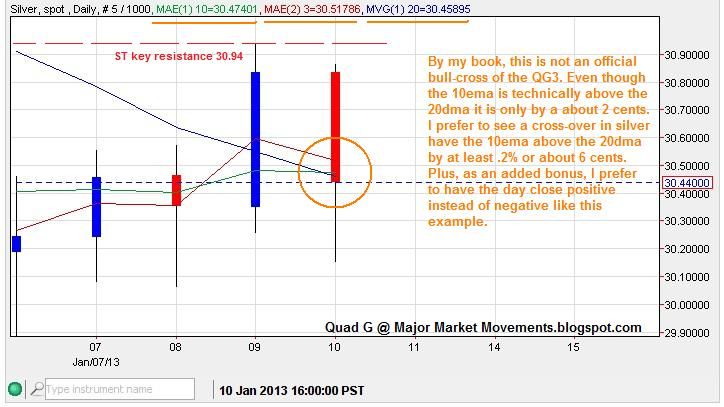
Silver - Price remains below a key mid channel line that is posing resistance at the moment:


The QG3 is also neutral for silver:


-------------------------------------------------------------------------------------

EUR/USD - Moved as anticipated, after a successful back-test, the bounce back up to take out 1.3300 was swift, further upside to the target of 1.3580ish is expected. Key MT support is now at 1.3000.

-------------------------------------------------------------------------------------

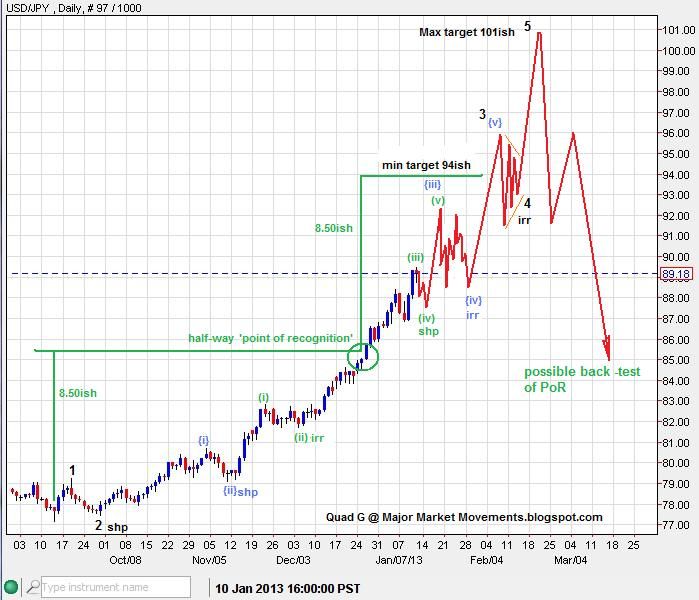
USD/JPY - This impuslive run has exceeded expectations! WOW! It's possible to reconfigure the impulsive count, as several waves could be 'nested' providing for further upside:


zoomed out:


-------------------------------------------------------------------------------------

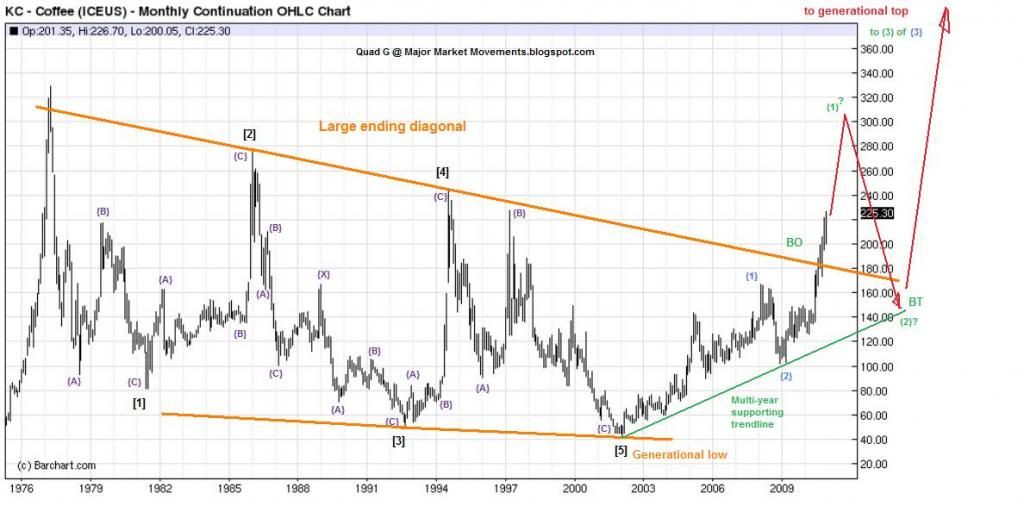
Coffee - I've been hunting for a major low in coffee for the past few months. Here is the primary reason why:

(click image for full view)


The ST gives a promising potential for a bottom, perhaps a major one:


-------------------------------------------------------------------------------------

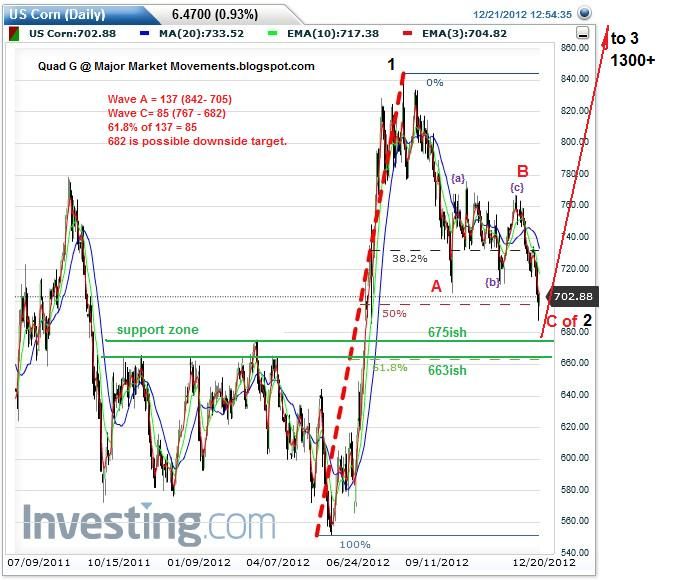
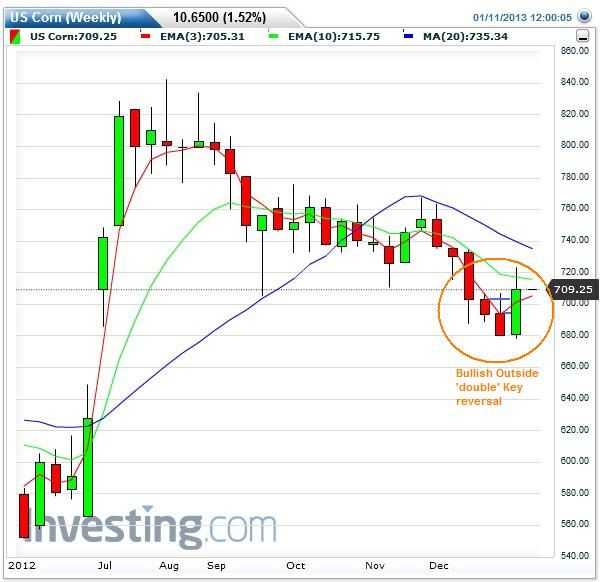
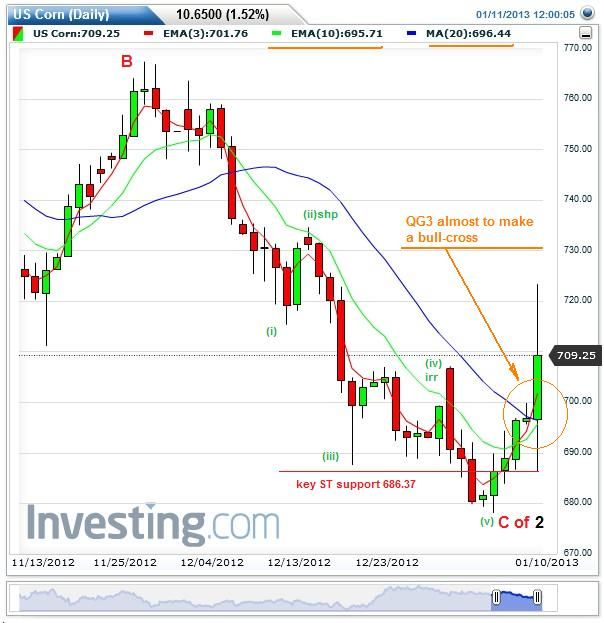
Corn - I posted this chart on December 23rd, which had a support zone of 663 to 675 with an EW target of 682.


We saw a bullish bounce this week off that support zone:

Weekly chart


Daily chart


-------------------------------------------------------------------------------------

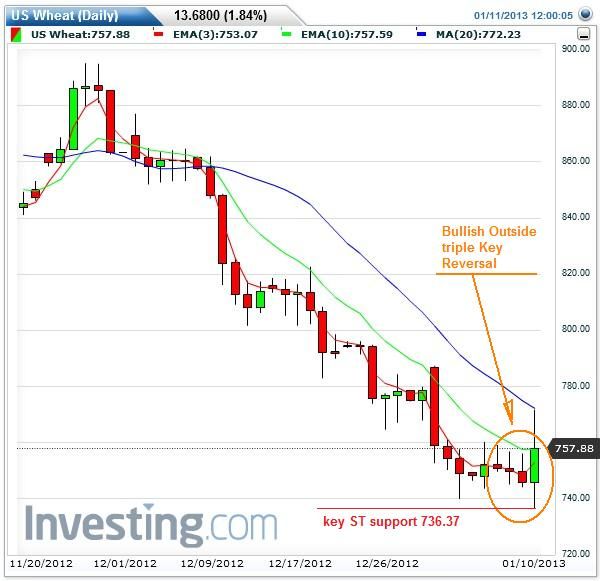
Wheat - Also showing signs of a potential reversal and bottom:


-------------------------------------------------------------------------------------

Soybeans - Posted a bullish dragon-fly doji on the daily chart, perhaps in sympathy with Corn's move last week. A reversal in the downtrend could be realized with a weekly close this week above 1415.62

-------------------------------------------------------------------------------------

My video about the QG3 (3/10/20 ribbon) is essentially complete, but requires some editing. It's very possible to be complete this week. The process of producing video is all very new to me, please pardon the delay as I hike up the learning curve.

Good Hunting :)

and GO SEAHAWKS!

QG

Sunday, November 18, 2012

MMM Weekend Update 11-18-12

Gold - Last week posted an inside week for gold, appearing as a choppy corrective move to the downside.


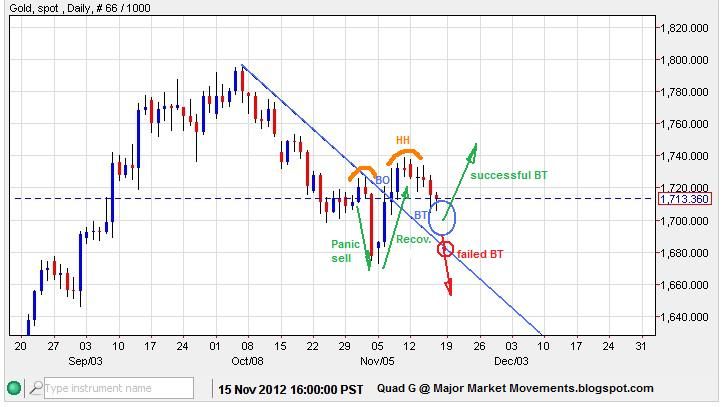
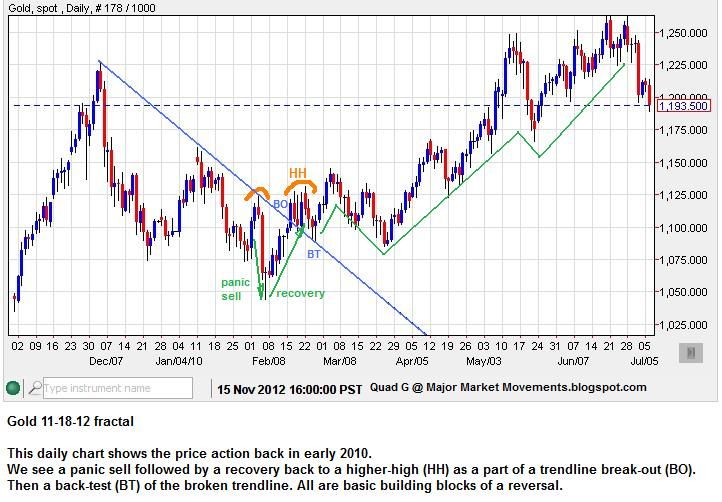
PoG was likely working on the back test of the previous break-out:


This has occurred in the past with bullish results:


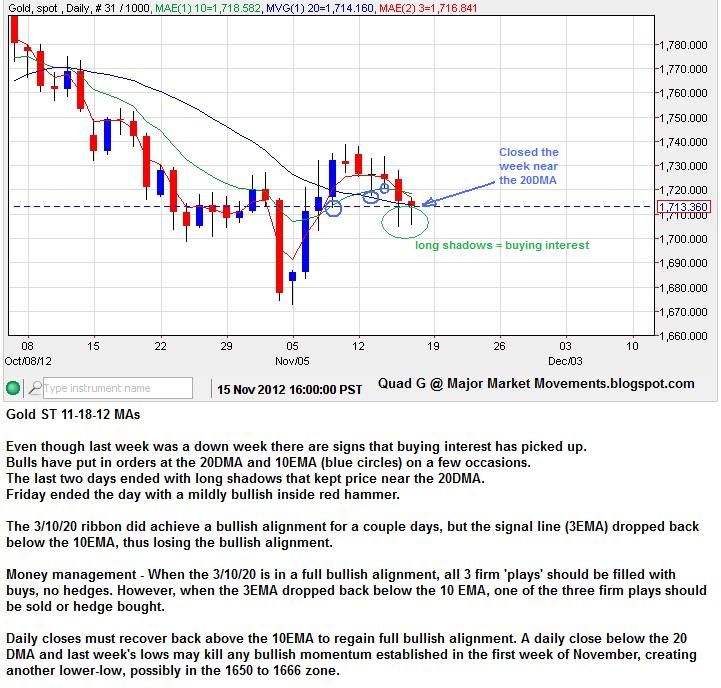
The 3/10/20 ribbon is currently in a 'neutral' position with the 3EMA moving back below the 10EMA:


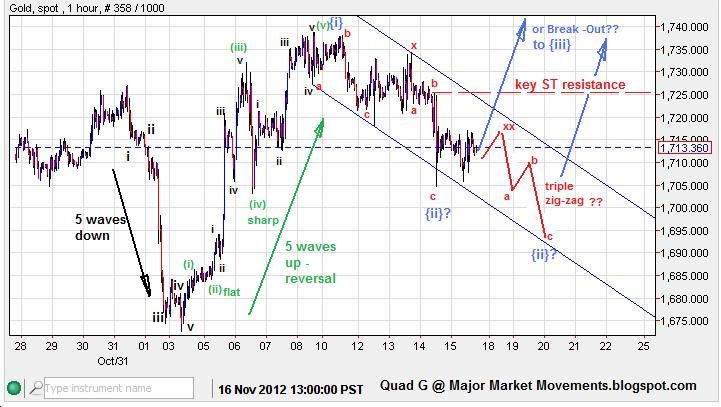
The Short Term (ST) Elliot Wave (EW) picture still shows Bullish potential as price moves down in a choppy manner after a 5 wave impulse reversal:


Critical support is still 1672 to 1682. Moves below this level invites a test of a support zone between 1650 to 1666.

-------------------------------------------------------------------------------------

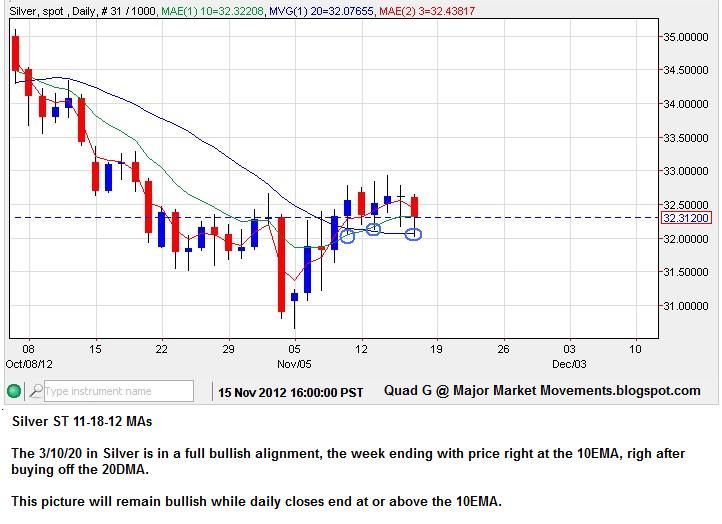
Silver - Has moved into a full bullish alignment of the 3/10/20 ribbon:


30.66 to 31.06 is critical support. I suspect that once 33.00 is breached, a pop up to 35+ is likely in the ST. All part of a MT move up to 45ish.

-------------------------------------------------------------------------------------

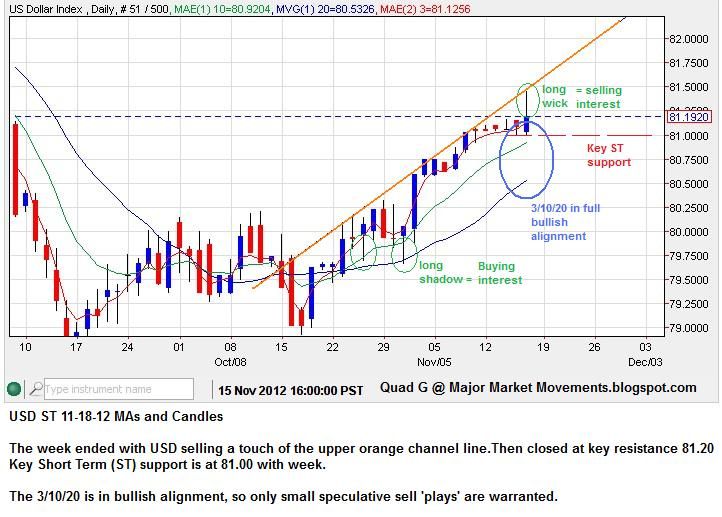
USD - Felt the effects of resistance near 81.20ish:


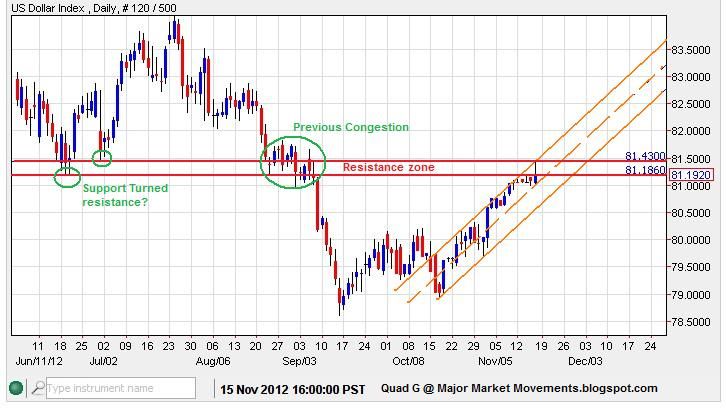
Zooming out, we see the USD tangling with previous support that has now formed resistance:


-------------------------------------------------------------------------------------

USD/JPY - The chart picture last week had some conflicting, bullish/bearish indicators. However the bull side come out on top:


-------------------------------------------------------------------------------------

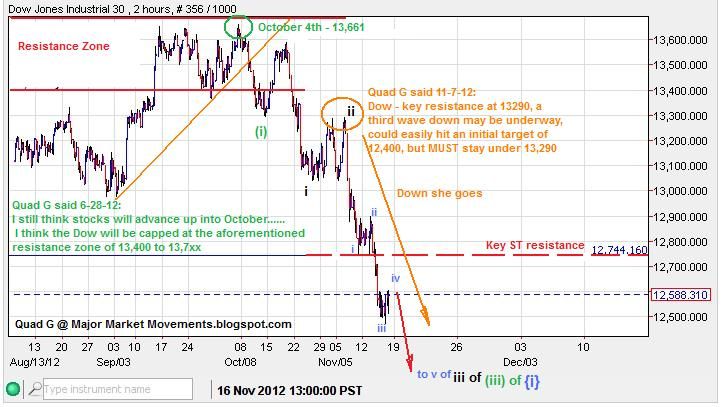
Dow - 3rd wave down reached 'point of recognition':


The lower green trend-line is very probable target to finish the right neckline, below at 12,124ish:


-------------------------------------------------------------------------------------

Palladium - Has bullish potential above 600, could challenge 700+ fairly soon. In the ST, Pall becomes bearish below 600.

-------------------------------------------------------------------------------------

Wheat - Broke down through the triangle formation which is bullish and bearish. Bullish because the next wave higher is less likely to be 'terminal'. Bearish because price will have to seek out a lower level of support, $8.00 sticks out as very probable.

Corn - may have one more small leg lower to 670 to 700 finish this multi-month correction. Any move in the ST back above 755 confirms the end of this current correction.

Soybeans - Is done or nearly done with it's multi-month correction. A quick move higher back above 1430 should lock in a MT bottom with upside target of 1800+. Any further selling on strong volumes below 1310ish kills great sums of bullish potential.

-------------------------------------------------------------------------------------

That's all for now.

For free email updates, sign up in the right side column with the 'Follow by email' widget.


...


Sunday, November 11, 2012

MMM Weekend Update 11-11-12


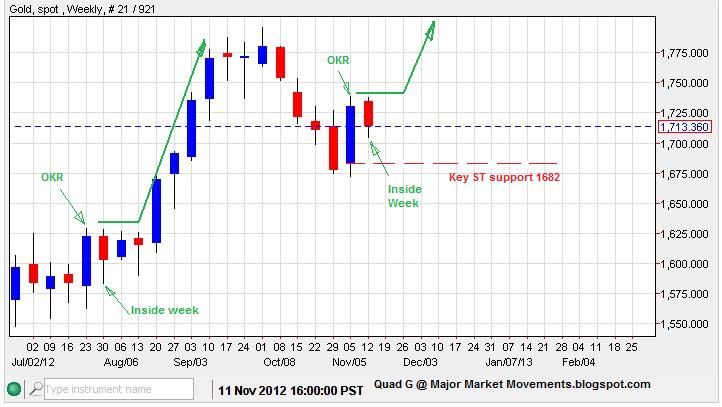
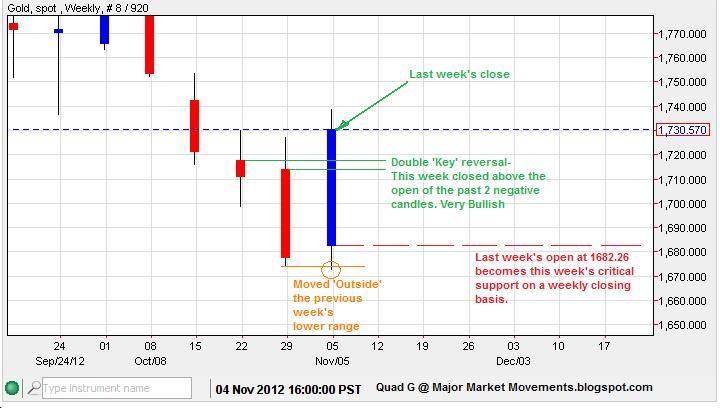
Gold - Price gave a bullish MT signal with a Outside double Key Reversal on the weekly chart:


This is likely to cause additional MT bullishness in price as long as next week's close remains above 1682.26

Outside Key Reversals can be very strong signals, especially on a weekly time frame:


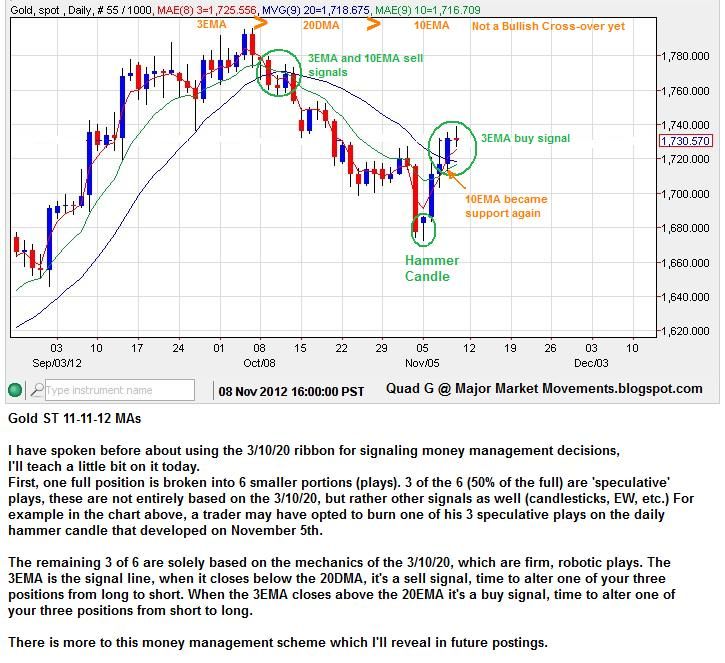
Though the week ended very bullish, the 3/10/20 ribbon has not made a bullish cross-over yet:


If PoG falls back this week, another opportunity for a speculative bid may present itself, using 1682 as an important back-stop to gauge risk.

-------------------------------------------------------------------------------------

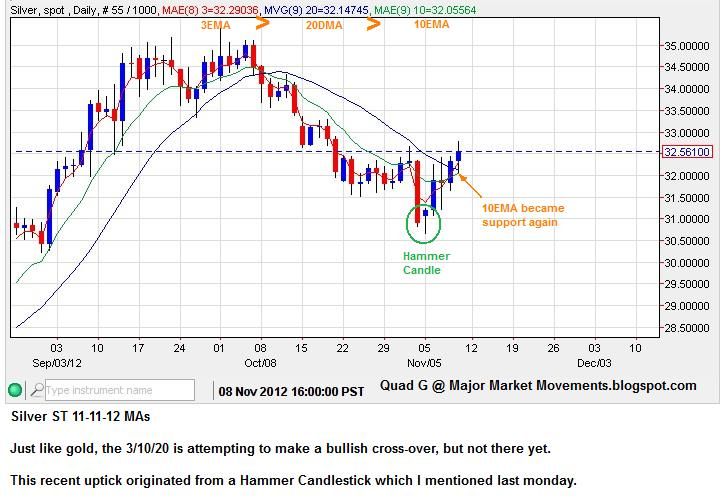
Silver - Very similar to Gold with nearly identical moves:


-------------------------------------------------------------------------------------

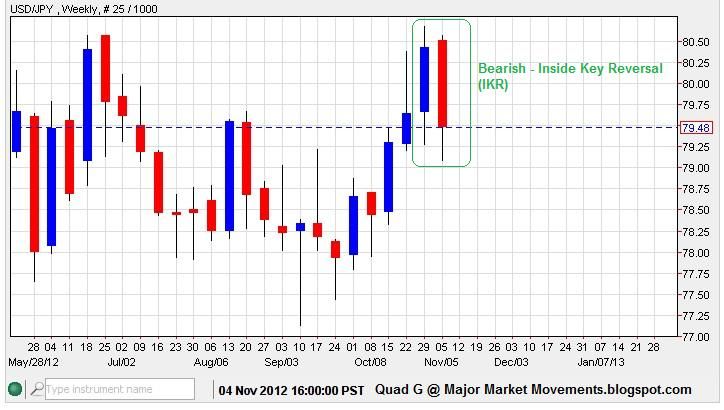
USD/JPY - Weekly and daily indicators conflict with one another. On the weekly chart an Inside Key Reversal presents a bearish picture while price is below last week's open at 80.51


An IKR is not as strong as an OKR, but is still formidable.

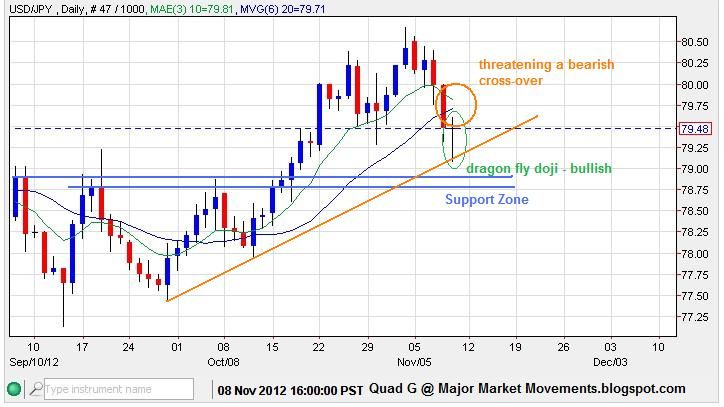
The daily chart suggests price could be back testing some key support areas. The dragon-fly doji on Friday suggests a ST bottom may be forming:


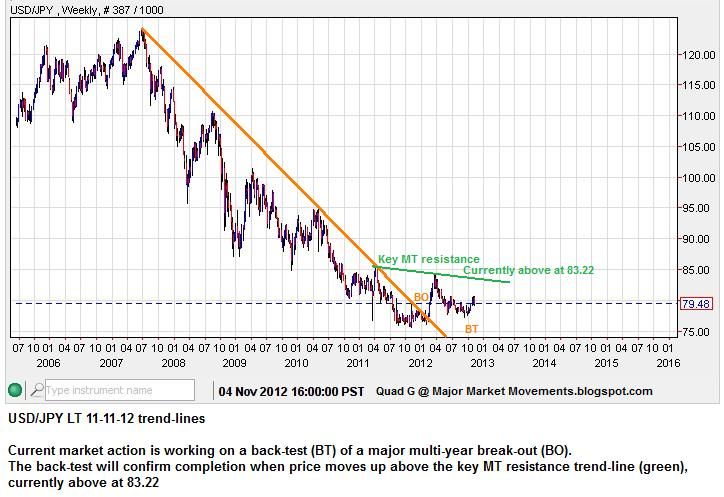
The long term picture is still in the process of forming a major bottom while price remains below key MT resistance currently above at 83.22:


-------------------------------------------------------------------------------------

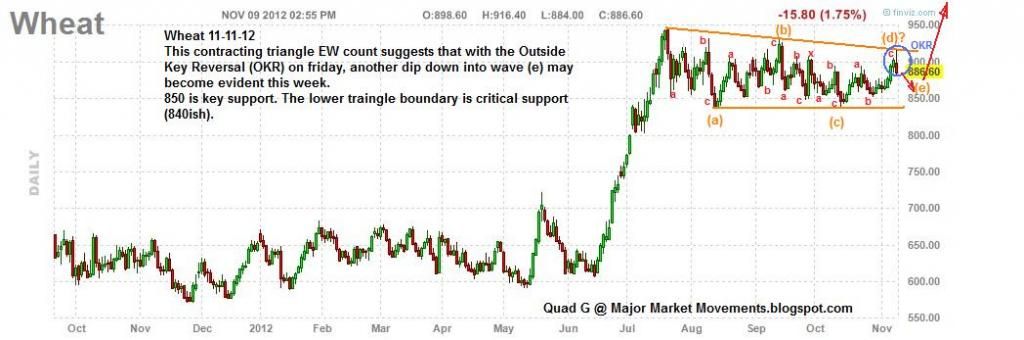
Wheat - Nearing the final stages of this multi-month correction. One more wave down may be seen this week completing the final wave (e) of a contracting triangle:


-------------------------------------------------------------------------------------

USD - At a crucial point sandwiched between key resistance at 81.20 and key support at 80.60

-------------------------------------------------------------------------------------

Ya'll have good week,
QG

Sunday, October 9, 2011

Grains - Update 10/9/11

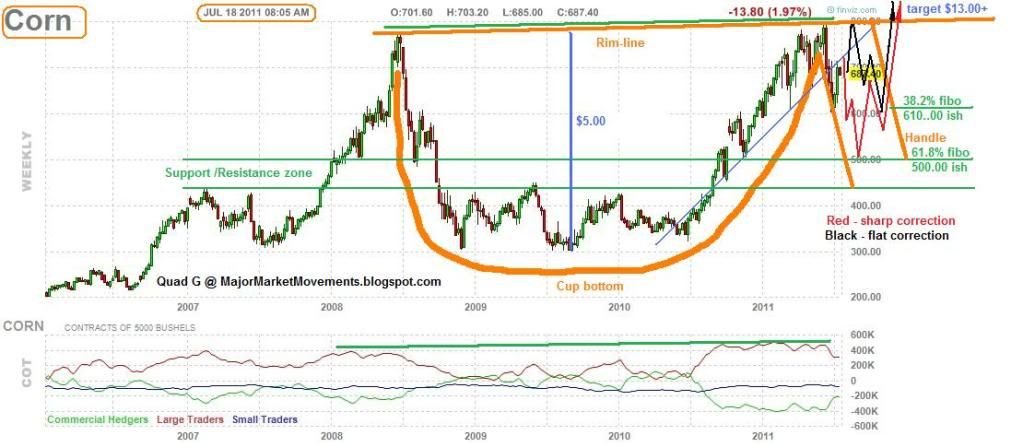
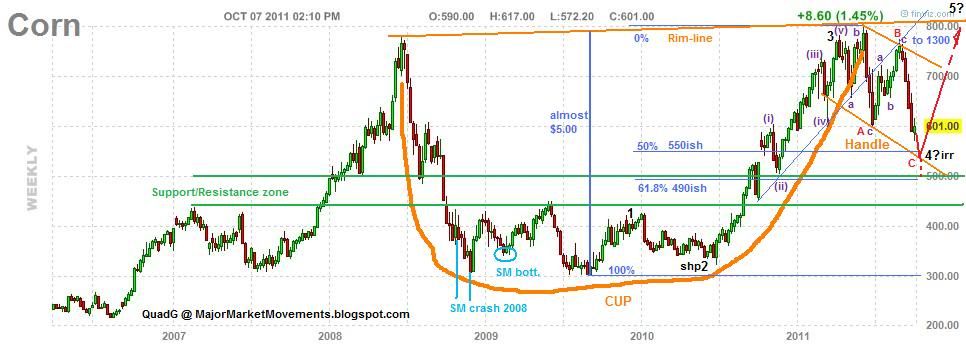
Corn - Here is the previous chart from July suggesting a handle was forming on a cup, but I didn't know what type of correction was forming or how deep, just that further weakness was likely:

(click on charts for full view)

Here is the Update:


The end of wave C red of 4 black may be finished soon near the 50% to 61.8% retrace level just above the multi-year S/R zone. If however, Corn continues to slide below the S/R zone, then this CnH pattern is likely dead.

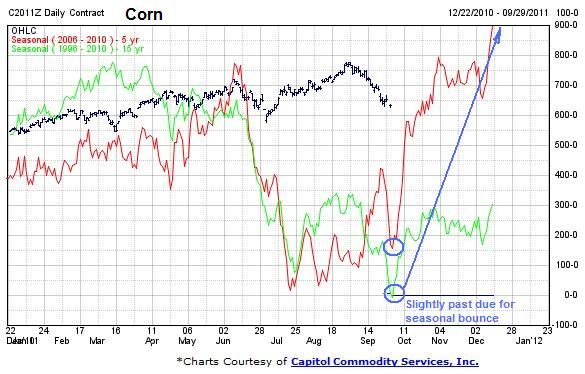
The seasonals suggest that a low is close and a bit over due:


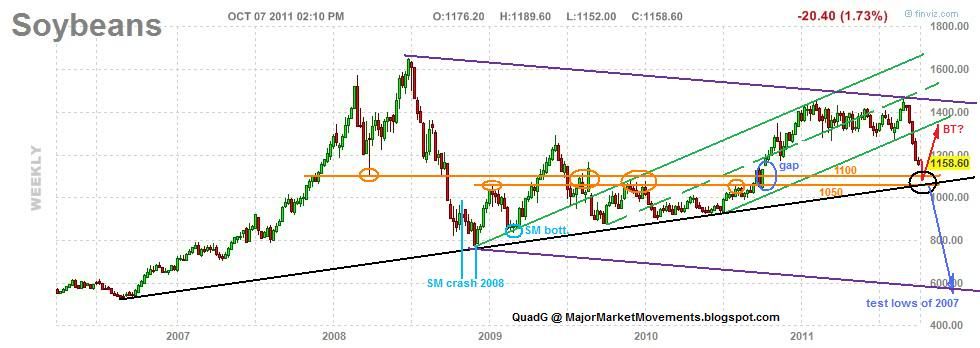
Soybeans - The recent thrust higher failed at the mid-fork of the previous up channel (green), failures at the mid-fork often suggests that the channel is likely to be broken, and it did:


A S/R zone is present between 1050 and 1100, as well as a multi-year uptrend line (black). This should lend plenty of support for at least a bounce up to back test the previous channel at a minimum. If however the black trend-line breaks (blue projection) then capitulation has likely set in and a larger C wave down to the 600s is possible.

The seasonals, like corn, suggest that a bounce is possible soon, if a bit over due:


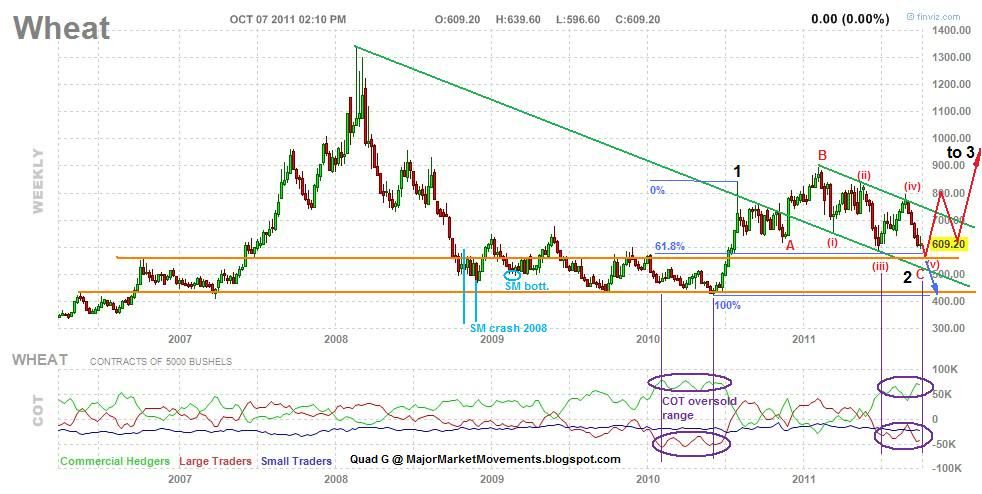
Wheat - I think the conclusion of a wave 2 black correction could be seen soon. The pattern looks like a possible 3-3-5 expanded flat. It should conclude soon above the lower-green channel line, 61.8% fibo retrace level and the support/resistance area (orange):


If this level provides support, then a bounce back up to the mid-700s to 800 seems probable, possibly the right neck of a bullish iHnS. The COT levels are entering an oversold area. If however, the price of wheat falls below the lower-green channel line (blue projection), then the 400 level is likely to be tested along with further downside if the previous green channel becomes resistance instead of support.

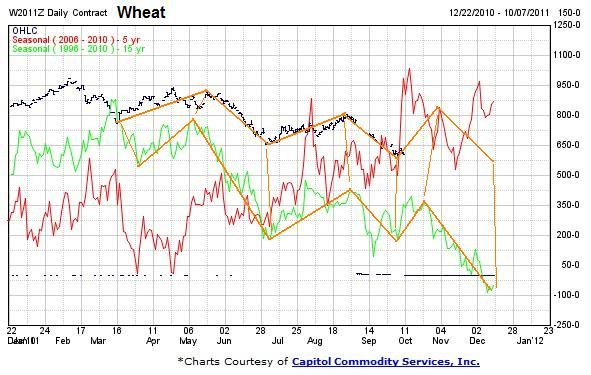
The seasonal chart suggests a minor up swing is possible soon into November, but further weakness expected into the end of the year:


Also note the pale blue areas of each chart. The bracket shows where the worst of the 2008 Stock Market (SM) dump occurred. Notice how the grains barely moved in comparison. The pale blue circle was near the end of the SM decline in March 2009, yet the grains put in higher-lows.


...