
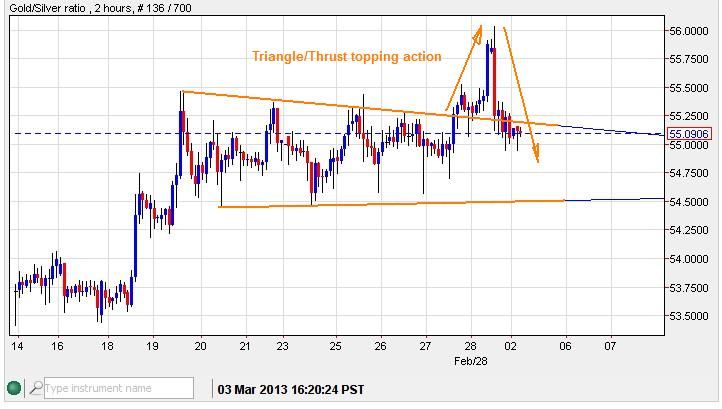
The GSR has posted another inverted hammer candle (bullish for PMs) while GSR is diverging from the price of Gold with a lower-high. Also, a Triangle/Thrust topping pattern was printed last Friday.
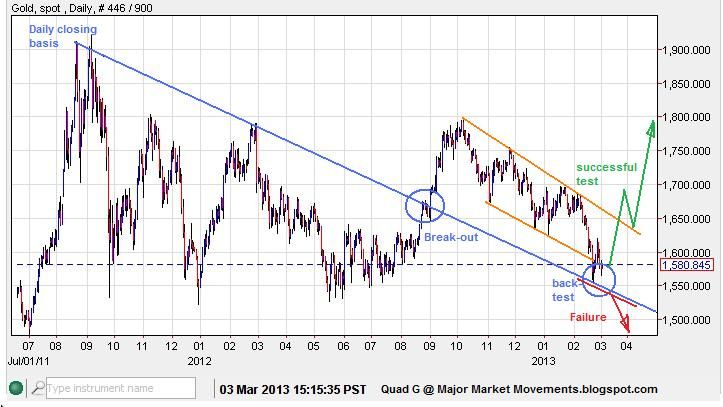
Gold has also performed a prefect back-test of the previous break-out of a trend-line formed by the daily closing highs of the past several months.
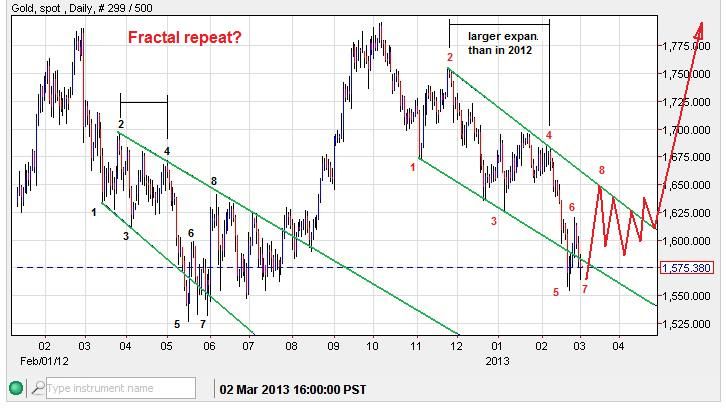
Also of interest, there is a peculiar fractal repeat that mimics much of the previous sell-off in mid- 2012:
There is plenty of technical excuse for Gold to bottom and start moving higher, a failure to do so would likely draw the price down as longs are fleeced.
--------------------------------------------------------------------------------------------------------------------------------------
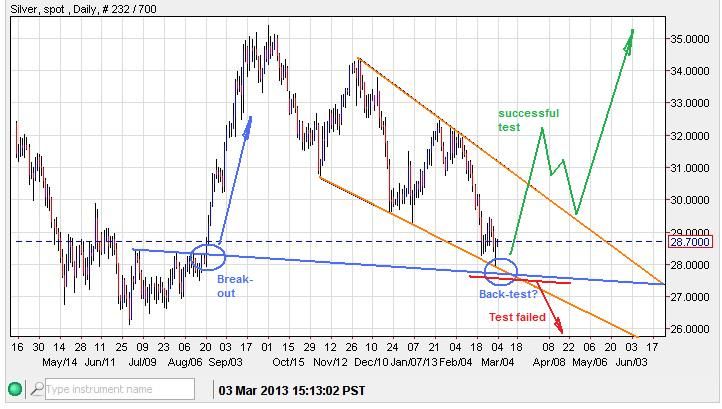
Silver - A complete EW pattern is finished to the downside, confirmed with a move above 29.47. Since the pattern is made of 3 sets of impulses, a nesting set of corrections could be pointing to an impulsive 3rd of a 3rd move to the downside, but price will need to stay below the upper trend-line. A break above it would promote the Ending Diagonal count.

Compared to the EWO (Elliot Wave Oscillator)a 5th wave +ve divergence can be seen.
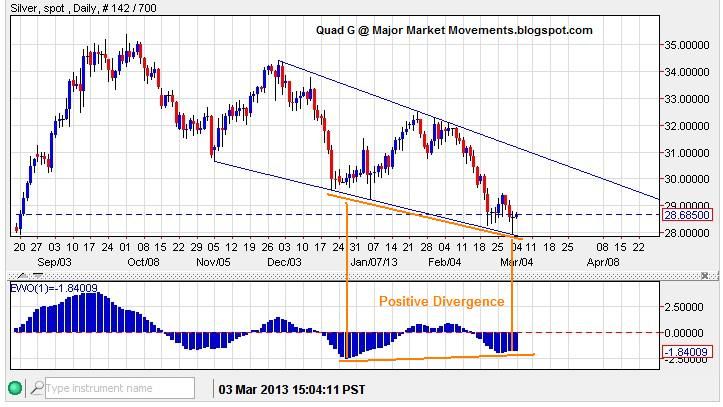
In August 19-20 of 2012 I called for a break-out with a move above 28.50, and the market delivered. However, the price took off and never gave a back-test of that significant break-out. It is not an absolute requirement that break-outs or break-downs provide a back-test, however price movement is generally more healthy when it does.
For Silver, that back-test is finally here:
--------------------------------------------------------------------------------------------------------------------------------------
USD - The second right shoulder that I have shown previously is about cooked:
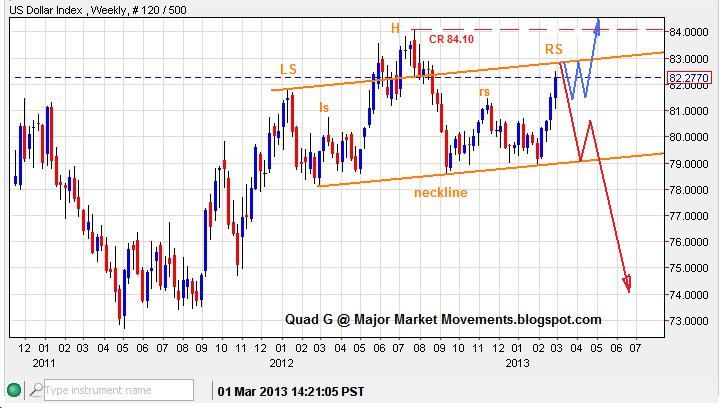
If this is the completion of the right shoulder, then price should respond with a fairly quick drop back down to the neckline.
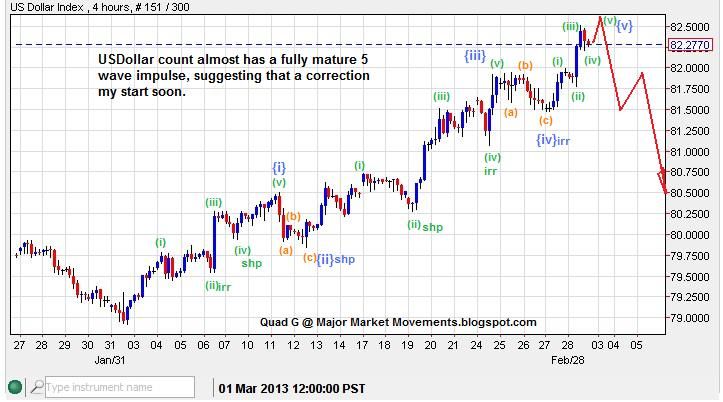
A ST EW count suggests the move is terminal with a final 5th wave up.
-------------------------------------------------------------------------------------------------------------------------------------
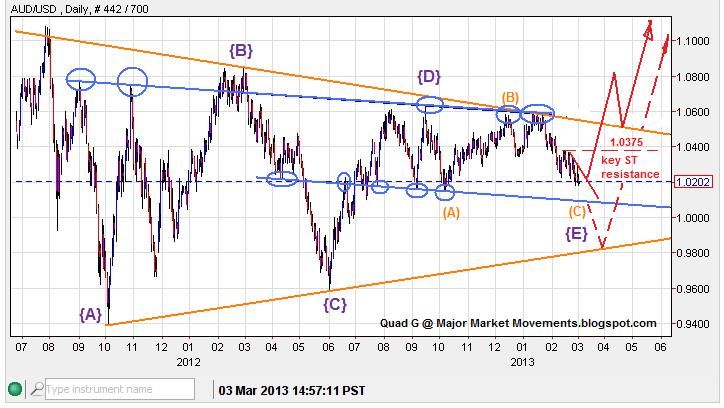
AUD/USD - The triangle pattern that I have been chasing could be completed soon as wave {E} could be finished with a move above 1.0375
-------------------------------------------------------------------------------------------------------------------------------------
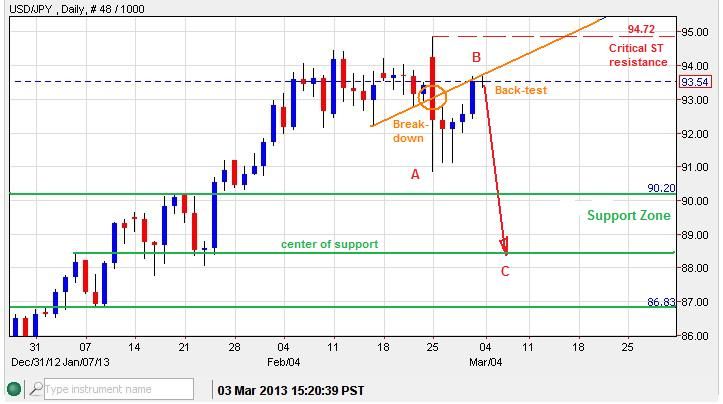
USD/JPY - Subscribers were warned of a possible top due to a triangle/top pattern that popped and reversed very suddenly. Now price is back-testing the break-down, possibly as a wave B bounce, followed by wave C down. But price will need to keep below 94.72
------------------------------------------------------------------------------------------------------------------------------------
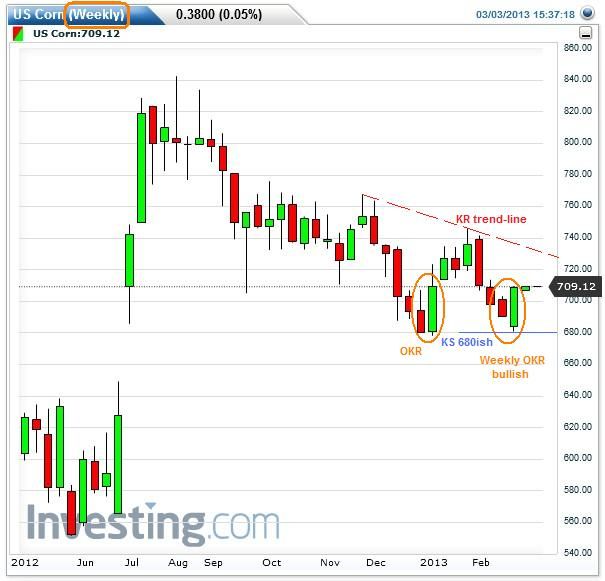
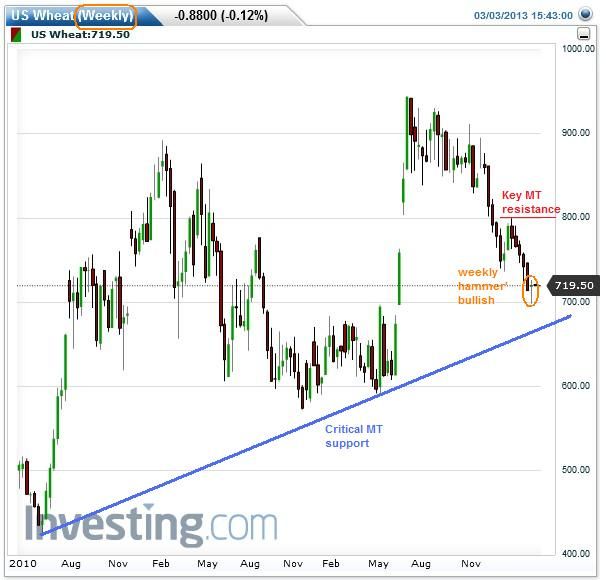
Corn and Wheat - Both have posted reversal candles on the weekly chart, suggesting buyers are taking interest again at these levels.
-----------------------------------------------------------------------------------------------------------------------------------
This week is set up for some exciting moves, keep frosty.
Quad G
If you are interested in receiving daily email updates concerning the QG3 and other 'Major Market Movements', sign up here:
http://majormarketmovements.blogspot.com/p/mmm-market-signal.html