Gold - Continued to head up into a New Moon this weekend. As well as creeping further toward a key resistance zone of 1645 to 1660. I think there is good possibility that a turn in PoG is close and could head lower into a correction for a couple weeks, up to 8 to 12% pull-back. However, if PoG closes above 1660 on the daily, the potential for a correction is far less likely. Key support is still at the 10 EMA, which has supported gold's advance since the last New Moon low at the beginning of July. The 10 EMA is currently at 1605, a daily close below this level is often a sell signal. A weekly close below 1615 is also a bearish signal.
Silver - touched a key supporting trend-line at 39.25ish on Friday. There was also a bearish divergence with the price of gold, often a bearish sign. Moving below 39.25ish on Monday and closing the day below 39.66 would be bearish. Keeping above 39.25 and moving above 41.44 would continue the current uptrend toward 43+. The GSR is ready for a {c} leg up toward resistance at 46 to 50ish. Such an advance would likely cause silver to drop strongly toward support at 34, and possibly lower. Chart update on GSR tomorrow AM.
Copper - Many news stories, about copper thefts. Same rash of stories came to light at the last major top in 2008. This falls in line with my assertion that a wave 5 top is in play, such stories are a sign of mania, and manias propel 5th waves. More upside toward 5.00+ is expected, with 4.20 being key support.
Cotton - Has moved down to LT support zone between 80 and 95. A bounce from this zone could see cotton rise back up to 140 to 170 in the months ahead. A seasonal low is common in late August/ early Sept.
S&P 500 (SPX) - May have completed a bullish triangle on Friday. Keeping above the 200DMA on a daily closing basis, SPX could mount another rally into a final 5th wave, retesting the previous top at 1370+. For more EW info check out Daneric's blog at http://danericselliottwaves.blogspot.com/
Good Hunting.
...
Sunday, July 31, 2011
30 Year Bond - Moving Up Into Strong Resistance
The 30 year treasury bond has breached key resistance at 127, this opens a shot up to the next resistance at 128.50 to 130.50:
MT chart update:
(click chart for full view)

A cluster of resistance exists between 128.50 and 130.50 (black box). It includes a gap, the 61.8% fibo retrace level, trend-lines and horizontal support/resistance zone. This would be the next best place for wave 2 black to end as a sharp correction and then start heading down into a 3rd wave decline with initial target of 108 to 110, but eventual target down into the 80s or lower.
If 130.50 is breached to the upside, then last ditch resistance for wave 2 is likely at a multi-year descending trend-line above at approx. 134ish. beyond that point, resistance thins out, and wave 2 black is in jeopardy, becoming far less likely to produce a turn down into wave 3.
The long term count from Jan. 2011:
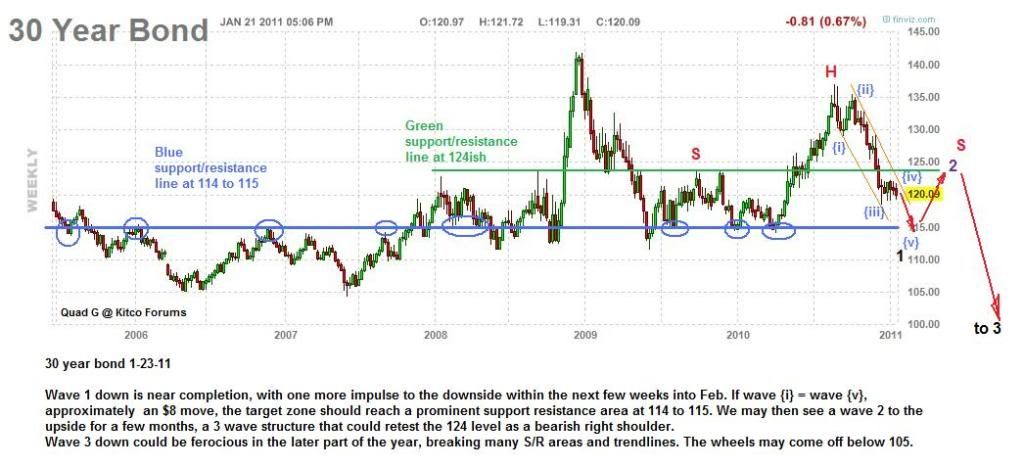
Once 105 is taken out, the bond market slide may accelerate.
In A Nut Shell:
The US 30 year bond hit a major 30 year cycle top in 2010 and has since created what appears to be a clear, well defined stand alone 5 wave impulse down. After wave 2 black is finished preferably below 130.50, another impulse down (wave 3 black), will most likely be larger and quicker than wave 1 black. These initial wave structures should be all part of a very long term 30 year cycle to the downside. Interest rates (yield) is likely to climb into the double digits, progressing forward into the next 3 decades.
Fundamentally the reasons for a long term bond market slide are numerous. One of the principle movers is likely the retirement of the baby boomers, starting en masse this year and the next. What has generated the bond market appreciation over the last 30 years is likely the same force that will unwind it. Baby boomer nest eggs have a large stake in the long term bond market. As BBs proceed into retirement needing to draw upon those retirement savings for income, the bond market is likely to see precipitous selling for many years to come.
Please understand that this is my interpretation of the market technicals and fundamentals. I have been wrong before and can be wrong again. Please do your own due diligence.
...
MT chart update:
(click chart for full view)
A cluster of resistance exists between 128.50 and 130.50 (black box). It includes a gap, the 61.8% fibo retrace level, trend-lines and horizontal support/resistance zone. This would be the next best place for wave 2 black to end as a sharp correction and then start heading down into a 3rd wave decline with initial target of 108 to 110, but eventual target down into the 80s or lower.
If 130.50 is breached to the upside, then last ditch resistance for wave 2 is likely at a multi-year descending trend-line above at approx. 134ish. beyond that point, resistance thins out, and wave 2 black is in jeopardy, becoming far less likely to produce a turn down into wave 3.
The long term count from Jan. 2011:
Once 105 is taken out, the bond market slide may accelerate.
In A Nut Shell:
The US 30 year bond hit a major 30 year cycle top in 2010 and has since created what appears to be a clear, well defined stand alone 5 wave impulse down. After wave 2 black is finished preferably below 130.50, another impulse down (wave 3 black), will most likely be larger and quicker than wave 1 black. These initial wave structures should be all part of a very long term 30 year cycle to the downside. Interest rates (yield) is likely to climb into the double digits, progressing forward into the next 3 decades.
Fundamentally the reasons for a long term bond market slide are numerous. One of the principle movers is likely the retirement of the baby boomers, starting en masse this year and the next. What has generated the bond market appreciation over the last 30 years is likely the same force that will unwind it. Baby boomer nest eggs have a large stake in the long term bond market. As BBs proceed into retirement needing to draw upon those retirement savings for income, the bond market is likely to see precipitous selling for many years to come.
Please understand that this is my interpretation of the market technicals and fundamentals. I have been wrong before and can be wrong again. Please do your own due diligence.
...
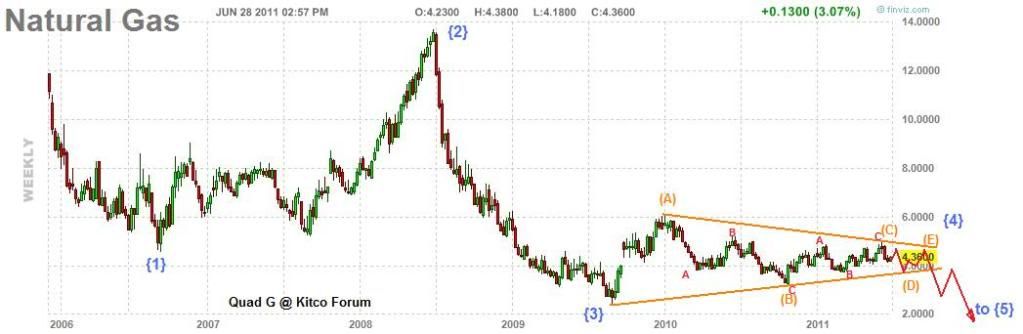
Natural Gas - Still Inside A Long Term Triangle
From an Elliot Wave perspective, the big long term picture for natural gas may look something like this:
LT chart from last May:
(click on chart for full view)

LT chart update from late June:
Current MT EW interpretation:

As the chart in late June suggested, natgas may be working on wave (D)orange down to the lower triangle boundary at 3.80ish. If this boundary is broken the triangle pattern is not killed, but has taken on an abnormality. The triangle would not officially die until the extreme of wave (B) was taken out (3.25ish). If natgas does take out the lower boundary (red dashed), an attempt may be made to fill the large gap left in Oct. 2010.
Seasonal chart:
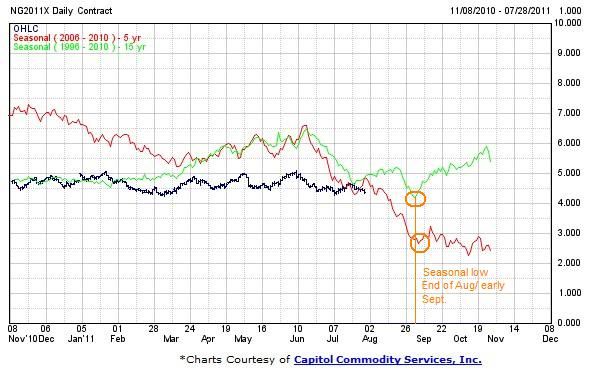
Wave (D) might finish near the seasonal low in late August/ Early September and then move higher into wave (E) of {4} as winter demand starts to pick up.
4.60 to 4.65 is the critical resistance for this projection. If that level is breached before the price of natgas moves below 4.07 toward 3.80ish, then this MT interpretation is incorrect. However, the long term triangle count is still valid until the top of wave (C) is broken above 5.00
In A Nut Shell:
Natgas appears to be continuing inside a choppy sideways pattern, oscillating between 4.65 and 3.80 for the next few weeks, perhaps moving down toward a seasonal low in late August/early September. There is an outside chance a large gap may be filled at 3.40ish
...
LT chart from last May:
(click on chart for full view)
LT chart update from late June:
Current MT EW interpretation:
As the chart in late June suggested, natgas may be working on wave (D)orange down to the lower triangle boundary at 3.80ish. If this boundary is broken the triangle pattern is not killed, but has taken on an abnormality. The triangle would not officially die until the extreme of wave (B) was taken out (3.25ish). If natgas does take out the lower boundary (red dashed), an attempt may be made to fill the large gap left in Oct. 2010.
Seasonal chart:
Wave (D) might finish near the seasonal low in late August/ Early September and then move higher into wave (E) of {4} as winter demand starts to pick up.
4.60 to 4.65 is the critical resistance for this projection. If that level is breached before the price of natgas moves below 4.07 toward 3.80ish, then this MT interpretation is incorrect. However, the long term triangle count is still valid until the top of wave (C) is broken above 5.00
In A Nut Shell:
Natgas appears to be continuing inside a choppy sideways pattern, oscillating between 4.65 and 3.80 for the next few weeks, perhaps moving down toward a seasonal low in late August/early September. There is an outside chance a large gap may be filled at 3.40ish
...
Thursday, July 28, 2011
Major Market Movements - Custom Calendar
A custom market/trading calendar is now available at the bottom of the blog's home page. Click or scroll to the bottom of the MMM home page to see the calendar.
The monthly view:
(click on imgage for full view)

Agenda view:
(click on image for full view)

A weekly view is also available. The MMM calendar is a collection of turn dates, option expiration dates, future expiration dates (Last Trading Day), economic data and info, Moon Phase dates, US holidays and more.
New information on turn dates or other note worthy dates will be updated periodically.
If you have any dates that you think would make a worth while addition to the MMM calendar please email me your suggestions at quadg.mmm@gmail.com
BTW, A major Bradley turn date is set for tomorrow July 29th to July 30th. The last major Bradley turn date, last Feb 17th, ended a strong trend in the stock market, beginning a multi-month sideways correction.
There is also a New Moon on this Saturday night. The last NM, triggered a surge in Gold price. With current price trending up into the NM, a turn may cause a downside move.
...
The monthly view:
(click on imgage for full view)
Agenda view:
(click on image for full view)
A weekly view is also available. The MMM calendar is a collection of turn dates, option expiration dates, future expiration dates (Last Trading Day), economic data and info, Moon Phase dates, US holidays and more.
New information on turn dates or other note worthy dates will be updated periodically.
If you have any dates that you think would make a worth while addition to the MMM calendar please email me your suggestions at quadg.mmm@gmail.com
BTW, A major Bradley turn date is set for tomorrow July 29th to July 30th. The last major Bradley turn date, last Feb 17th, ended a strong trend in the stock market, beginning a multi-month sideways correction.
There is also a New Moon on this Saturday night. The last NM, triggered a surge in Gold price. With current price trending up into the NM, a turn may cause a downside move.
...
Ceilings, Defaults and Precious Metals
The big question that is circulating through the PM minded blogosphere is: 'What will happen to the price of gold and silver if the US debt ceiling is raised along with spending cuts?'
In my humble opinion, if a bill is signed into law containing provisions for a 2 trillion dollar ceiling increase along with 2 trillion dollars in spending cuts over 10 years, I think the metals will at first react negatively, but shortly there after trend positively. Let me explain why I think so.
First, such a budget deal is small potatoes, effectively kicking the can down the road, punting the football and other euphemisms. Spending cuts of 2 trillion dollars over 10 years equates to only 200 billion a year. I wouldn't be surprised to learn that the entire federal government spends the same amount in toilet paper each year ( real toilet paper, not the less comfortable green-backs). Now I would prefer that government employees still use toilet paper, don't get me wrong, that could be a messy and disturbing situation, they will have to cut else where. Raising the debt ceiling is inflationary (upfront), cutting spending over 10 years is deflationary over time. Giving the FED another 2 trillion to play with would likely pump cash into the system rather quickly in comparison.
Metals have two modes, especially gold. One mode functions as a hedge against Systemic Financial Upheaval (SFU), such as default. The other mode functions as a hedge against the printing of fiat. Both have helped propel the price of gold to the heights we see today. However, these modes can often be at odds with each other for shorts periods. There is a certain contingent of the gold market that buys to hedge against systemic financial upheaval, there is another group that buys to protect against inflation, while yet others are holding 'long and strong' seeing the greater picture.
If and when a budget deal is passed, it will likely be heralded as a 'Historic bill, saving the US financial system from collapse'. You can't see this, but my eyes are about to pop out of my head because they are rolling so hard. None the less, the 'system' will seemingly get a reprieve, and the specter of systemic financial upheaval will be put to rest for a time. This may cause those interested in PMs for that reason to sell their positions in the short term, causing the price of gold to sink temporarily. For you see, another 2 trillion dollars will be available to Timmy G and Benny too. I fully suspect in the days following into August, perhaps at the base of the Grand Teton mountains, in a town with the appropriate last name of 'Hole', the long anticipated QEIII will be born into existence, another opportunity for the markets to suckle off the greatest of nanny states. Look up the meaning of 'Teton', coincidence?......I think not.
Such events should spur the inflation minded buyers of PMs into action, as likely hundreds of billions of more toilet paper is printed ( the more uncomfortable green-back version). Though PMs may drop a bit transitioning from SFU to QEIII, I suspect that such a dip will present only a very nice buying opportunity.
...
Wednesday, July 27, 2011
USD - One Last Move Up
Watching the USD (United States Dollar index), I am still working off this older LT count:
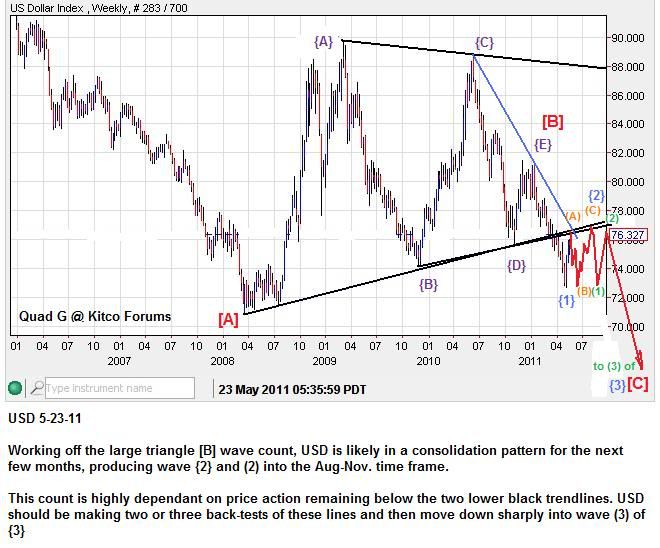
I am basically looking for the completion of this choppy corrective move and resumption of the larger downtrend into wave {3} Blue.
My Previous count was anticipating a little further upside as an ending diagonal into August. However, Key Support (KS) was broken at 74.13, killing the ending diagonal interpretation:
With USD falling below that key support, other interpretations have come into focus.
If USD stays within the Bear Flag (orange channel lines) And Wave (C) = Wave (A) in both price and time, we could see one last surge for USD higher toward 77ish, near Aug 15th. Also very close to my Fibo turn date in Gold near Aug. 18th. This interpretation will likely fail to the downside if USD continues to tumble in the near term below the lower orange channel line.
A fellow Elliotician, Silverrex , a member of Kitco and frequent poster on my thread there, has suggested another credible count:
(click chart for full view)
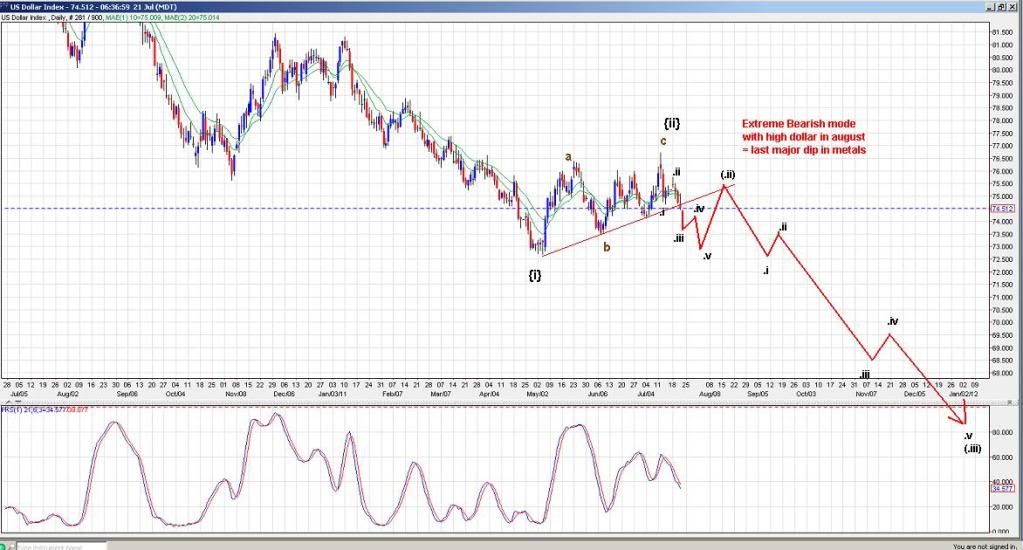
This count would suggest that wave {2} blue is cooked and the descent into wave {3} has began. The 5 wave move down that he anticipated would be counted as a wave (.i) and is near complete. Soon a small wave (.ii) pull-back should be a choppy 3 wave move higher, likely keeping below the red trend-line.
In either case, the next upward move should be terminal, with a strong 3rd wave down to follow, if our interpretations are correct. As previously stated in the ending diagonal chart, any move in USD above 78.00 is likely to put larger downtrend in jeopardy.
Also note the weekly chart:
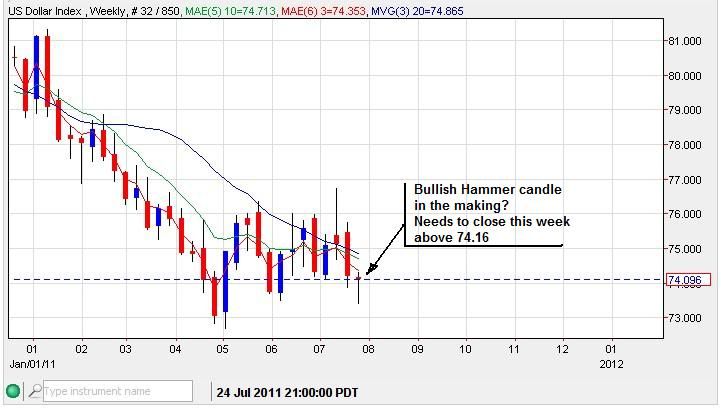
If USD close this week on Friday above 74.16, a bullish Hammer candle would be printed, suggesting a bounce is possible into next week.
In A Nut Shell:
USD may have one more move higher in the short term, likely completing inside 15 trading days and below 77.00. Then a strong move down into wave {3} could easily take the index to 68.00 for starters. The move to the downside is likely in trouble if USD instead moves above 78.00.
Here is the very long term chart and wave count that I prefer at this time. This is old from Dec '10 and needs and update. Basically we are about to finish wave {2} blue and head down into wave {3} blue. 70.80 will likely be the 'Point of Recognition' as the bull count would officially die crossing that level to the downside. This bear count suggest an eventual target in the 50s:

...
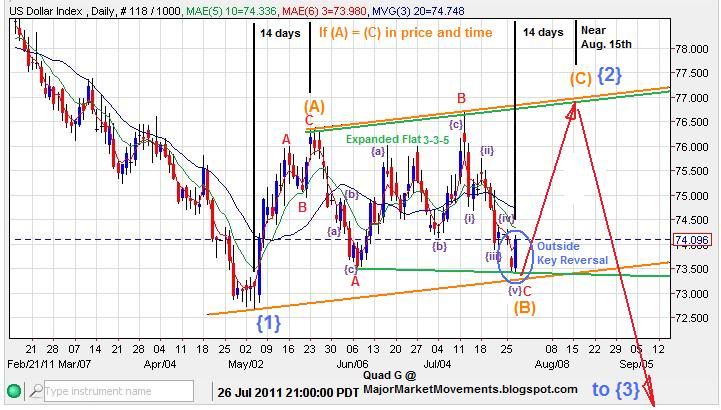
I am basically looking for the completion of this choppy corrective move and resumption of the larger downtrend into wave {3} Blue.
My Previous count was anticipating a little further upside as an ending diagonal into August. However, Key Support (KS) was broken at 74.13, killing the ending diagonal interpretation:
With USD falling below that key support, other interpretations have come into focus.
If USD stays within the Bear Flag (orange channel lines) And Wave (C) = Wave (A) in both price and time, we could see one last surge for USD higher toward 77ish, near Aug 15th. Also very close to my Fibo turn date in Gold near Aug. 18th. This interpretation will likely fail to the downside if USD continues to tumble in the near term below the lower orange channel line.
A fellow Elliotician, Silverrex , a member of Kitco and frequent poster on my thread there, has suggested another credible count:
(click chart for full view)
This count would suggest that wave {2} blue is cooked and the descent into wave {3} has began. The 5 wave move down that he anticipated would be counted as a wave (.i) and is near complete. Soon a small wave (.ii) pull-back should be a choppy 3 wave move higher, likely keeping below the red trend-line.
In either case, the next upward move should be terminal, with a strong 3rd wave down to follow, if our interpretations are correct. As previously stated in the ending diagonal chart, any move in USD above 78.00 is likely to put larger downtrend in jeopardy.
Also note the weekly chart:
If USD close this week on Friday above 74.16, a bullish Hammer candle would be printed, suggesting a bounce is possible into next week.
In A Nut Shell:
USD may have one more move higher in the short term, likely completing inside 15 trading days and below 77.00. Then a strong move down into wave {3} could easily take the index to 68.00 for starters. The move to the downside is likely in trouble if USD instead moves above 78.00.
Here is the very long term chart and wave count that I prefer at this time. This is old from Dec '10 and needs and update. Basically we are about to finish wave {2} blue and head down into wave {3} blue. 70.80 will likely be the 'Point of Recognition' as the bull count would officially die crossing that level to the downside. This bear count suggest an eventual target in the 50s:
...
Tuesday, July 26, 2011
Gold - A Non-Preferred Bull Count
I have seen this count or similar counts with small variations from a few other Ellioticians. Some of my EW geek friends also ask me why I don't count the same way. Here is the count and why I don't see it the same:
This is the entire bull run from the 1999 bottom:
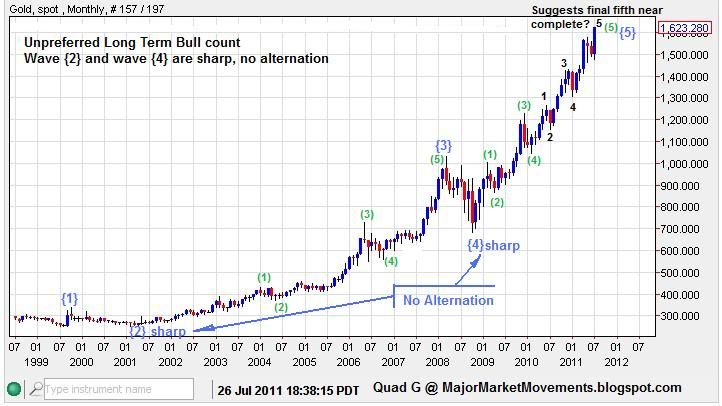
Some Ellioticians see the 2008 low in Gold as the end of wave {4} blue. Yes indeed it is the end of a major bottom, however, counted this way leaves the count without alternation of waves {2} and {4} which both appear sharp in attitude.
Taking a closer look I see more problems with this count:
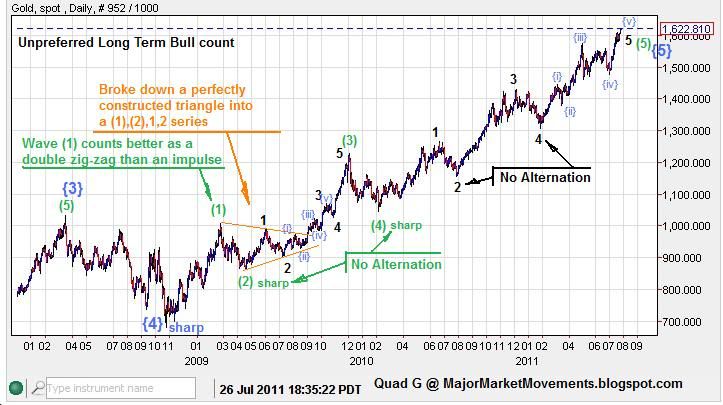
What is commonly counted as wave (1) green, counts better as a wave (B) double-zig-zag, IMHO. Also, a perfectly good triangle is often ignored and chopped into a series of 1s and 2s. And further counting up the line often pays little attention to alternation.
As you can see, this count suggest that a final 5th wave, 5 of (5) of {5}, is done or about done. Such a count could point to a very great drop in the order of 25 to 38%. From today's highs that would target a range of 1218 to 1007 respectively. Every count is based on subjective interpretations, and every Elliotician is entitled to their opinion.
This count could be right, but I prefer another:
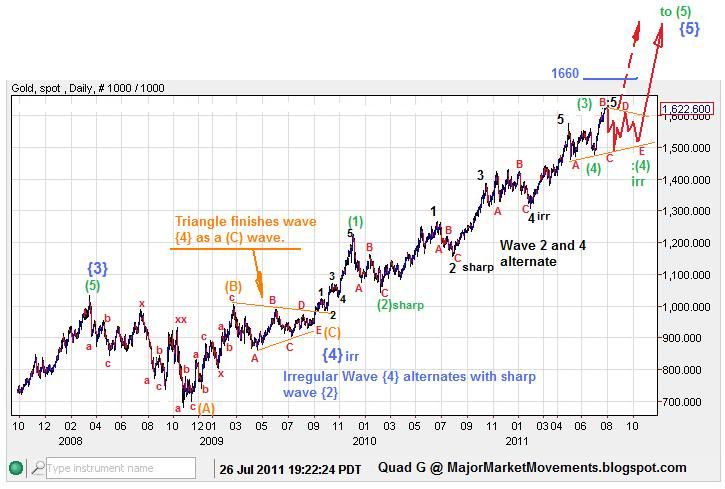
This interpretation eliminates the problems associated with the other count.
-- Wave {4} blue becomes an irregular flat, alternating with wave {2} blue.
-- The previous wave (1) green becomes a corrective wave (B) orange.
-- The triangle is counted better as an ABCDE correction to finish wave (C) of {4}.
-- Alternation is respected in subsequent counts up the chain.
-- Since wave (1) is counted off the end of the triangle (941ish), this leaves room in the count for at least one more 5th wave higher as wave (5) green.
There are certainly far more bullish counts than this one, I recognize that. And if those counts become clearly apparent then I will adopt them, all in due course.
Currently, I see a confluence of ST counts wrestling with the end of wave (3) green and the end of wave (4)green. 1660 should be a key level in determining which phase we are in. Keeping below suggests another 8-12% correction is possible. Moving above 1660 would likely cancel any significant near term corrections. Either way, the larger trend still should carry PoG much higher soon into wave (5) toward 2000 to 2450 in 2012.
...
This is the entire bull run from the 1999 bottom:
Some Ellioticians see the 2008 low in Gold as the end of wave {4} blue. Yes indeed it is the end of a major bottom, however, counted this way leaves the count without alternation of waves {2} and {4} which both appear sharp in attitude.
Taking a closer look I see more problems with this count:
What is commonly counted as wave (1) green, counts better as a wave (B) double-zig-zag, IMHO. Also, a perfectly good triangle is often ignored and chopped into a series of 1s and 2s. And further counting up the line often pays little attention to alternation.
As you can see, this count suggest that a final 5th wave, 5 of (5) of {5}, is done or about done. Such a count could point to a very great drop in the order of 25 to 38%. From today's highs that would target a range of 1218 to 1007 respectively. Every count is based on subjective interpretations, and every Elliotician is entitled to their opinion.
This count could be right, but I prefer another:
This interpretation eliminates the problems associated with the other count.
-- Wave {4} blue becomes an irregular flat, alternating with wave {2} blue.
-- The previous wave (1) green becomes a corrective wave (B) orange.
-- The triangle is counted better as an ABCDE correction to finish wave (C) of {4}.
-- Alternation is respected in subsequent counts up the chain.
-- Since wave (1) is counted off the end of the triangle (941ish), this leaves room in the count for at least one more 5th wave higher as wave (5) green.
There are certainly far more bullish counts than this one, I recognize that. And if those counts become clearly apparent then I will adopt them, all in due course.
Currently, I see a confluence of ST counts wrestling with the end of wave (3) green and the end of wave (4)green. 1660 should be a key level in determining which phase we are in. Keeping below suggests another 8-12% correction is possible. Moving above 1660 would likely cancel any significant near term corrections. Either way, the larger trend still should carry PoG much higher soon into wave (5) toward 2000 to 2450 in 2012.
...
Gold - MT Alert 7-26-11
Gold has reached a critical spot. Upside potentials are still present, but
conditional. I think we need to entertain this old count from last march:
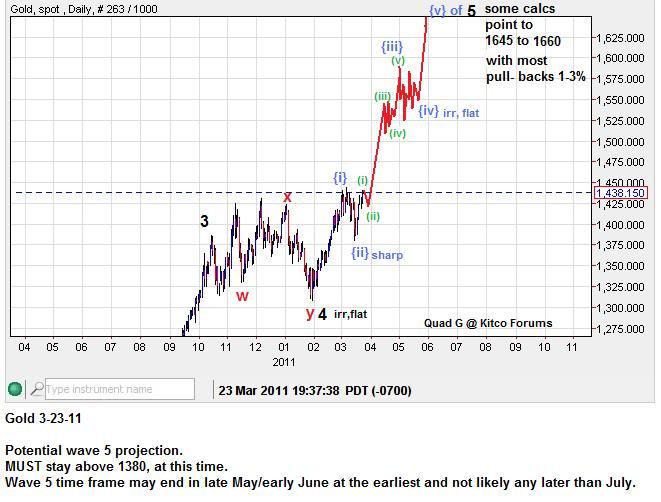
Back then I suspected an advance up to 1645 to 1660 as late as july, we are almost there. There is a way to count wave 5 black as a completed impulse.
Bottom line: if 1660 is not breached soon with great strides, a significant top could be about finished. I would recommend trailing protective stops on long positions. Especially below 1583 at this time. I can see potential 8 to 12% corrections possible, if daily closes remain under 1660.
...
conditional. I think we need to entertain this old count from last march:
Back then I suspected an advance up to 1645 to 1660 as late as july, we are almost there. There is a way to count wave 5 black as a completed impulse.
Bottom line: if 1660 is not breached soon with great strides, a significant top could be about finished. I would recommend trailing protective stops on long positions. Especially below 1583 at this time. I can see potential 8 to 12% corrections possible, if daily closes remain under 1660.
...
Monday, July 25, 2011
Silver - ST Update 7-25-11
Silver has repeatedly met my projection from the 33.37 low. Today's higher-high above 40.85, technically completes the Elliot Wave impulse pattern that I have previously outlined. However, the current 5th wave in progress can continue to extend with conditions.
Here is an older MT projection that I am working off of:
According to this projection, I was expecting an irregular correction [wave (iv) green] to set in after wave (iii) green completed under the $42 level.
The previous ST count adds more detail:
As you can see, the expectation was for the top of the previous base channel (orange) to serve as support as the impulsive wave structure continued to unfold inside an acceleration channel.
Now with today's ST update you can see how PoS met my projection:
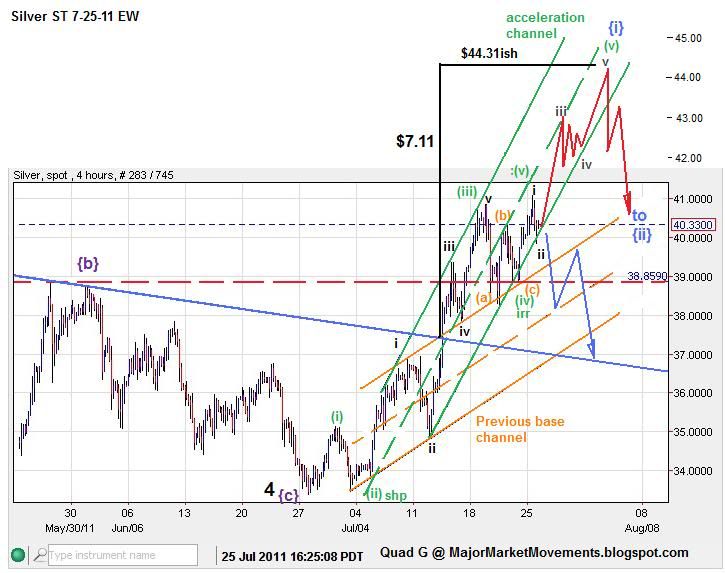
The price of silver used the top of the previous base channel (orange) as support, moved into and irregular flat correction, and has now made a higher-high into wave (v) green.
Wave (v) green of wave {i} blue fulfills the basic requirements for the prescribed impulsive structure [alt :(v)]. However, the iHnS target of 44.31, in the ST, can still be reached. In order to do so, PoS MUST stay above 38.85 (dashed red). The proceeding waves may continue up between the lower green acceleration channel line and the mid-channel line (dashed green). Often 5th waves will move up with in the space between a lower channel line and mid-channel line, a sign the impulse is beginning to tire.
Upside resistance is at the 50% fibo at 41.00ish, and the 61.8% fibo at 43ish.
If Silver moves back above the mid-channel line (green dashed) then greater impulsive behavior is possible.
I suspect that once the lower-green acceleration channel line is broken another correction phase is likely.
If 38.85 is broken before a new higher-high is made above today's high of 41.07, then wave (v) should be complete as an alternate :(v). With such a move, the blue projection would suggest that wave {ii} blue has started and could move much lower.
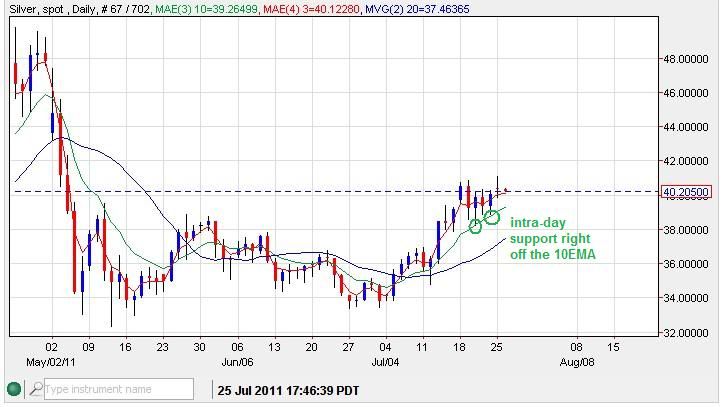
As a side note, see in this chart how the 10 EMA of my three moving average ribbon helped maintain support in this impulsive trend:
In A Nutshell:
If silver can stay above the 38.85 level, further upside is likely, aiming toward next resistance at 43.00 and the 44.31 iHnS target. However, falling below 38.85 would likely finish this impulse up from 33.37 and set into a wave {ii} correction.
I want to reiterate a warning! if silver falls impulsively down under $34, and eventually taking out 33.37, a trap door could be opened, allowing PoS to drop to sub-30.00 and potentially head down to $22.00.
...
Here is an older MT projection that I am working off of:
According to this projection, I was expecting an irregular correction [wave (iv) green] to set in after wave (iii) green completed under the $42 level.
The previous ST count adds more detail:
As you can see, the expectation was for the top of the previous base channel (orange) to serve as support as the impulsive wave structure continued to unfold inside an acceleration channel.
Now with today's ST update you can see how PoS met my projection:
The price of silver used the top of the previous base channel (orange) as support, moved into and irregular flat correction, and has now made a higher-high into wave (v) green.
Wave (v) green of wave {i} blue fulfills the basic requirements for the prescribed impulsive structure [alt :(v)]. However, the iHnS target of 44.31, in the ST, can still be reached. In order to do so, PoS MUST stay above 38.85 (dashed red). The proceeding waves may continue up between the lower green acceleration channel line and the mid-channel line (dashed green). Often 5th waves will move up with in the space between a lower channel line and mid-channel line, a sign the impulse is beginning to tire.
Upside resistance is at the 50% fibo at 41.00ish, and the 61.8% fibo at 43ish.
If Silver moves back above the mid-channel line (green dashed) then greater impulsive behavior is possible.
I suspect that once the lower-green acceleration channel line is broken another correction phase is likely.
If 38.85 is broken before a new higher-high is made above today's high of 41.07, then wave (v) should be complete as an alternate :(v). With such a move, the blue projection would suggest that wave {ii} blue has started and could move much lower.
As a side note, see in this chart how the 10 EMA of my three moving average ribbon helped maintain support in this impulsive trend:
In A Nutshell:
If silver can stay above the 38.85 level, further upside is likely, aiming toward next resistance at 43.00 and the 44.31 iHnS target. However, falling below 38.85 would likely finish this impulse up from 33.37 and set into a wave {ii} correction.
I want to reiterate a warning! if silver falls impulsively down under $34, and eventually taking out 33.37, a trap door could be opened, allowing PoS to drop to sub-30.00 and potentially head down to $22.00.
...
Sunday, July 24, 2011
MMM - Weekend Update 7/24/11
I am currently collecting data for another big article on Gold, so this weekend update will be somewhat brief.
Gold - Still under pressure while below last week's high of 1610. A move below the short term support zone 1580 to 1583 could trip a pivot, causing price to fall to 1550 to 1562, where fairly strong MT support should be found.
However, any dash above the 1610 high this week could invite a challenge of a multi-month trend-line above at approx 1650 to 1660.
Silver - working on what appears to be a wave (iv) triangle, irregular correction. Breaking out of this consolidation pattern above 40.85 should open up a run to my target near $43. Falling below 38.20 would jeopardize the run to $43 this week, and could allow price to fall back to support near $36.00
Crude - Needs to capture territory above 102.50 very soon to stay ST bullish. The pattern to the upside has become 'lazy', suggesting that further weakness below 102.50 may cause the price of crude to re-test a support/resistance zone between 93.55 and 95.85. Any impulsive move below this S/R zone would likely open up another attempt on $90ish, which is critical support for any further MT bullishness. Failure of support at $90 could allow a drop to test major long term support at $80ish.
I am not overly concerned about any weakness may come into the metals and commodities in the next few weeks. Actually a MT slide into Mid-August would be very welcome, likely presenting very nice buying opportunities at a discount.
Good Hunting.
...
Thursday, July 21, 2011
MMM - End of Day Update 7/21/11
Gold - Short term weakness is expected into the remainder of July. While price remains below 1610, downside support zone can be found in between 1555 and 1562 initially. If a low does occur in the last week of the month, another ST bounce toward Aug 8th is possible. From this high, a final major low may occur around a strong fibo turn date 8/18, +/- 1 day. If my view is correct the 8/18 low should end this corrective phase and usher on the expected wave 5 blow-off.
Silver - still appears to be working on a wave (iv) irregular correction. If a neckline of a small HnS is tripped near 38.50, a drop could target strong ST support at 36ish. The anticipated continuation of the impulsive structure depicted in my last chart, should see another strong spike higher to challenge 43+.
SPX - Turned precisely at the mentioned fibo turn date, July 18. This current thrust higher depends on key support at 1325. A failure of support at that level, tomorrow or Monday, would likely elicit continued selling to test the 200dma again for a second time (currently below at 1280 and rising). Any move below 1258 at this time could fail a bullish triangle pattern, likely tripping many sell stops, setting up ' flash crash' potential.
USD - Moved below a key supporting trend-line and is now under selling pressure while below 76.00. Moving below early junes low should confirm that this bear flag is finished and wave {3} blue is under way.
Wheat - was rejected at resistance zone between 725 and 750. Moving below 650 would likely invite another strong move lower to test long term support at 500 to 550. Such a move would likely end a major seasonal bottom, with very good potential for a strong multi-month move higher thereafter.
...
Palladium - The Other White Metal
Palladium is a very interesting metal, not only can it filter hydrogen, but it also seems to gage with amazing accuracy the various changes to the US economy.
Here is a previous chart from late June:
As I noted back then:
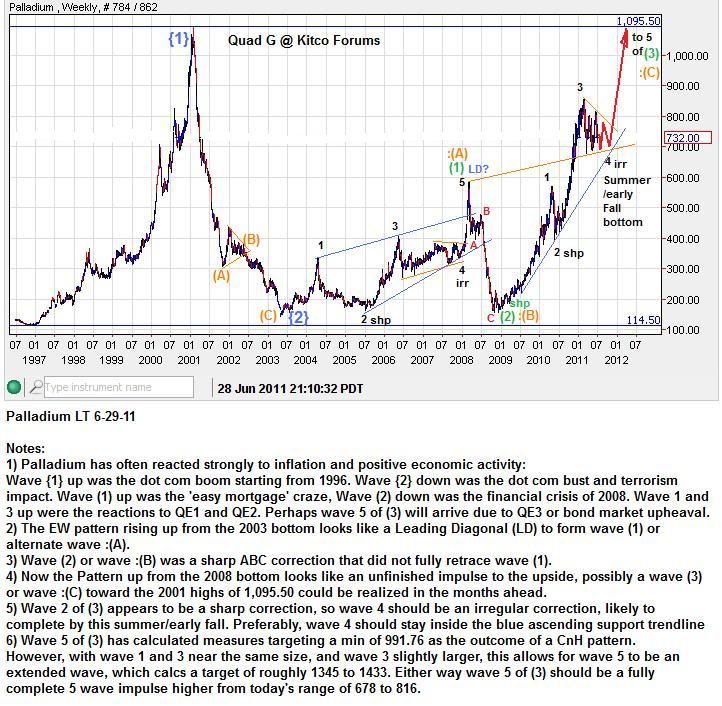
Wave {1} (blue) originated from 1996, the beginnings of the Dot Com boom and just after the Clinton era changes to the Community Reinvestment Act.
Wave {2} (blue) marked the Dot Com bust and terrorism impact.
Wave (1) (green) Followed the 'easy mortgage' craze higher.
Wave (2) (green) dropped with the 2008 financial crisis.
Wave 1 and 3 of wave (3) clearly react to QE1 and QE2.
Wave 2 (black) coincided with the 2010 'flash crash'
Now at wave 4, an irregular correction, appears to fall in line with the indecision over the US debt ceiling.
Anticipating another advance up soon into wave 5 to test the all time high of 1095.50, perhaps the resolution to the Debt ceiling issue will usher in QE3 or a Bond market collapse/ or both. What ever happens, Palladium appears to be a steady meter of such events.
Here is an update for July 21st:
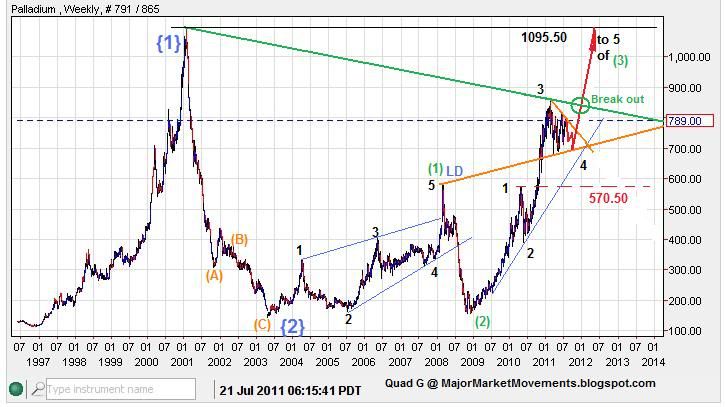
Wave 4 of (3) is still in it's irregular correction, However upon breaking out above the foremost descending multi-year trend-line (green), I suspect that wave 5 higher will be underway. This interpretation is in jeopardy if the blue supporting trend-line is broken (currently below at 625). This interpretation is incorrect (killed) if price falls below the level of wave 1 (570.50). This would cause an Elliot Wave rule violation called an over-lap, 4th waves are not allowed to enter the price territory of the previous 1st wave.
...
Here is a previous chart from late June:
As I noted back then:
Wave {1} (blue) originated from 1996, the beginnings of the Dot Com boom and just after the Clinton era changes to the Community Reinvestment Act.
Wave {2} (blue) marked the Dot Com bust and terrorism impact.
Wave (1) (green) Followed the 'easy mortgage' craze higher.
Wave (2) (green) dropped with the 2008 financial crisis.
Wave 1 and 3 of wave (3) clearly react to QE1 and QE2.
Wave 2 (black) coincided with the 2010 'flash crash'
Now at wave 4, an irregular correction, appears to fall in line with the indecision over the US debt ceiling.
Anticipating another advance up soon into wave 5 to test the all time high of 1095.50, perhaps the resolution to the Debt ceiling issue will usher in QE3 or a Bond market collapse/ or both. What ever happens, Palladium appears to be a steady meter of such events.
Here is an update for July 21st:
Wave 4 of (3) is still in it's irregular correction, However upon breaking out above the foremost descending multi-year trend-line (green), I suspect that wave 5 higher will be underway. This interpretation is in jeopardy if the blue supporting trend-line is broken (currently below at 625). This interpretation is incorrect (killed) if price falls below the level of wave 1 (570.50). This would cause an Elliot Wave rule violation called an over-lap, 4th waves are not allowed to enter the price territory of the previous 1st wave.
...
Wednesday, July 20, 2011
HUI - Attitude is Everything
In a recent HUI article I suggested a bounce was likely back up to 560 to 585 from a perceived neckline.
Article Here:
The HUI's Head and Shoulders
Previous chart:
(click on chart for full view)
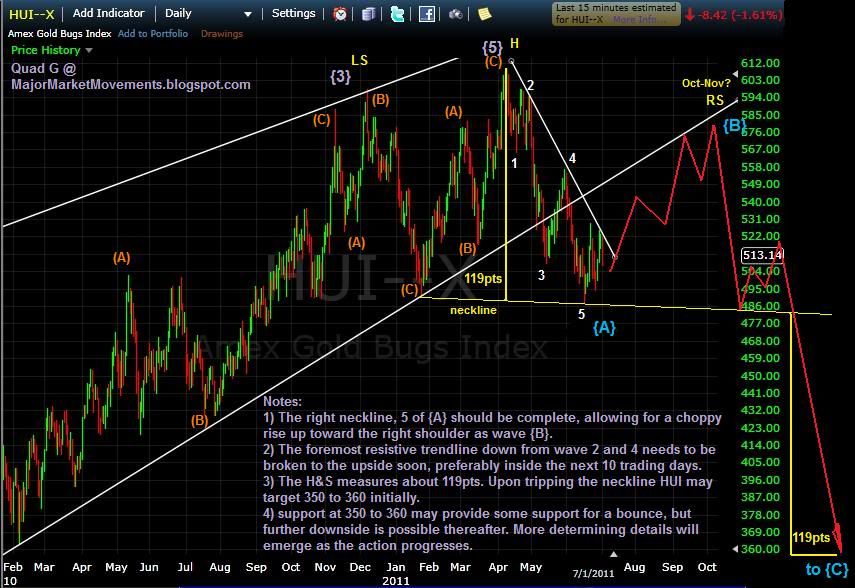
The call for a higher move to 560 to 585 was correct, however, the expectation was for the 560 to 585 target window to be entered with a slow choppy rise for several weeks, depicting a corrective attitude. Instead, the strong move off the neckline, with impulsive attitude, back above the lower white trend-line suggests a potential change in my outlook.
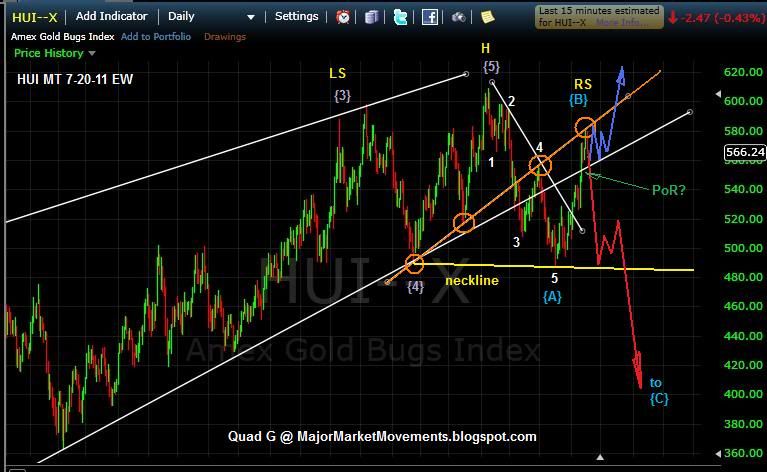
The impulsive attitude may have created a Point of Recognition (PoR) when moving back above the lower white trend-line. So far only 3 waves up are realized, but a small period of consolidation between the orange trend-line (current resistance) and the previous white trend-line (blue projection) may allow for another thrust higher to test the previous highs above 610. Such a move would kill the bearish Head and shoulder pattern and bearish multi-year ending diagonal. That is much to ask from one small wave, we'll see what can be accomplished in the few days ahead.
The red projection and right shoulder scenario should see HUI rejected quickly off the orange trend-line as a second back-test. Then fall sharply down to the neckline or lower.
...
Article Here:
The HUI's Head and Shoulders
Previous chart:
(click on chart for full view)
The call for a higher move to 560 to 585 was correct, however, the expectation was for the 560 to 585 target window to be entered with a slow choppy rise for several weeks, depicting a corrective attitude. Instead, the strong move off the neckline, with impulsive attitude, back above the lower white trend-line suggests a potential change in my outlook.
The impulsive attitude may have created a Point of Recognition (PoR) when moving back above the lower white trend-line. So far only 3 waves up are realized, but a small period of consolidation between the orange trend-line (current resistance) and the previous white trend-line (blue projection) may allow for another thrust higher to test the previous highs above 610. Such a move would kill the bearish Head and shoulder pattern and bearish multi-year ending diagonal. That is much to ask from one small wave, we'll see what can be accomplished in the few days ahead.
The red projection and right shoulder scenario should see HUI rejected quickly off the orange trend-line as a second back-test. Then fall sharply down to the neckline or lower.
...
Tuesday, July 19, 2011
Gold-AUD LT - Aussie Gold, about to go Up-Over
The Price of Gold in AUD (Australian Dollar) is nearing the end of a long term consolidation period in the form of a triangle. There may be many things 'Down-Under' in Australia, but Aussie Gold is about to go 'Up-Over'.
Here is the previous projection calling for a climb out of a major bottom at the end of wave (C), up into wave (D) to finish a 3 wave move higher (ABC):
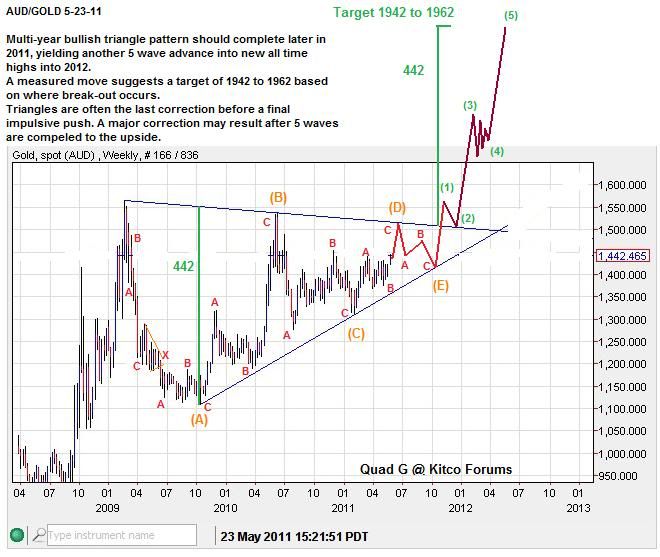
This is a current update showing a possibly completed Wave (D):
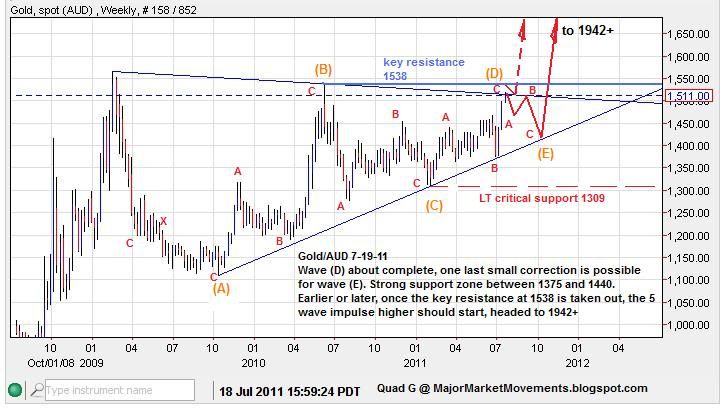
1538 is key resistance, 3 waves down to form wave (E) is expected, but price action needs to stay below 1538. A break of 1538 prematurely (dashed red arrow), could signal that the 5 wave impulse higher has already started. Wave E is likely to end at a strong support zone between 1375 and 1440 in the weeks ahead. Any move below critical LT support at 1309 kills this bullish triangle pattern.
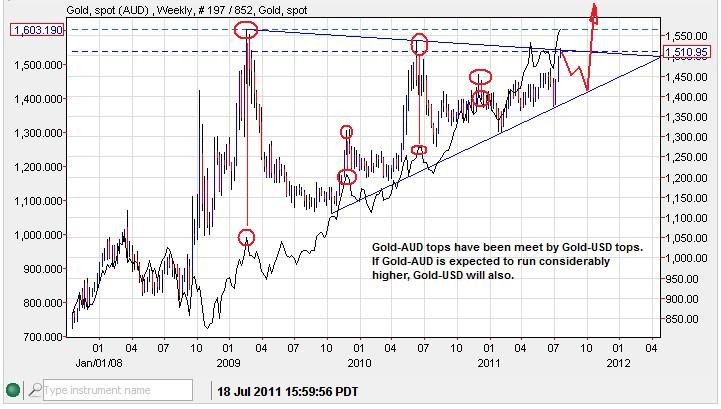
Comparative studies versus other markets:
Gold-AUD compared to Gold-USD:
Gold-AUD compared to the Dow Jones Industrial Average (DJIA):

Gold-AUD compared to the United States Dollar index (USD):

In summary, Gold should be putting in a major bottom in the second half of 2011, with another thrust higher into 2012. Gold-USD and Gold - AUD are most likely to top in unison. The USD may move lower, but a significant rebound off lower-lows is possible, to meet with a topping Gold-AUD. The end of the rise in Gold-AUD may come from the end of a major stock market sell-off.
...
Here is the previous projection calling for a climb out of a major bottom at the end of wave (C), up into wave (D) to finish a 3 wave move higher (ABC):
This is a current update showing a possibly completed Wave (D):
1538 is key resistance, 3 waves down to form wave (E) is expected, but price action needs to stay below 1538. A break of 1538 prematurely (dashed red arrow), could signal that the 5 wave impulse higher has already started. Wave E is likely to end at a strong support zone between 1375 and 1440 in the weeks ahead. Any move below critical LT support at 1309 kills this bullish triangle pattern.
Comparative studies versus other markets:
Gold-AUD compared to Gold-USD:
Gold-AUD compared to the Dow Jones Industrial Average (DJIA):
Gold-AUD compared to the United States Dollar index (USD):
In summary, Gold should be putting in a major bottom in the second half of 2011, with another thrust higher into 2012. Gold-USD and Gold - AUD are most likely to top in unison. The USD may move lower, but a significant rebound off lower-lows is possible, to meet with a topping Gold-AUD. The end of the rise in Gold-AUD may come from the end of a major stock market sell-off.
...
Monday, July 18, 2011
Corn LT - A Bullish, Multi-Year, Cup and Handle Pattern
The lows in the price of corn in the second half of this year may have a very good potential of being major lows before much greater upside.
Here is a long term corn chart with a very clear rounded bottom:
(click on chart for full view)
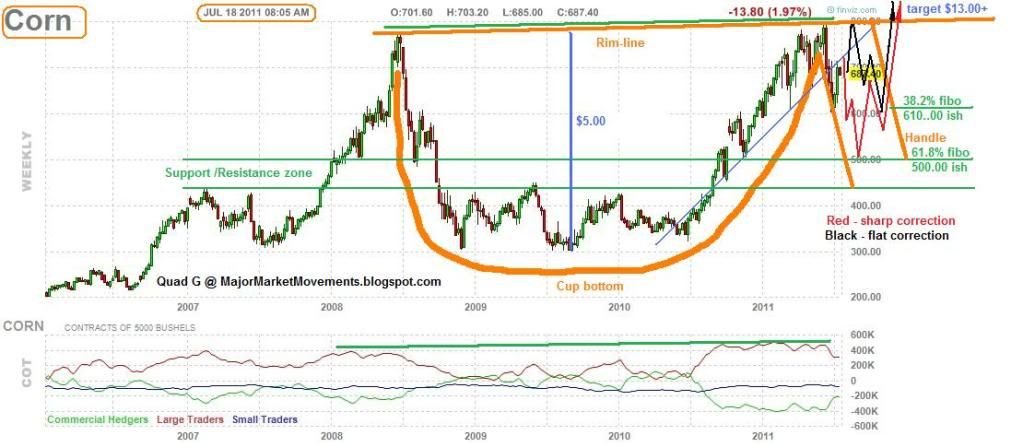
There is a basic rule of thumb when it comes to commodity prices - major tops are sharp, major bottoms are rounded.
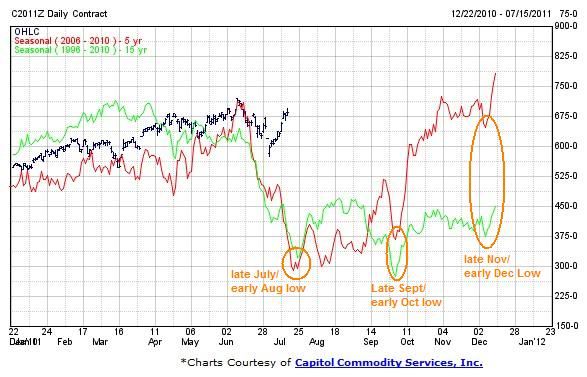
With corn we can see the price action of the past few years bear witness to this general rule. The major top in 2008 was most certainly sharp, climbing fast but falling even faster. However the current top in the Price of Corn (PoC) has produced a far more rounded top. My theory is that the current top is only a secondary top not a major one. This top has completed the right rim of a possible Cup and Handle (CnH) pattern. With the current sell-off, a Handle is likely forming. At this point the correction is young and the final pattern for a handle does not look complete. The Red projection suggests that a sharper correction into late July to early Aug. seasonal lows is possible, down to touch a major support/resistance zone at 440 to 500 and the 61.8% retrace level of the right rim lands at about 500ish. The Black projection suggests more of a flat correction, with PoC staying above the 600 to 610 area (38.2% fibo retrace level), with another move higher to re-test the previous high near 800. A final low for such a flat correction may come later in the year - late Sept/early Oct. or Late Nov/ early Dec. In general sharp corrections consume more price than time, while flat correction consume more time than price.
Once this correction is over, the Handle of this pattern could be considered complete. A thrust higher that follows, snapping the Rim-line, could produce another impulsive run higher to an initial measured target of 1300+. The depth of the cup is about $5.00, add this amount to the point at which PoC breaches the rim-line ($8.00ish) and a initial target of $13.00 is revealed. Also note the prominent levels 300, 500, 800, 1300.....these are all Fibonacci prime numbers that form the golden ratio of .618. Examples: 300/500 = .600, 500/800 = .625, 800/1300 = .615, 3+5=8, 5+8=13.
Here is a seasonal chart showing potential time frames for lows in the latter half of the year:
Here is my currently preferred EW count in Corn:
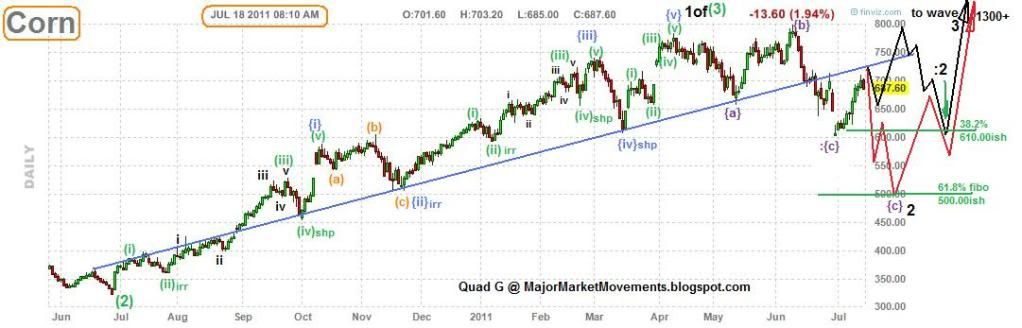
Wave 2 (black) is still likely in process. Since it is a wave two, we have little clue as to what kind of attitude we may observe, whether sharp or flat. But once complete, a strong wave 3(black) of (3)(green) may erupt to challenge 1300 or even 2100. There are other more bullish or bearish EW counts, but for now the interpretation depicted above appears most likely.
...
Here is a long term corn chart with a very clear rounded bottom:
(click on chart for full view)
There is a basic rule of thumb when it comes to commodity prices - major tops are sharp, major bottoms are rounded.
With corn we can see the price action of the past few years bear witness to this general rule. The major top in 2008 was most certainly sharp, climbing fast but falling even faster. However the current top in the Price of Corn (PoC) has produced a far more rounded top. My theory is that the current top is only a secondary top not a major one. This top has completed the right rim of a possible Cup and Handle (CnH) pattern. With the current sell-off, a Handle is likely forming. At this point the correction is young and the final pattern for a handle does not look complete. The Red projection suggests that a sharper correction into late July to early Aug. seasonal lows is possible, down to touch a major support/resistance zone at 440 to 500 and the 61.8% retrace level of the right rim lands at about 500ish. The Black projection suggests more of a flat correction, with PoC staying above the 600 to 610 area (38.2% fibo retrace level), with another move higher to re-test the previous high near 800. A final low for such a flat correction may come later in the year - late Sept/early Oct. or Late Nov/ early Dec. In general sharp corrections consume more price than time, while flat correction consume more time than price.
Once this correction is over, the Handle of this pattern could be considered complete. A thrust higher that follows, snapping the Rim-line, could produce another impulsive run higher to an initial measured target of 1300+. The depth of the cup is about $5.00, add this amount to the point at which PoC breaches the rim-line ($8.00ish) and a initial target of $13.00 is revealed. Also note the prominent levels 300, 500, 800, 1300.....these are all Fibonacci prime numbers that form the golden ratio of .618. Examples: 300/500 = .600, 500/800 = .625, 800/1300 = .615, 3+5=8, 5+8=13.
Here is a seasonal chart showing potential time frames for lows in the latter half of the year:
Here is my currently preferred EW count in Corn:
Wave 2 (black) is still likely in process. Since it is a wave two, we have little clue as to what kind of attitude we may observe, whether sharp or flat. But once complete, a strong wave 3(black) of (3)(green) may erupt to challenge 1300 or even 2100. There are other more bullish or bearish EW counts, but for now the interpretation depicted above appears most likely.
...
Sunday, July 17, 2011
Gold - Weekend Update 7-17-11
I know this Blog is about 'Major Market Movements' of all kinds. I have about 30 different charts that I would enjoy making right now for Crude, Cotton, Corn, Wheat, Bonds, Stocks. However, with my many time constraints at the moment, I am only able to give good reports on my bread and butter markets of Gold and Silver.
This weekend update focuses on Gold. There are some very important technical events that need our attention.
First, let's take a look at a few Fibonacci time measurements in Gold. Recently I produced a series of weekly charts that suggested that a significant turn in Gold may be seen in the week of August 14th (Here: Putting AU in AUgust ).
Now with some recent daily action to measure off of I think I can narrow this range down to a daily time period:
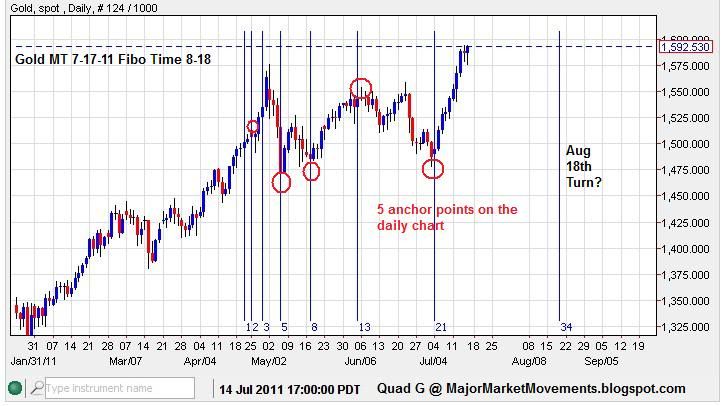
This measure suggests that a turn may be possible near August 18th (+/- 1 day), which is inside the weekly measure of Aug. 14th to Aug 20th. Since this measure has 5 anchor points the relative degree of success is fairly high. Fibo time measurements do not show direction, However, if the trend going into a Fibo time sequence is down for example, the turn is most likely to the upside. Fibo Time measurements are not 100% accurate, just like every other bit of TA. However they do increase the probabilities for success.
The trend in Gold is most certainly up into a Full Moon (July 15th) and a Fibo turn on July 18th:
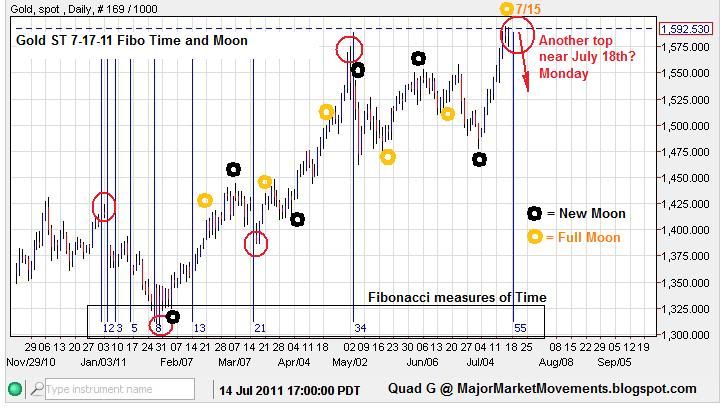
Both cycles suggest a top is either in place or soon will be. Further upside is likely to run into resistance at 1600, 1608ish and 1620ish. I would not be surprised to see this week open up with Asia taking PoG up a 1/2% incursion above 1600 (and 1.27% fibo ex-ret.)as a tease to (1608ish). Only to have the London and US market sell it down again, We'll see. The next line of resistance above 1608 is 1616 to 1620. A move above 1620 solidifies some EW counts, basically deciding between a B wave and a new Wave one impulse.
If Gold does respect this Full Moon and Fibo time measurement, I would expect a move down to test the 10 EMA and possibly 20 DMA:
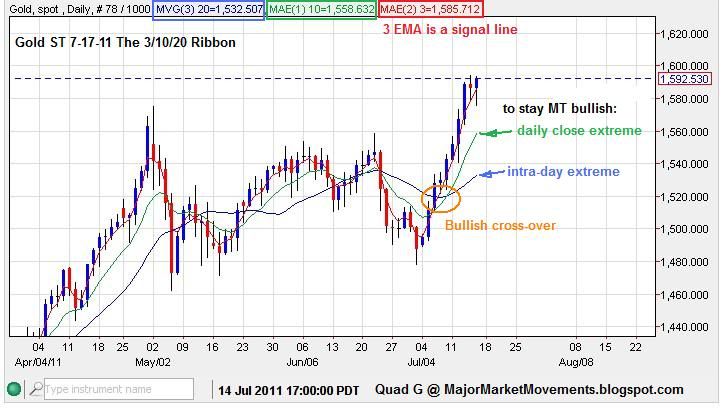
Example:
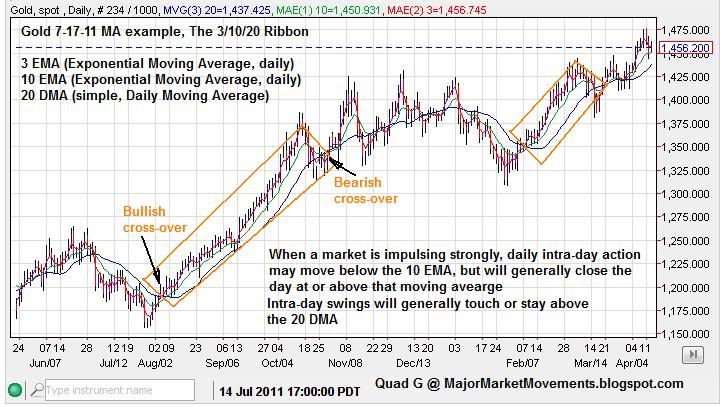
Bullish support for any retrace could be found at the 10 EMA and 20 DMA. daily closes especially need to stay above the 10 EMA. Also the 1% to 3% pull-back levels can often be reached while a trend is impulsing. If a top is in place for example at 1595, a 1% dip = 1579, 3% = 1547. The current fibo retrace levels (61.8% to 23.6% are at 1522 to 1566 respectively. These measures would obviously move up some if the trend continues higher early this week.
The other measure to pay close attention to is the previous week's open:

1542 was the previous week's open. This level becomes key for this week. If a OKR does occur, this signal is bearish. To stay bullish on this weekly chart PoG needs to close this week above 1542. But as the previous top at 1575 showed, if the following week doesn't follow through to the downside, the signal is often a dud.
With all this data, we can estimate a reasonable support zone for any dip to be inside the 1522 to 1579 zone. With firmer support between 1547 and 1558. An impulse down to the 61.8% fibo retrace level of 1522 or less this week could put this bull trend in jeopardy.
The long term support is most certainly the 150DMA:
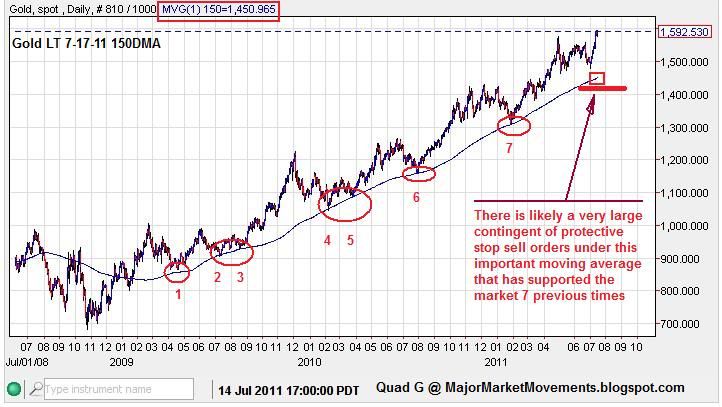
Since 2009 PoG has not had a daily close below this important Long Term support by as much as a couple dollars. A weekly close below this level would most certainly be bearish. No doubt, many protective stops for medium term and long term paper investments are below this 150 day moving average.
A brief report on Silver - As my previous report suggested, 36.85 is key EW support for continued impulsing to the upside. Critical Support is at 33.37. Please understand clearly, if 33.37 is taken out for any reason, very strong and deep downside possibilities open up. The greatest extreme that I can see being reached in a relative short period of time is $22.00. Just like the 150DMA for Gold, the 33.37 level is likely to be just as crucial.
...
This weekend update focuses on Gold. There are some very important technical events that need our attention.
First, let's take a look at a few Fibonacci time measurements in Gold. Recently I produced a series of weekly charts that suggested that a significant turn in Gold may be seen in the week of August 14th (Here: Putting AU in AUgust ).
Now with some recent daily action to measure off of I think I can narrow this range down to a daily time period:
This measure suggests that a turn may be possible near August 18th (+/- 1 day), which is inside the weekly measure of Aug. 14th to Aug 20th. Since this measure has 5 anchor points the relative degree of success is fairly high. Fibo time measurements do not show direction, However, if the trend going into a Fibo time sequence is down for example, the turn is most likely to the upside. Fibo Time measurements are not 100% accurate, just like every other bit of TA. However they do increase the probabilities for success.
The trend in Gold is most certainly up into a Full Moon (July 15th) and a Fibo turn on July 18th:
Both cycles suggest a top is either in place or soon will be. Further upside is likely to run into resistance at 1600, 1608ish and 1620ish. I would not be surprised to see this week open up with Asia taking PoG up a 1/2% incursion above 1600 (and 1.27% fibo ex-ret.)as a tease to (1608ish). Only to have the London and US market sell it down again, We'll see. The next line of resistance above 1608 is 1616 to 1620. A move above 1620 solidifies some EW counts, basically deciding between a B wave and a new Wave one impulse.
If Gold does respect this Full Moon and Fibo time measurement, I would expect a move down to test the 10 EMA and possibly 20 DMA:
Example:
Bullish support for any retrace could be found at the 10 EMA and 20 DMA. daily closes especially need to stay above the 10 EMA. Also the 1% to 3% pull-back levels can often be reached while a trend is impulsing. If a top is in place for example at 1595, a 1% dip = 1579, 3% = 1547. The current fibo retrace levels (61.8% to 23.6% are at 1522 to 1566 respectively. These measures would obviously move up some if the trend continues higher early this week.
The other measure to pay close attention to is the previous week's open:
1542 was the previous week's open. This level becomes key for this week. If a OKR does occur, this signal is bearish. To stay bullish on this weekly chart PoG needs to close this week above 1542. But as the previous top at 1575 showed, if the following week doesn't follow through to the downside, the signal is often a dud.
With all this data, we can estimate a reasonable support zone for any dip to be inside the 1522 to 1579 zone. With firmer support between 1547 and 1558. An impulse down to the 61.8% fibo retrace level of 1522 or less this week could put this bull trend in jeopardy.
The long term support is most certainly the 150DMA:
Since 2009 PoG has not had a daily close below this important Long Term support by as much as a couple dollars. A weekly close below this level would most certainly be bearish. No doubt, many protective stops for medium term and long term paper investments are below this 150 day moving average.
A brief report on Silver - As my previous report suggested, 36.85 is key EW support for continued impulsing to the upside. Critical Support is at 33.37. Please understand clearly, if 33.37 is taken out for any reason, very strong and deep downside possibilities open up. The greatest extreme that I can see being reached in a relative short period of time is $22.00. Just like the 150DMA for Gold, the 33.37 level is likely to be just as crucial.
...
Friday, July 15, 2011
Gold - The Sun and the Moon.....our gold and silver time pieces?
Recently on my thread at Kitco, a fellow member - Antimagnetic, did some very interesting research on Solar and Lunar eclipses and how those events may correlate to the price movement of Gold.
Here is the original post:
https://www.kitcomm.com/showpost.php?p=1426788&postcount=13916
And with his permission, here is his chart:
(click on chart for full view)

These unique events appear to correlate very well with various tops and bottoms. Rarely do they make a showing in the middle of an impulsive trend.
Tie this research with my earlier work involving the full and new moon cycle (Link: The Golden Moon ) and it makes you wonder......is mankind's fate in the hands of the stars?
Let me propose another theory: perhaps there is no power in the stars at all. Let me explain. Many astrologers have been studying the movements of stars and planets for centuries, finding connections between their movements and the affairs of us silly humans below. Generally the belief is that the stars and their alignments have the power to sway influence over the people of this tiny planet. Though inconsistent at times, they have perhaps stumbled across something magnificent in design, something so intricate and marvelous we puny humans have yet to comprehend it fully.
Have you ever seen inside one those old spring wound watches or clocks? all the small intricate gears, leavers, springs and pinions, driving two hands on the face of a dial with 12 numbers. Notice the circular gears, spiral springs, arcing arms and leavers all working together to produce a final result. All those parts are inanimate objects that keep track of an external force in the universe....Time. Those little parts do not drive time, it just keeps tabs on it.
I would speculate that perhaps the circular stars, spiral galaxies and arcing comets, which are also inanimate objects, are but another kind of clock.......built by a master clock builder........maybe to keep track of His agenda? Could it be that the entire depth of the universe is but God's wall clock. Just a thought......
Psalm 8
I want to thank Antimagnetic for his contribution and his permission to re-post it here.
...
Here is the original post:
https://www.kitcomm.com/showpost.php?p=1426788&postcount=13916
And with his permission, here is his chart:
(click on chart for full view)
These unique events appear to correlate very well with various tops and bottoms. Rarely do they make a showing in the middle of an impulsive trend.
Tie this research with my earlier work involving the full and new moon cycle (Link: The Golden Moon ) and it makes you wonder......is mankind's fate in the hands of the stars?
Let me propose another theory: perhaps there is no power in the stars at all. Let me explain. Many astrologers have been studying the movements of stars and planets for centuries, finding connections between their movements and the affairs of us silly humans below. Generally the belief is that the stars and their alignments have the power to sway influence over the people of this tiny planet. Though inconsistent at times, they have perhaps stumbled across something magnificent in design, something so intricate and marvelous we puny humans have yet to comprehend it fully.
Have you ever seen inside one those old spring wound watches or clocks? all the small intricate gears, leavers, springs and pinions, driving two hands on the face of a dial with 12 numbers. Notice the circular gears, spiral springs, arcing arms and leavers all working together to produce a final result. All those parts are inanimate objects that keep track of an external force in the universe....Time. Those little parts do not drive time, it just keeps tabs on it.
I would speculate that perhaps the circular stars, spiral galaxies and arcing comets, which are also inanimate objects, are but another kind of clock.......built by a master clock builder........maybe to keep track of His agenda? Could it be that the entire depth of the universe is but God's wall clock. Just a thought......
Psalm 8
I want to thank Antimagnetic for his contribution and his permission to re-post it here.
...
Thursday, July 14, 2011
Silver LT - The Big Picture
This is a good time to present my long term view of the silver market. A major low may have completed at 33.37 to finish
wave 4.
Here is the updated Long Term chart:

In order for wave 4 to be confirmed as complete, we need to see a 5 wave impulse to the upside in the short term to complete wave {i}. If a choppy 3 wave move to the upside is realized instead, then it must be counted as a corrective B wave as an alternate. B waves can NEVER be counted as a 5 wave structure, it would be a EW rule violation to do so.
Wave 5 up has the potential to breach the $50 level, then possibly back-test $50 as a small correction. Afterward PoS is likely to careen skyward into a 5th wave blow-off top. Some Fibo price relationships suggest that a target range of $95 to $130 can be reached. According to my LT count, this could be a major top for many years. However, what was once resistance, the $50 level, now and in 1980, could become support on any major correction afterward. So it is very possible (no guarantees) that the 33.37 low could be a very long term low that may never be seen again.
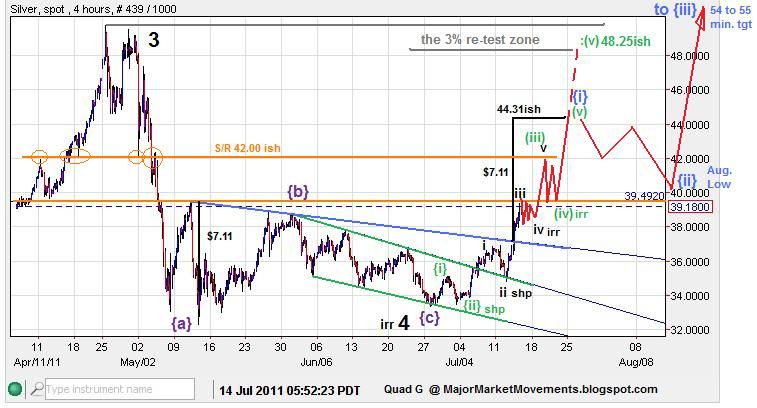
Now let's take a closer look at the action. Here is a recent call at the end of June for silver to start an impulse to the upside off the end of wave 4:
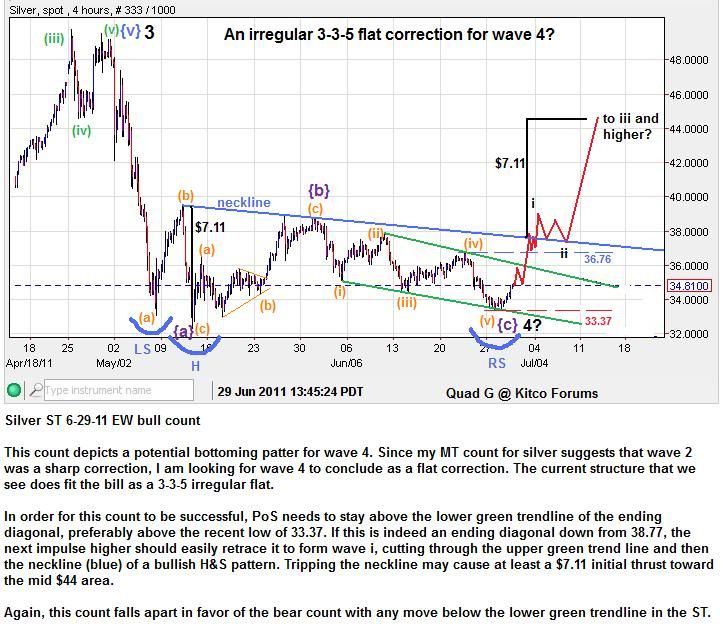
This count anticipated a 5 wave impulse to move up to break the blue neck-line of an iH&S, and quickly retrace the Ending Diagonal(ED) of wave {c} of 4. When an Ending Diagonal completes, it is text book EW for the ED to be eclipsed by an impulse in the opposite direction.
Here is the MT update:
The anticipation was meet very nicely! Silver did indeed start an impulsive series to the upside that broke the blue neck-line and fully retraced the ED. Price is currently encountering some resistance at the previous swing high around $39-$40.
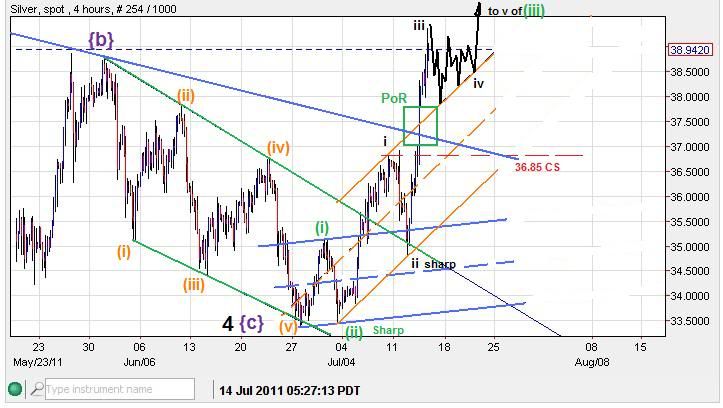
I shall zoom in even closer to a ST count, this was posted back on July 5th:
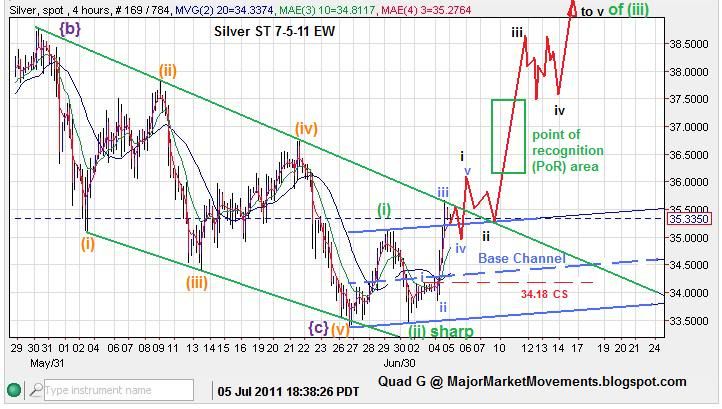
I suspected that a 3rd of a 3rd, Point of Recognition (PoR)(green box) may be seen around the location of the blue neck-line, after a wave (i),(ii), i,ii count, with price easily exceeding $38.50 there after. The breach of the upper blue base channel line also strongly indicated the presence of 3rd wave impulsive action. 3rd waves are often a very strong if not the strongest impulse of a 5 wave series.
ST update 7/14/11:
$38.50 was exceeded. PoS clearly printed a PoR in the green box. Also note that the 3rd wave impulse busted through both base channels (blue and orange). Another clue that a strong 3rd of a 3rd impulse was very likely, is the fact that both wave (ii)green and wave ii black were both sharp corrections. If one or the other was an alternate irregular correction, then the upside potential could have been a bit more limited.
This current impulsive series to the upside may see an alternating irregular correction for wave iv black. Price action needs to stay above the wave i black top at $36.85 (dashed red). Critical support for ANY further upside potential is $33.37. There are likely enough protective sell orders below 33.37 to cause the price of Silver to move swiftly down into the 20s if 33.37 is broken.
Good Hunting...
QG
wave 4.
Here is the updated Long Term chart:
In order for wave 4 to be confirmed as complete, we need to see a 5 wave impulse to the upside in the short term to complete wave {i}. If a choppy 3 wave move to the upside is realized instead, then it must be counted as a corrective B wave as an alternate. B waves can NEVER be counted as a 5 wave structure, it would be a EW rule violation to do so.
Wave 5 up has the potential to breach the $50 level, then possibly back-test $50 as a small correction. Afterward PoS is likely to careen skyward into a 5th wave blow-off top. Some Fibo price relationships suggest that a target range of $95 to $130 can be reached. According to my LT count, this could be a major top for many years. However, what was once resistance, the $50 level, now and in 1980, could become support on any major correction afterward. So it is very possible (no guarantees) that the 33.37 low could be a very long term low that may never be seen again.
Now let's take a closer look at the action. Here is a recent call at the end of June for silver to start an impulse to the upside off the end of wave 4:
This count anticipated a 5 wave impulse to move up to break the blue neck-line of an iH&S, and quickly retrace the Ending Diagonal(ED) of wave {c} of 4. When an Ending Diagonal completes, it is text book EW for the ED to be eclipsed by an impulse in the opposite direction.
Here is the MT update:
The anticipation was meet very nicely! Silver did indeed start an impulsive series to the upside that broke the blue neck-line and fully retraced the ED. Price is currently encountering some resistance at the previous swing high around $39-$40.
I shall zoom in even closer to a ST count, this was posted back on July 5th:
I suspected that a 3rd of a 3rd, Point of Recognition (PoR)(green box) may be seen around the location of the blue neck-line, after a wave (i),(ii), i,ii count, with price easily exceeding $38.50 there after. The breach of the upper blue base channel line also strongly indicated the presence of 3rd wave impulsive action. 3rd waves are often a very strong if not the strongest impulse of a 5 wave series.
ST update 7/14/11:
$38.50 was exceeded. PoS clearly printed a PoR in the green box. Also note that the 3rd wave impulse busted through both base channels (blue and orange). Another clue that a strong 3rd of a 3rd impulse was very likely, is the fact that both wave (ii)green and wave ii black were both sharp corrections. If one or the other was an alternate irregular correction, then the upside potential could have been a bit more limited.
This current impulsive series to the upside may see an alternating irregular correction for wave iv black. Price action needs to stay above the wave i black top at $36.85 (dashed red). Critical support for ANY further upside potential is $33.37. There are likely enough protective sell orders below 33.37 to cause the price of Silver to move swiftly down into the 20s if 33.37 is broken.
Good Hunting...
QG
Wednesday, July 13, 2011
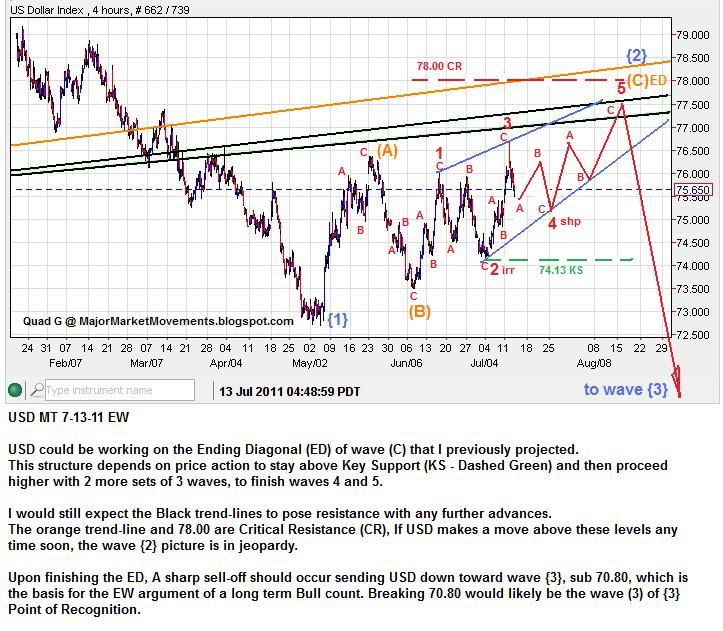
USD MT - Working on an ED......Ending Diagonal
The Long Term USD Elliot Wave count suggests that the current sideways correction in USD is a Wave {2} nearing completion:
The moves higher should be back testing the Black trend-lines, as what was once support should now become resistance.
There is a reasonable LT USD Bull count which highly depends on USD 70.80 holding as Critical Support. This Bullish Count, which I do not favor at this time, can be found at Daneric's EW blog Here: http://danericselliottwaves.blogspot.com
The last USD MT update in May suggested that the index was likely to move in choppy, corrective, sideways to upward structure as wave {2}:

So far the projection is fairly in line with my previous projection. Only two more 3 wave moves are needed to finish the idealized structure depicted:
This ED should be finished before the end of August. If USD falls below 74.13 KS, then the pattern fails to the downside, Wave {3} down could start earlier than expected. A push above the orange trend-line and 78.00 will likely place this whole wave {2} concept in jeopardy.
...
The moves higher should be back testing the Black trend-lines, as what was once support should now become resistance.
There is a reasonable LT USD Bull count which highly depends on USD 70.80 holding as Critical Support. This Bullish Count, which I do not favor at this time, can be found at Daneric's EW blog Here: http://danericselliottwaves.blogspot.com
The last USD MT update in May suggested that the index was likely to move in choppy, corrective, sideways to upward structure as wave {2}:
So far the projection is fairly in line with my previous projection. Only two more 3 wave moves are needed to finish the idealized structure depicted:
This ED should be finished before the end of August. If USD falls below 74.13 KS, then the pattern fails to the downside, Wave {3} down could start earlier than expected. A push above the orange trend-line and 78.00 will likely place this whole wave {2} concept in jeopardy.
...
Tuesday, July 12, 2011
Gold LT - The End Game, Final 5th Is Near
There are many gold counts because of many interpretations by many interpreters. I have seen several dozen counts, a few more convincing than others.
I have settled on my own interpretation, starting with the longest term counts and then zooming in to the latest update, I present my case:
Earlier this year, I came across an up-to-date historical chart which I promptly applied my wave counting to. I have been mentioning the potential of this count since 2009 on my thread at Kitco.
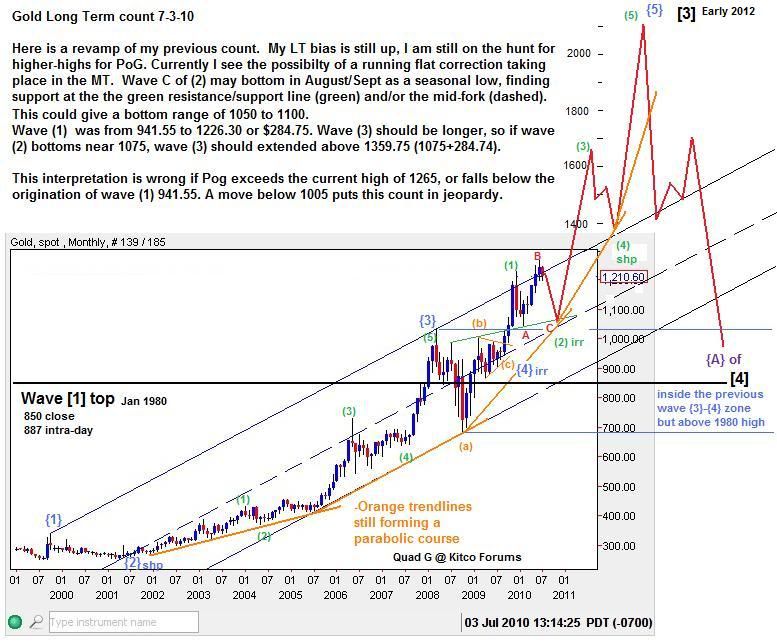
The Grand Scheme:

You can see that the 100% level of the 1970 to 1980 move (about $800) added to the 1999 bottom of 251.70 was very close to nailing the 2008 top at 1032. The 161.8% level at 1545 came very close to our recent high of 1575 set in May 2011. Now I think the 261.8% level, 2345 is the next benchmark to be reached and perhaps very soon.
Even though Cycle wave [2] took almost 20 years, I do not think that cycle wave [3] will take 20 years. I actually suspect that the mean effective low in the metals complex was in 1996. This is another intricate issue that I will not go into at this time. However, with an effective cycle low for the metals in 1996 this gives us a 16 year cycle from the 1980 top. Therefore, cycles being equal, from 1996 plus 16 years suggests an effective cycle top for the metals in 2012. One of the lows of cycle wave [4], Perhaps the second, wave {C}, is likely to complete the next 16 year cycle.
Now focusing in a little closer, I posted this chart back in July 2010:
Wave (2)green, could have been a sharp or a flat correction. I depicted the correction as an irregular flat. But with the price action breaching the 1265 level, it clearly made wave (2) a sharp correction. Thus the rule of alternation suggests wave (4) should be an irregular correction.....we'll see that in a minute.
Another step closer, Ha!......yes.....follow me down the rabbit hole :D
Posted in Feb 2011:

In the above chart, I suggested that wave 1 (black) was one impulse complete up to 1265. But if you look at the internals of that count, it's a bit ugly. I reluctantly accepted it as one impulse and moved along. However, I now think that interpretation was incorrect and a better one can be made. I'll show you soon. The 3rd and 4th waves played out nicely, with wave 4 finishing as expected near 1310 (1308 to be exact), with a 5th wave higher to go.
Finally the latest update with revisions:
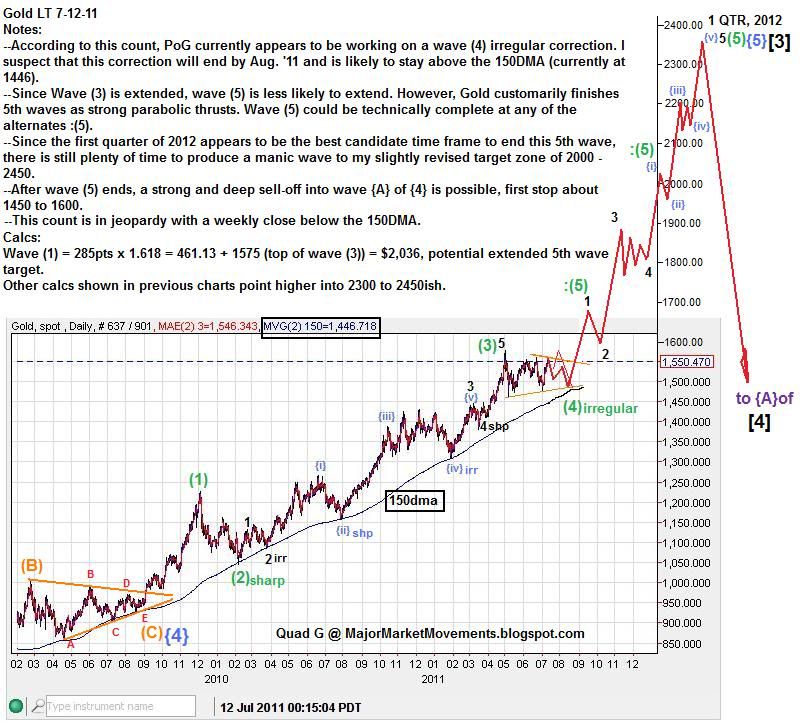
This interpretation takes care of a few problems, one of which is the previous way wave 1 (black) was counted. Wave 5 did not extend as previously expected, because wave 3 already did. Wave (2) was counted correctly as a sharp correction, Wave (4) is near complete as an irregular flat. According to this count, Wave (5) of {5} of [3] is about to begin, heading higher into the first Quarter of 2012. Though the wave count could be considered complete at the alternate locations shown, (:) colon marks alternates, I'm going to give gold the benefit of the doubt that a 5th wave blow-off mania top is possible into the 2000 to 2450 zone.
This count is likely in jeopardy if PoG falls below the 150dma, closing under that moving average on a weekly basis.
...
I have settled on my own interpretation, starting with the longest term counts and then zooming in to the latest update, I present my case:
Earlier this year, I came across an up-to-date historical chart which I promptly applied my wave counting to. I have been mentioning the potential of this count since 2009 on my thread at Kitco.
The Grand Scheme:
You can see that the 100% level of the 1970 to 1980 move (about $800) added to the 1999 bottom of 251.70 was very close to nailing the 2008 top at 1032. The 161.8% level at 1545 came very close to our recent high of 1575 set in May 2011. Now I think the 261.8% level, 2345 is the next benchmark to be reached and perhaps very soon.
Even though Cycle wave [2] took almost 20 years, I do not think that cycle wave [3] will take 20 years. I actually suspect that the mean effective low in the metals complex was in 1996. This is another intricate issue that I will not go into at this time. However, with an effective cycle low for the metals in 1996 this gives us a 16 year cycle from the 1980 top. Therefore, cycles being equal, from 1996 plus 16 years suggests an effective cycle top for the metals in 2012. One of the lows of cycle wave [4], Perhaps the second, wave {C}, is likely to complete the next 16 year cycle.
Now focusing in a little closer, I posted this chart back in July 2010:
Wave (2)green, could have been a sharp or a flat correction. I depicted the correction as an irregular flat. But with the price action breaching the 1265 level, it clearly made wave (2) a sharp correction. Thus the rule of alternation suggests wave (4) should be an irregular correction.....we'll see that in a minute.
Another step closer, Ha!......yes.....follow me down the rabbit hole :D
Posted in Feb 2011:
In the above chart, I suggested that wave 1 (black) was one impulse complete up to 1265. But if you look at the internals of that count, it's a bit ugly. I reluctantly accepted it as one impulse and moved along. However, I now think that interpretation was incorrect and a better one can be made. I'll show you soon. The 3rd and 4th waves played out nicely, with wave 4 finishing as expected near 1310 (1308 to be exact), with a 5th wave higher to go.
Finally the latest update with revisions:
This interpretation takes care of a few problems, one of which is the previous way wave 1 (black) was counted. Wave 5 did not extend as previously expected, because wave 3 already did. Wave (2) was counted correctly as a sharp correction, Wave (4) is near complete as an irregular flat. According to this count, Wave (5) of {5} of [3] is about to begin, heading higher into the first Quarter of 2012. Though the wave count could be considered complete at the alternate locations shown, (:) colon marks alternates, I'm going to give gold the benefit of the doubt that a 5th wave blow-off mania top is possible into the 2000 to 2450 zone.
This count is likely in jeopardy if PoG falls below the 150dma, closing under that moving average on a weekly basis.
...
Subscribe to:
Posts (Atom)