Here is a long term corn chart with a very clear rounded bottom:
(click on chart for full view)
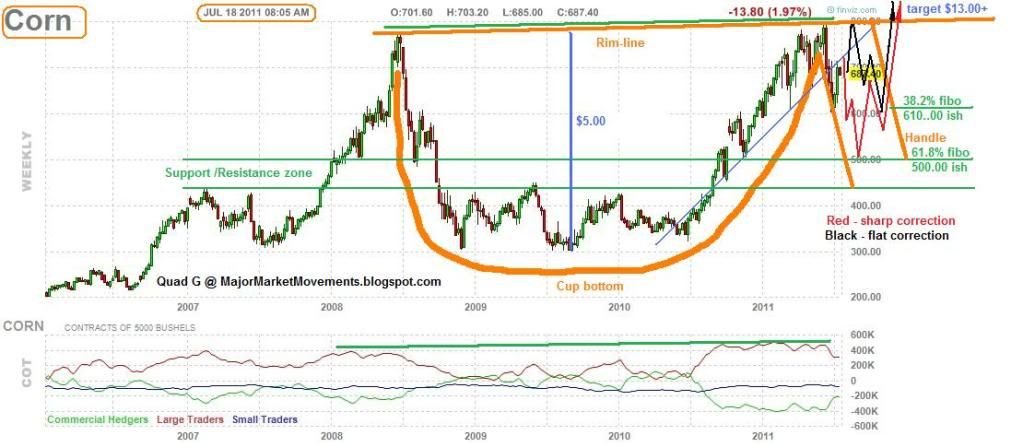
There is a basic rule of thumb when it comes to commodity prices - major tops are sharp, major bottoms are rounded.
With corn we can see the price action of the past few years bear witness to this general rule. The major top in 2008 was most certainly sharp, climbing fast but falling even faster. However the current top in the Price of Corn (PoC) has produced a far more rounded top. My theory is that the current top is only a secondary top not a major one. This top has completed the right rim of a possible Cup and Handle (CnH) pattern. With the current sell-off, a Handle is likely forming. At this point the correction is young and the final pattern for a handle does not look complete. The Red projection suggests that a sharper correction into late July to early Aug. seasonal lows is possible, down to touch a major support/resistance zone at 440 to 500 and the 61.8% retrace level of the right rim lands at about 500ish. The Black projection suggests more of a flat correction, with PoC staying above the 600 to 610 area (38.2% fibo retrace level), with another move higher to re-test the previous high near 800. A final low for such a flat correction may come later in the year - late Sept/early Oct. or Late Nov/ early Dec. In general sharp corrections consume more price than time, while flat correction consume more time than price.
Once this correction is over, the Handle of this pattern could be considered complete. A thrust higher that follows, snapping the Rim-line, could produce another impulsive run higher to an initial measured target of 1300+. The depth of the cup is about $5.00, add this amount to the point at which PoC breaches the rim-line ($8.00ish) and a initial target of $13.00 is revealed. Also note the prominent levels 300, 500, 800, 1300.....these are all Fibonacci prime numbers that form the golden ratio of .618. Examples: 300/500 = .600, 500/800 = .625, 800/1300 = .615, 3+5=8, 5+8=13.
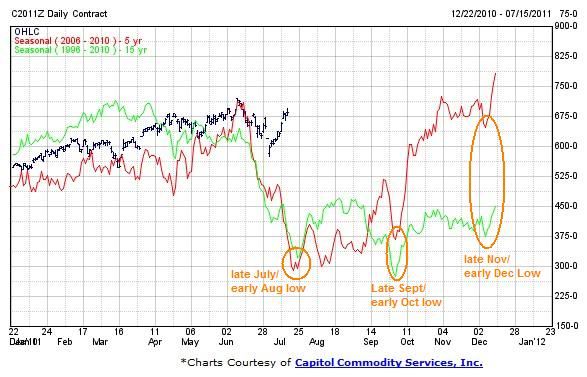
Here is a seasonal chart showing potential time frames for lows in the latter half of the year:
Here is my currently preferred EW count in Corn:
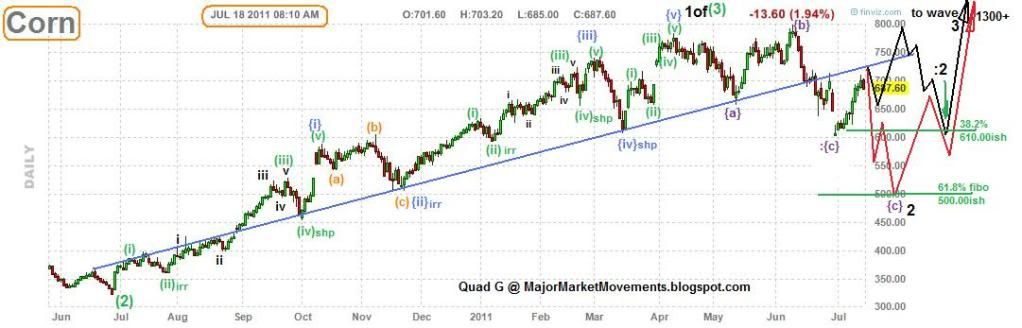
Wave 2 (black) is still likely in process. Since it is a wave two, we have little clue as to what kind of attitude we may observe, whether sharp or flat. But once complete, a strong wave 3(black) of (3)(green) may erupt to challenge 1300 or even 2100. There are other more bullish or bearish EW counts, but for now the interpretation depicted above appears most likely.
...