Hey all, I took the plunge! My Kitco buds and others finally pushed me over the edge. Gonna try this new fangled 'Blog' stuff. Please be patient, as I've never piloted one of these contraptions before.
Last week left the crude oil (WTI) market in a very interesting and very bullish position. Seldom does a market display more than 3 or 4 technical signs of a turn at any particular time. But the following crude chart identifies 6 distinguished, potentially bullish, characteristic to the current pattern. I failed to include in the chart the positive (+ve) divergences in the RSI(14) and MACD, as well as the fact that the weekly chart came within a whisker of the lower Bollinger B (BB) support.
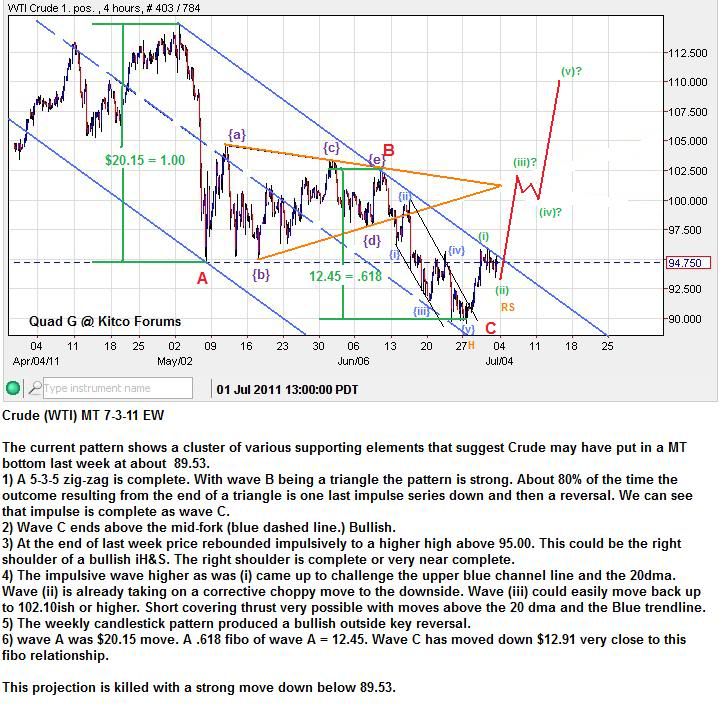
The 89.53 bottom also squares with the 88 to 90 multi-month support zone that I pointed out a couple weeks ago. The Seasonals http://www.futuresbuzz.com/crude.html suggest that from now till Aug. and possibly as late as Oct. the bias is to the upside. I would give this strong pattern a 85% chance of success to move higher toward 102+ in the weeks ahead. But needs to keep above 89.53 or risk losing that bullish advantage in favor of more downside.