LT chart from last May:
(click on chart for full view)

LT chart update from late June:
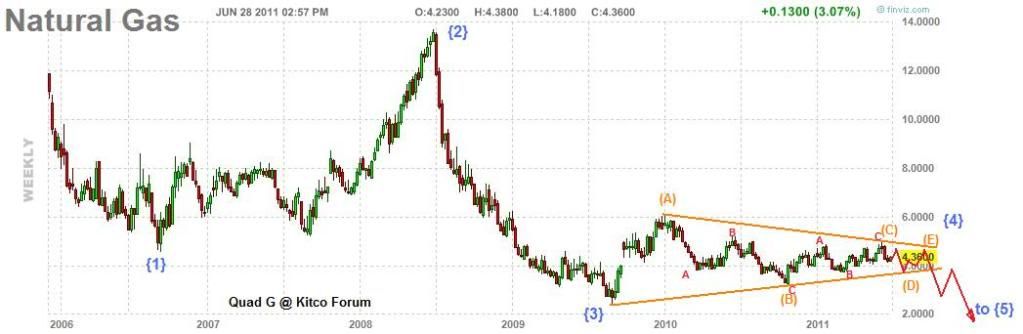
Current MT EW interpretation:

As the chart in late June suggested, natgas may be working on wave (D)orange down to the lower triangle boundary at 3.80ish. If this boundary is broken the triangle pattern is not killed, but has taken on an abnormality. The triangle would not officially die until the extreme of wave (B) was taken out (3.25ish). If natgas does take out the lower boundary (red dashed), an attempt may be made to fill the large gap left in Oct. 2010.
Seasonal chart:
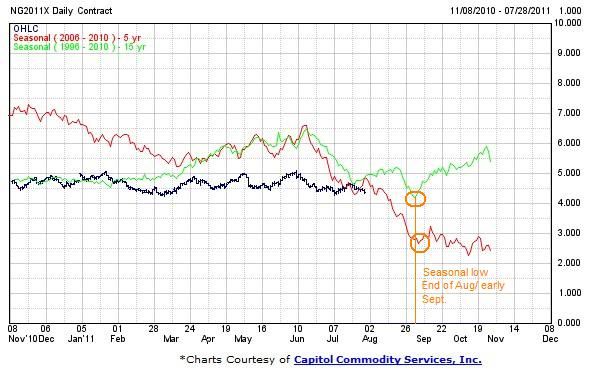
Wave (D) might finish near the seasonal low in late August/ Early September and then move higher into wave (E) of {4} as winter demand starts to pick up.
4.60 to 4.65 is the critical resistance for this projection. If that level is breached before the price of natgas moves below 4.07 toward 3.80ish, then this MT interpretation is incorrect. However, the long term triangle count is still valid until the top of wave (C) is broken above 5.00
In A Nut Shell:
Natgas appears to be continuing inside a choppy sideways pattern, oscillating between 4.65 and 3.80 for the next few weeks, perhaps moving down toward a seasonal low in late August/early September. There is an outside chance a large gap may be filled at 3.40ish
...