There are many gold counts because of many interpretations by many interpreters. I have seen several dozen counts, a few more convincing than others.
I have settled on my own interpretation, starting with the longest term counts and then zooming in to the latest update, I present my case:
Earlier this year, I came across an up-to-date historical chart which I promptly applied my wave counting to. I have been mentioning the potential of this count since 2009 on my thread at Kitco.
The Grand Scheme:
You can see that the 100% level of the 1970 to 1980 move (about $800) added to the 1999 bottom of 251.70 was very close to nailing the 2008 top at 1032. The 161.8% level at 1545 came very close to our recent high of 1575 set in May 2011. Now I think the 261.8% level, 2345 is the next benchmark to be reached and perhaps very soon.
Even though Cycle wave [2] took almost 20 years, I do not think that cycle wave [3] will take 20 years. I actually suspect that the mean effective low in the metals complex was in 1996. This is another intricate issue that I will not go into at this time. However, with an effective cycle low for the metals in 1996 this gives us a 16 year cycle from the 1980 top. Therefore, cycles being equal, from 1996 plus 16 years suggests an effective cycle top for the metals in 2012. One of the lows of cycle wave [4], Perhaps the second, wave {C}, is likely to complete the next 16 year cycle.
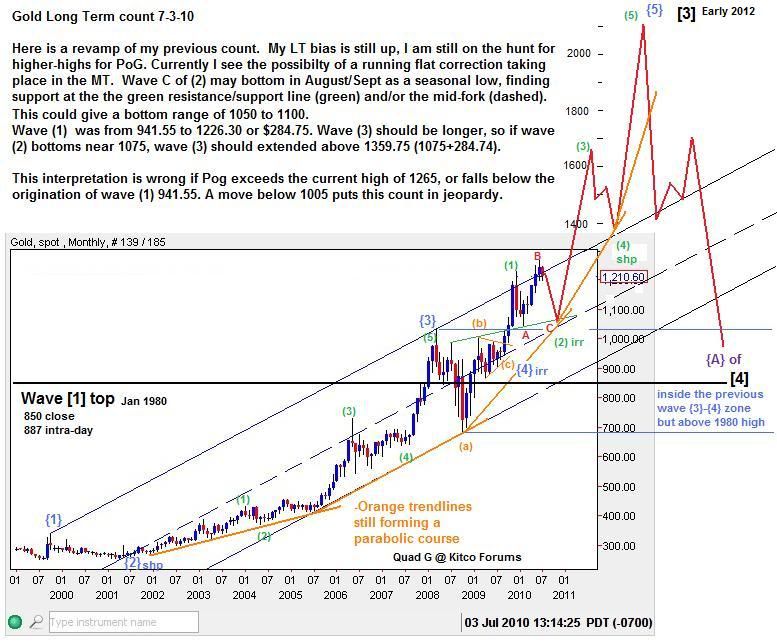
Now focusing in a little closer, I posted this chart back in July 2010:
Wave (2)green, could have been a sharp or a flat correction. I depicted the correction as an irregular flat. But with the price action breaching the 1265 level, it clearly made wave (2) a sharp correction. Thus the rule of alternation suggests wave (4) should be an irregular correction.....we'll see that in a minute.
Another step closer, Ha!......yes.....follow me down the rabbit hole :D
Posted in Feb 2011:
In the above chart, I suggested that wave 1 (black) was one impulse complete up to 1265. But if you look at the internals of that count, it's a bit ugly. I reluctantly accepted it as one impulse and moved along. However, I now think that interpretation was incorrect and a better one can be made. I'll show you soon. The 3rd and 4th waves played out nicely, with wave 4 finishing as expected near 1310 (1308 to be exact), with a 5th wave higher to go.
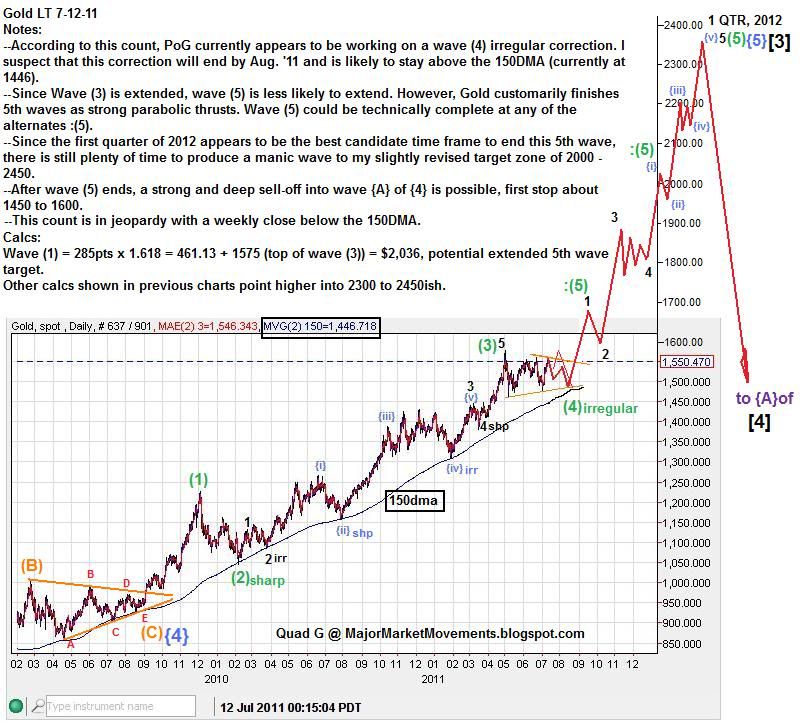
Finally the latest update with revisions:
This interpretation takes care of a few problems, one of which is the previous way wave 1 (black) was counted. Wave 5 did not extend as previously expected, because wave 3 already did. Wave (2) was counted correctly as a sharp correction, Wave (4) is near complete as an irregular flat. According to this count, Wave (5) of {5} of [3] is about to begin, heading higher into the first Quarter of 2012. Though the wave count could be considered complete at the alternate locations shown, (:) colon marks alternates, I'm going to give gold the benefit of the doubt that a 5th wave blow-off mania top is possible into the 2000 to 2450 zone.
This count is likely in jeopardy if PoG falls below the 150dma, closing under that moving average on a weekly basis.
...


