Friday, September 30, 2011

Morning Coffee with Quad G - 9/30/11

Mornin' All!

Gold - This should be it's own article but for the sake of time I'm gonna cram it in here. First let's look at a potential triangle/thrust bottoming pattern:


The current ST triangle is fairly mature and could be finished soon with a 3 leg wave (e) up. The resulting 5 wave series to the downside should be a final thrust to a bottom. Then price action should rebound back up into the price territory of the triangle, possibly into a right neck. If Key Resistance (KR) is taken out at 1640, then the triangle, at least as I have it drawn, is incorrect. If Critical Resistance (CR) is taken out then the triangle pattern is dead.

Zooming out and adding a time fibo measure we see that a potential exists for a turn near the trading day starting on Oct. 7th (which is actually 5pm on Oct. 6th).


Zooming out even further to a longer term view, a major source of support is clustered near 1440ish to 1510ish. Now that the 12% to 15% degree of correction area is busted, the 25 to 38% correction zone should be considered. The top of that zone is 1440:


I suspect that this larger correction is part of a 4th wave. I will present an updated EW count that I have in my head at a later time.

Dow - Time for a guessing game! Which one of these Dead Cat Bounces happened in 2008 and which one happened in 2011?


Hint #1: Both of these DCBs occur in roughly the same price area.
Hint #2: Both of these DCBs occur in roughly the same time period but 3 years apart.
Hint #3: The DCB in 2008 eventually led to an almost 28% collapse in the Dow within 8 days.
Hint #4: the Current DCBs top is 11,716 in 2011.

Good Hunting......


...

Wednesday, September 28, 2011

Gold - A review of Fibonacci time measures and turns....before and after.

Let's review the Time Fibos that I posted back in June (at Kitco) showing a significant turn week of August 14th and the turn day of August 18th.

Here are the older charts:


As the week of the 14th came closer, some daily fibo alignments became apparent and pointed to a turn date window of August 18th +/- 1 trading day:


This is a relatively large cluster of time fibos that have pointed to the same time period, thus it's significance was likely to be just as large. Originally I was looking for a trend down or sideways into that date, so that a larger rally would erupt. However, as you will see in a moment the trend moved strongly up into the turn window. This could mean only one thing, that a significant top was likely to form for at least several weeks.

Here is the updated outcome so far:


The trend was certainly up into these turn date windows, so the resulting trend is certainly down for at least several weeks if not months. This is very likely to invert the cycle that I was originally looking at. Since we saw an August high instead of a low, the high what I was looking for in January '12 may actually be a low.

Here is a new set of weekly time fibos that roughly point to a time period between the last week of December and the second week of January:


If PoG can stay within the long term up channel (blue) over the next few months into the late December to mid-January time frame, moving in a choppy sideways manner, I think another major bottom could be produced for another large surge higher into 2012. As time approaches this weekly span, I will be able to use the Time fibo tool in the daily time frame to perhaps nail down a more specific turn date. It should be noted that a major Bradley turn date is set for December 28th also.


...

Tuesday, September 27, 2011

Morning Coffee with Quad G - 9/27/11

Mornin' All,

Gold - The 4hr hammer candle that I mentioned yesterday seems to have done the trick and excited a rally back up into the Bollinger Bands just as anticipated. Closed 3 days under the BBs then popping back up through on the 4th, text book BB theory for Gold. Keep in mind that nothing is certain, but in the great majority of cases this theory is true for Gold and the stock market, Silver less so.

I think the most volatile move is over. Gold may now firm up a bottom over the next couple weeks. Another downward move looks likely into October, but not sure if it will be a lower-low or higher-low compared to the 1532 bottom yesterday. The Wave count is a bit messy, but at least one more wave down looks possible while PoG remains below the 10EMA on a daily closing basis (currently 1727 and falling). Again I reiterate, bulls want to see PoG remain above 1614 by the end of the week, to avoid a bearish OKR on the monthly chart.

Silver - Basically in lock step with Gold, seeing a bounce off a 4hr hammer candle from a very oversold condition. It too is under pressure while below the 10EMA and a lower-low is possible in October. But as long as Silver remains inside the blue base channel that I charted, chances are good that a major bottom could be finished soon, and a new rally may begin, at least a wave B up. This correction is on the same scale as the 2008 correction. The 2008 correction was sharp in nature, So this correction could be irregular, but spread out over much more time. There is also the possibility that this move down from $50 is the handle of a large 30+ year Cup and Handle formation. I will chart these thoughts soon.

Dow - Looks like we are going to see some end of the quarter window dressing, a little 'lip-stick on the pig'. After fund managers were caught with their pants down in July, they are likely to use any reserve cash to run the market up before the end of the month so that paying customers will see a better end result. A Little POMO action is also helping things along. If they can push the Dow up above 11,550 this week my bearish HnS pattern that I have pointed out will be killed, which could spark and even great short cover rally. But come October 1st after the quarter is all painted up nice and pretty, we may see the very same fund managers climb over the top of each other on their way to the exits. Resistance to the upside exists at the 10EMA (11,104) and the 20DMA (11,256).

The DAX (German Stock Market) gave a gap up this morning that has yet to fill. They have a few hours left to trade, let's see if they close it in a hurry. If they do fill it today, it signals a possible exhaustion gap which is bearish. We may also see the Dow give an exhaustion gap up this AM.

BAC - Popped above ST resistance yesterday at 6.50, the next significant level is 6.80 which was the previous break-down level. This rally could be just a back-test of that break-down before heading lower. However if BAC can surmount 6.80 then all bets are off, much further upside very possible.

USD - Not behaving as previously anticipated. Key support is at 77.51. Currently we are seeing a small bounce off the 10EMA level at 77.60. The 3/10/20 ribbon is still bullish but will likely enter a neutral alignment if USD closes the day below the 10EMA. Either way, for a long side bet the risk is fairly minimal at this point with stops under 77.51.

I wanted to get this out quickly, I may come back later and fill this article in with charts a bit later in the morning.

All the Best.....


...

MMM Weekly Round Table Discussion 9/27/11 to 10/2/11

This 'Thread' is for your comments and questions during this week.
There is a hot link for this section on the top of the side bar to the right.

The blog is experiencing even more traffic. Now up into the 4,000 views a day territory. Thanks all for the support!


...

Monday, September 26, 2011

Morning Coffee with Quad G - 9/26/11

Mornin' All,

Silver - Has moved into a support cluster near the 25 to 27 price range and has so far managed a ST impulse up, producing a 4hr bullish hammer candle. This could give us a bounce out of an oversold condition at the least:


4hr reversal candle:


ST 5 wave impulse off the bottom and bull flag:


If this early morning move up is part of a significant bottom, a sharp impulsive drive should move PoS to above the upper blue base channel line. If not, then it's more likely a 3 wave ABC correction to the upside and another wave down could be next to do some more bottom searching.


Dow - A Third of a Third 'point of recognition' to the downside is possible very soon:


This projection is dead if the Dow moves above 11,550 (Critical Resistance, CR)

USD - My previous count suggested that USD should be working on a 3rd wave up. However, the action so far has not given the appropriate impulsive attitude. I can see a possible ending diagonal. A move below 77.52 would likely confirm the ending diagonal and deny the 3rd wave impulse to the upside.

30 year Bond - Also looks like it could be working on a weakening top. Key support in price is at 142. Falling below that level suggests the bond market may have placed a significant top.

Good Hunting All,


...

Sunday, September 25, 2011

Gold - Update 9/25/11

Many charts this weekend, much to consider because of last week's move. There is a fairly tight grouping of support that I'll show first:

Previous charts have shown an increasing parabolic rise in supporting trend-lines. The foremost line is one to watch, which is near 1578 this week:


Gold has also produced a fairly consistent stair step in price from which investors have risked 2-3% above the previous step. Another test of the last step is likely underway. If investors are still in the mood to buy, they should be willing to risk another 1-3% above the previous step, providing a risk window of 1575 to 1622:


I have shown the long standing support at the 150DMA for the past couple years, which has now moved steadily upward to a support level of 1577:


Looking at the MT EW count Wave (4)green can be counted as an irregular expanded flat which is filling in most of the 12-15% correction window for this degree of correction, same for wave(2) green. The bottom of the 15% range is at 1625ish:


There is also a serious danger to further MT upside that could become obvious next week. If the Month of September closes below the Opening price in August (1614.76), a very bearish Outside Key Reversal (OKR) will be printed. The same occurred in 2008 which was followed by a 34% major correction for 7 months from the 1032 top in March 2008. Such a move would be a major sell signal for many investors. An intra-month fall through 1614.76 is acceptable this week, but the month MUST close above 1614.76, friday the 30th to avoid this bearish signal. Here is the chart:


The action on Friday did see an end of day bounce after filling in a very thinly traded area between between 1632 and 1638, then finished the day back above the sloping trend-line connecting the previous 2 ST bottoms. This shows that there is some degree of buying interest at these levels:


Also, Friday closed the day about $55 below the lower Bollinger Band (BB). This was the second day of closing below the band. One more day is possible on Monday, then chances are very good that price will rise back into the BBs again for at least a ST bounce. The 3/10/20 clearly in a bearish alignment and will remain that way with daily closes below the 10EMA (currently 1770):


A weekly time fibo points to next week as a possible bottom. This would coincide with options expiry, futures expiry, a new moon and a minor Bradley turn date on the 26th:


The daily time fibo also shows a potential turn early this week. A dead cat bounce as a minimum. Daily fibo turns are given +/- 1 day of window, end of day Monday the 26th should close the window:


In A Nut Shell:

I suspect that PoG will see a bounce early next week back up into the BBs 1700ish from a support zone of 1614 to 1643. Then a retest of those lows looks possible in the first or second week of October. A group of significant support exists between 1575 and 1590. If this zone of support is broken below 1575, then a major top has likely formed, one which may take several months for PoG to surmount after dropping even further (1200s would be possible). This would also kill the MT EW count and prospects of a major parabolic run into the first quarter of 2012.

I will work on my Silver report next. I will get to your questions and comments as soon as I am able.


...

Friday, September 23, 2011

MMM Epic Fail Alert - Gold and Silver 9/23/11

Epic Fail in Gold and Silver! My analysis is obviously incorrect. Gold down to 1684, silver down to 32.25. At this point regard all my previous counts and analysis as null and void, except for the 3/10/20 ribbon at this time.

The currency markets are not responding in kind with this move in Gold and Silver, so the move is likely fear based capitulation on the part of long side investors.

However, Stocks, Crude, Copper, Palladium, USD, and cross pairs EUR, GBP, AUD and CAD all moving as anticipated, as the deflationary juggernaut that I warned of has crashed through the door. Gold and Silver are now added to the victims list.


...

Thursday, September 22, 2011

Morning Coffee with Quad G - 9/22/11

Mornin' all,

Yesterday displayed a classic deflationary picture, all asset classes down except bonds and cash (USD), the continuation can be seen this morning:


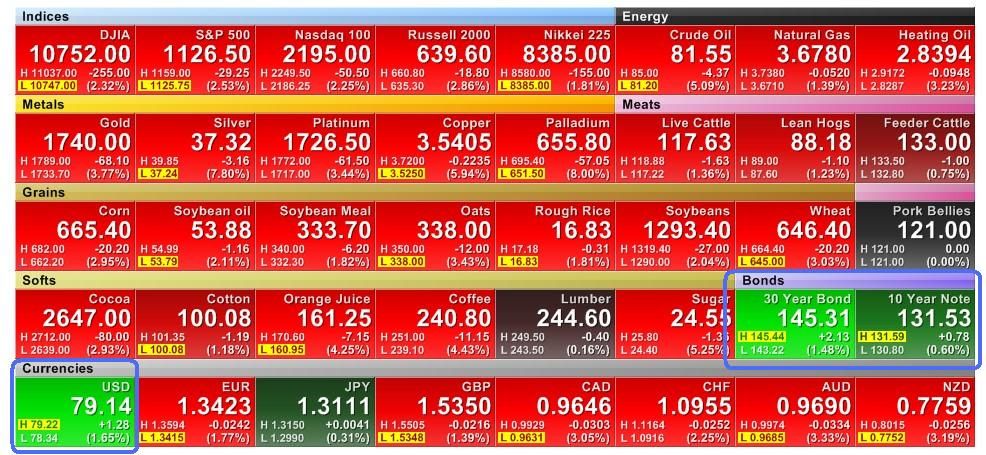
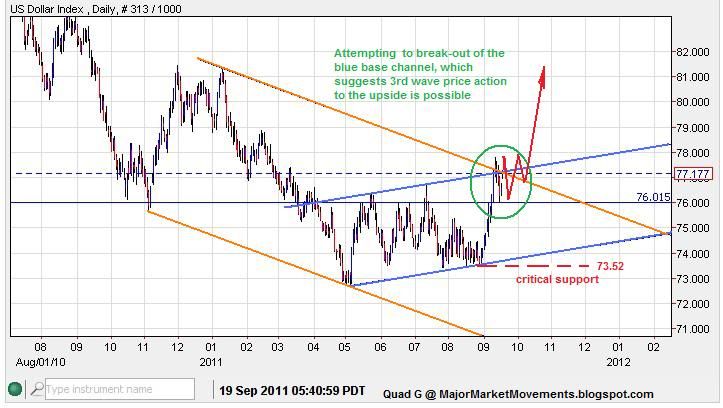
Gold and Silver have both tripped some significant support levels creating this cascade. The plunge in stocks yesterday needed to be greeted with some metals buying as a safe haven, but the lions share went to bonds and cash. Mostly long bonds because it is the one asset class that is guaranteed a buyer (The Fed) with a 400 billion resuscitation of Operation Twist. However, this 'gimmick' does not expand the FEDs balance sheet as would QE3. So the net affect is zilch for monetary base expansion. Yes, interest rates may be forced down a bit more, credit may become cheaper still for a while, but it's all artificial. And if few are unwilling or unable (no job) to use such cheap credit......then what good is it? We saw yesterday with the FEDs policy that they intend to protect the bond market above all else, even at the expense of deflation. The 'Student' of the Great Depression (Bernanke) may now very well be schooled by the 'Greatest Depression'. Looks like his helicopter is in for repairs, at least his maintenance crew will have a job.

This will be a running report through the morning, I'll start with first things first (gold) and then add more as I prepare each report.

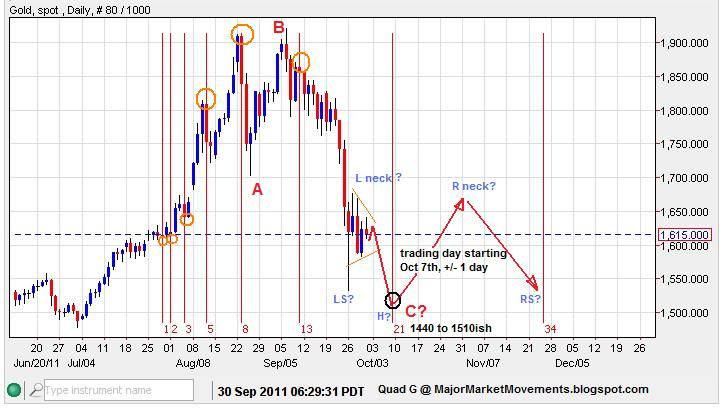
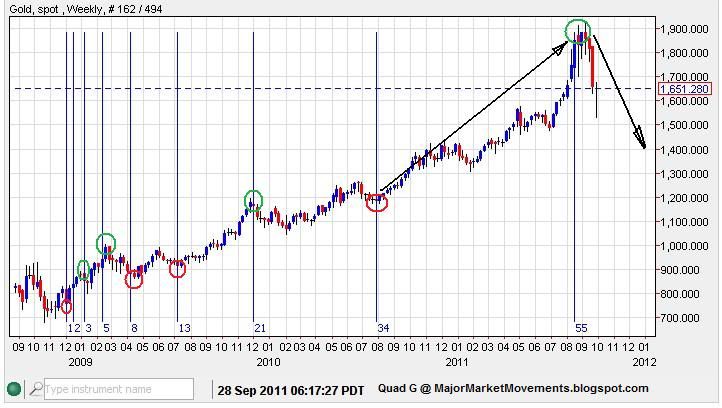
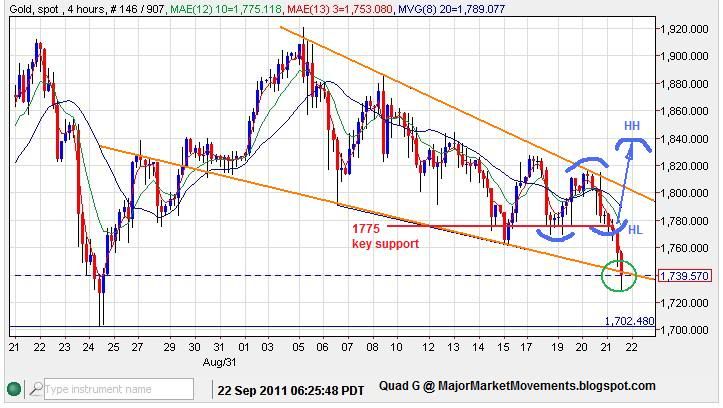
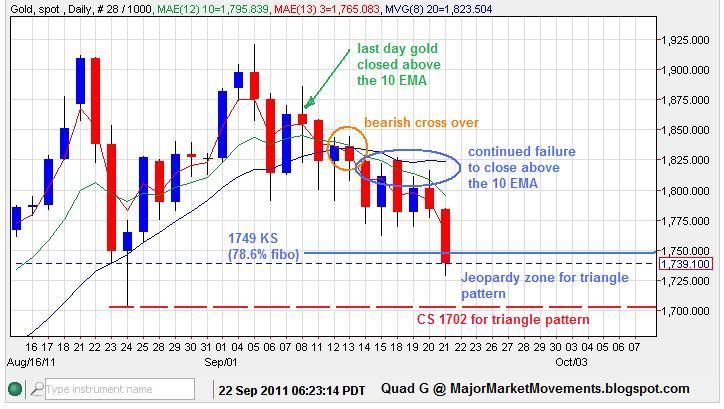
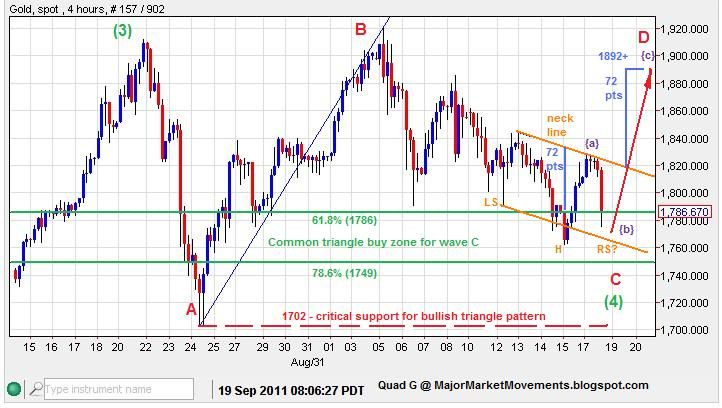
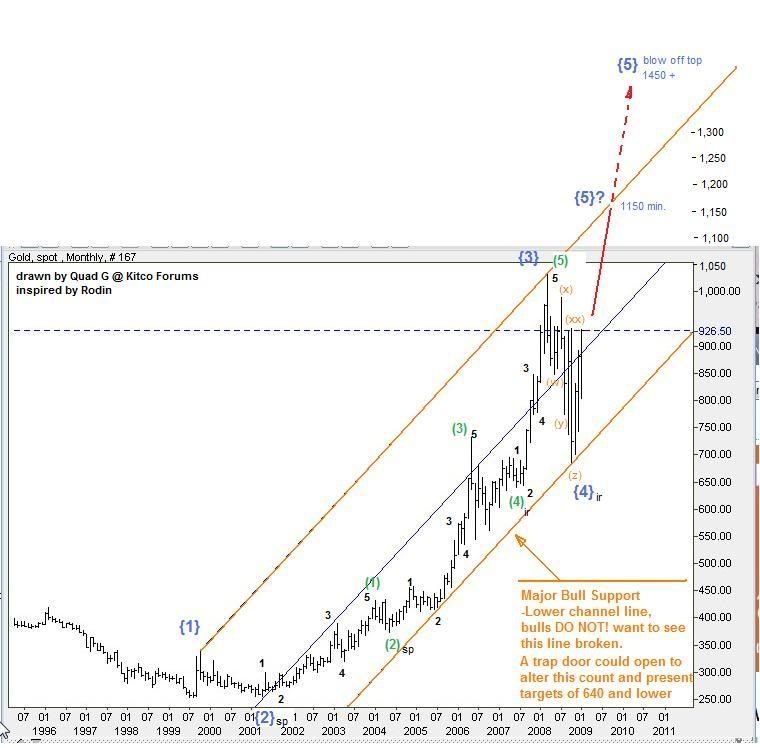
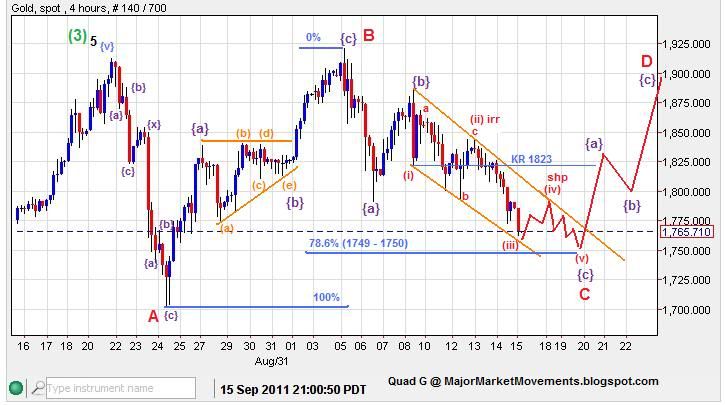
Gold - Previously I labeled 1775 as key support for PoG and here is why:


Gold had been in a long series of lower-highs and lower-lows. However gold had a chance of breaking out of that bearish pattern if PoG could produce a higher-low at about 1775 and then proceed to make a higher-high above 1817. But with passing below 1775 and then the previous swing low at 1770, the previous bearish pattern is reinforced with dramatic affect. With PoG puncturing the lower orange trend-line, the pattern is now one of a 'bleeding edge' which is typically very bearish. Many stops were likely below that descending trend-line and are being taken out in one swift stroke.

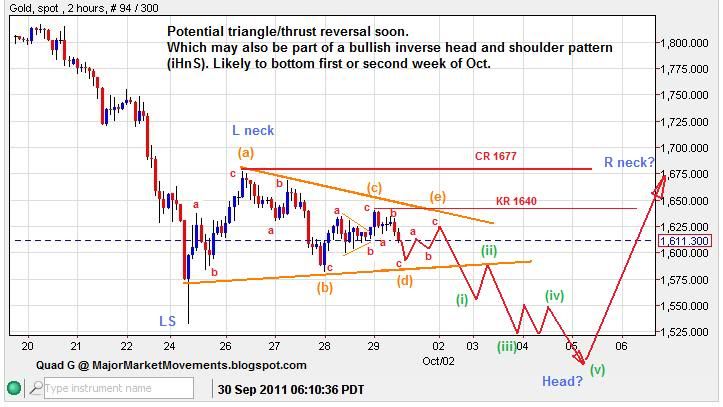
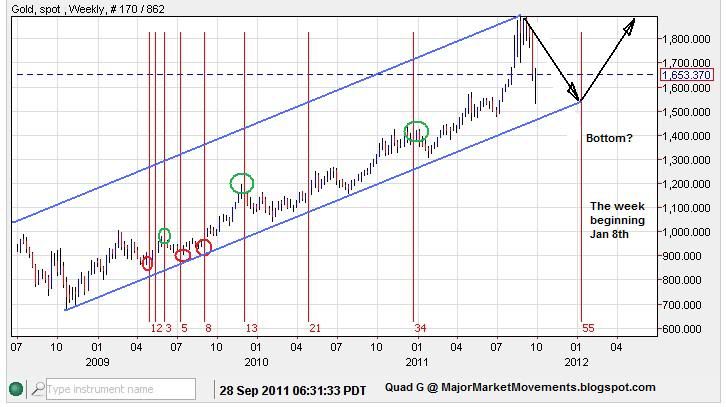
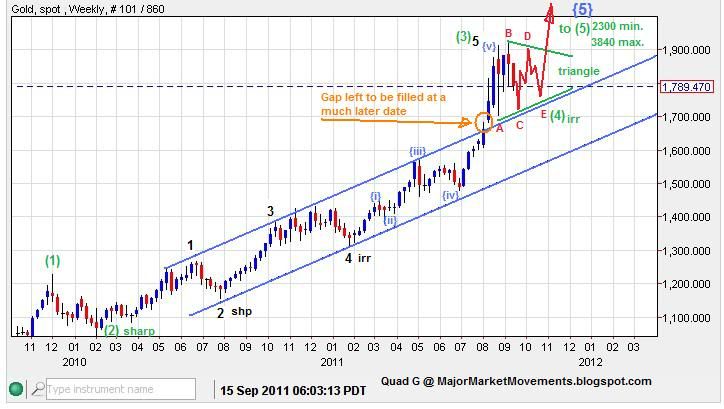
The triangle pattern is not dead but in jeopardy with price between 1702 and 1749:


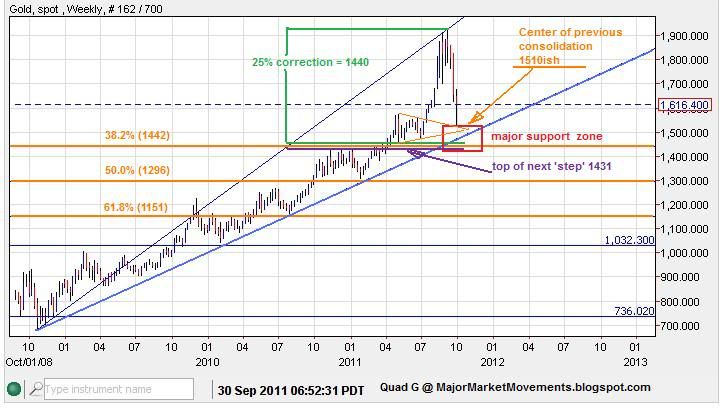
If 1702 is taken out then the Bullish triangle is broken, EW rules do not allow wave C to fall below the extreme of wave A (1702). If this happens, then this correction could become much larger, possibly moving into the 1478 to 1575 range, with some support levels in between.

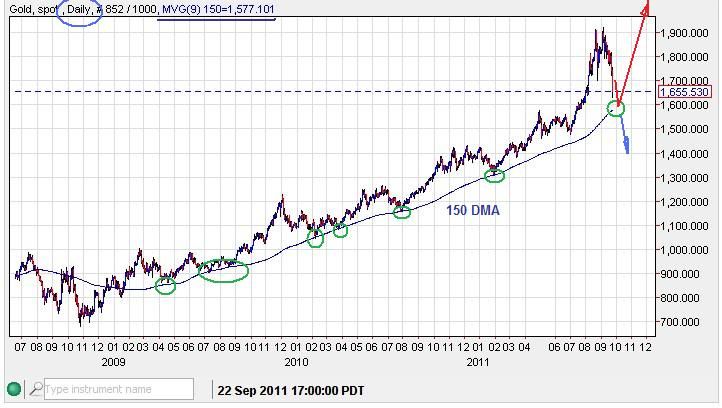
The 3/10/20 ribbon has been in a MT bearish mode. Generally, MT long positions are exited, reduced and/or hedged when this occurs. Then another set of ST positioning (generally smaller is size) is then used for bottom picking. This bearish alignment will persist as long as daily closes remain below the 10 EMA and 20 DMA. So far we have had several days of closes below the 10 EMA.

From a candle-stick perspective, a daily close today back up above 1770 would suggest a bullish snap-back rally.

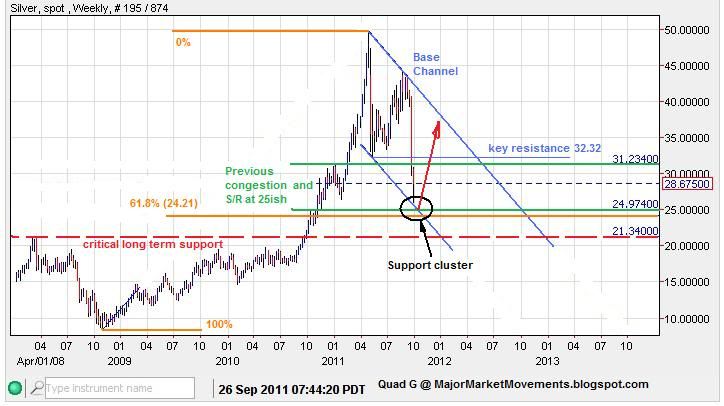
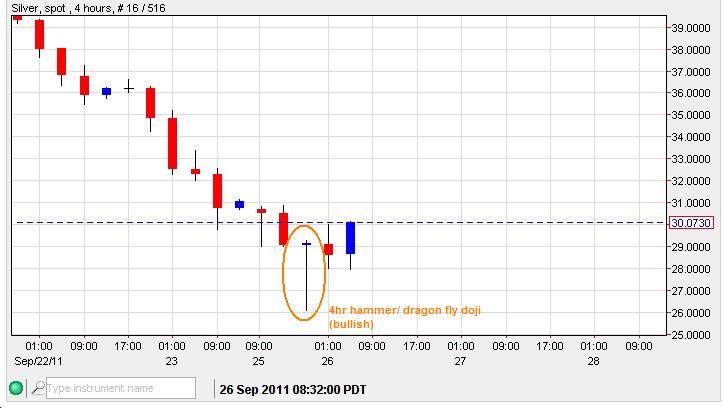
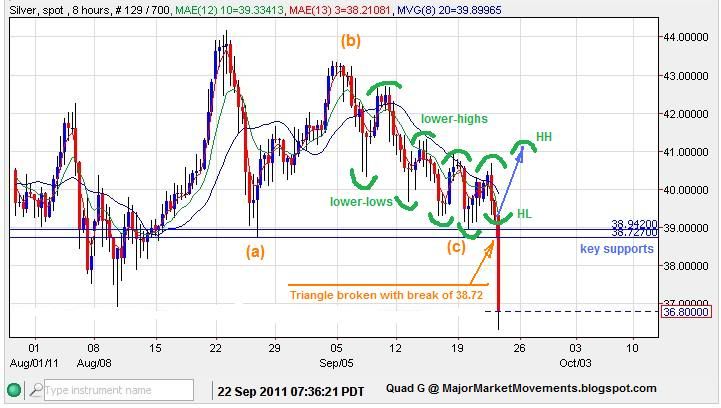
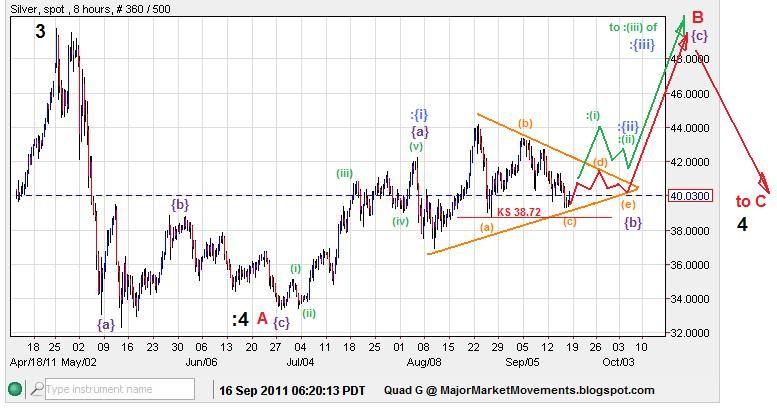
Silver - The bullish triangle pattern that was competing with a bearish HnS pattern has lost the fight with a move below 38.94 and 38.72:


As you can see we had a long series of lower-highs and lower-lows, this pattern came right down into critical support for the bullish triangle pattern, a higher-low followed by a higher-high was need to upset the bearish trend before 38.94 was tripped. Didn't happen, the market favored bonds over metals for safe haven buying.

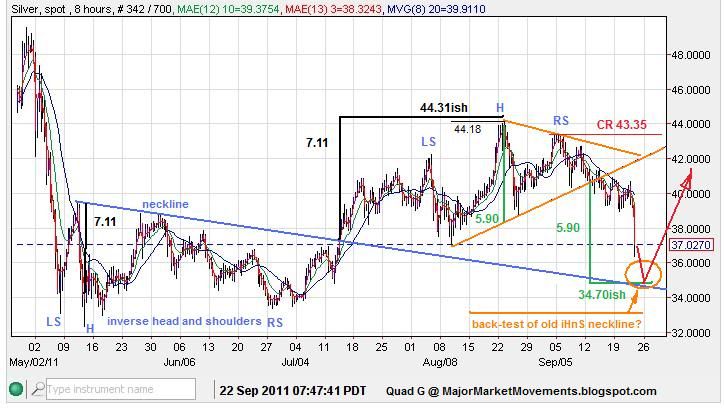
With the triangle count killed, the competing HnS pattern comes back into focus:


The neckline was broken at 40.60, so a $5.90 drop from that level targets 34.70ish
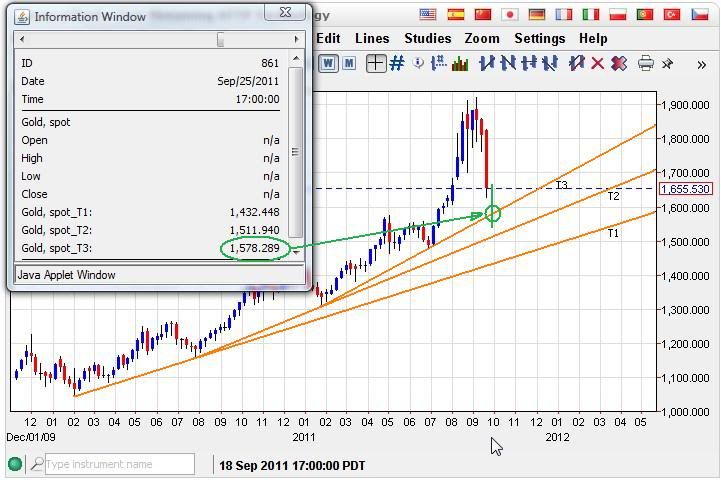
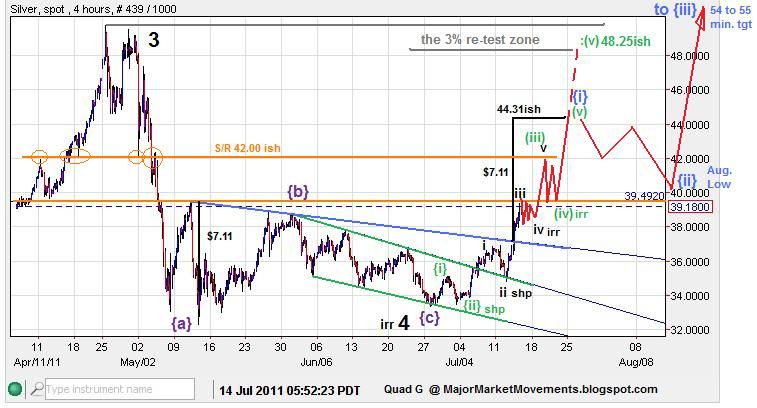
Which just so happens to intersect with the old bullish iHnS neckline, the target of which was recently fulfilled near 44.31 at 44.18. Older chart first, update second:


The back-test of the old iHnS neckline and the projected target of the new HnS are converging over the next few days. This should provide a good level of support. If it fails, then outright capitulation is very possible, and lower-lows below 33.00 are very probable.

The 3/10/20 ribbon is also in a bearish alignment. A snap back rally above 38.72 would be very Bullish, but seemingly unlikely.

Also review my recent article:
http://majormarketmovements.blogspot.com/2011/09/silver-in-tedious-neutral-zone.html

BKX (Banking index)- I recently mentioned that the index was in a diamond pattern that is likely a continuation pattern, here is the chart depicting that call:


Also notice what I have also mentioned previously, when a market is in a bearish trend the intermediate rallies often fail when the RSI moves into the 50 to 60 range (blue lines). Most stock indicies with exhibit the same behavior. The 50DMA crossed over the 200DMA, AKA the 'Death Cross' an early warning that a steep slide was possible.

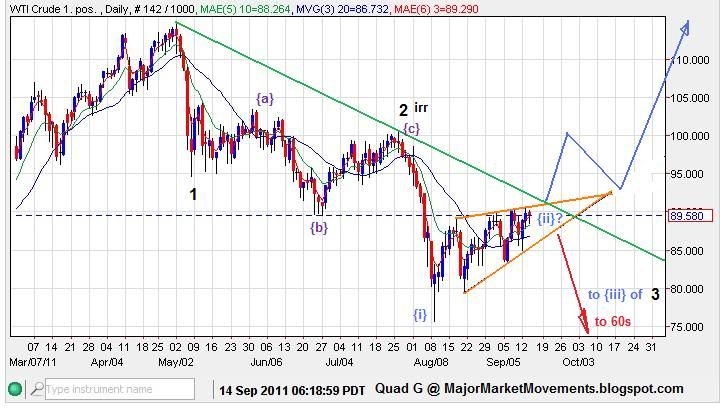
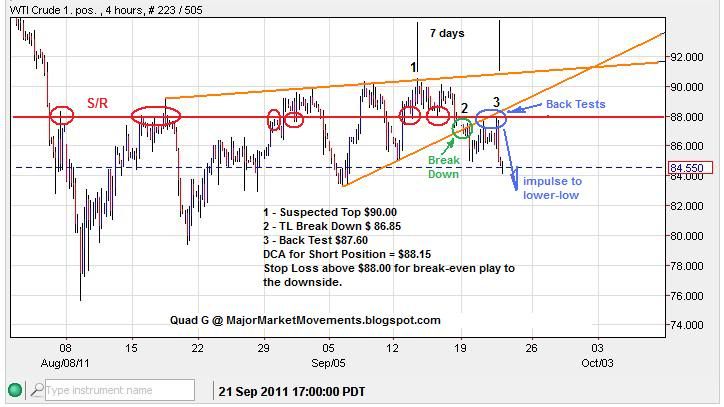
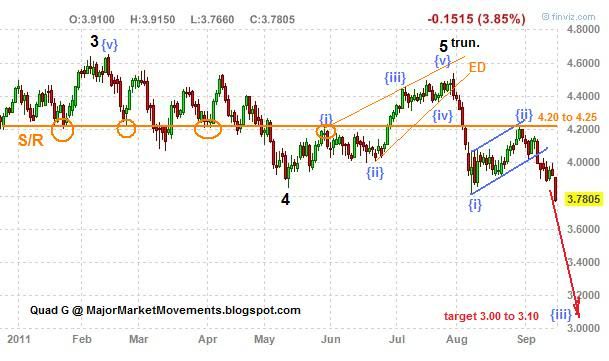
Crude - Has moved precisely as anticipated, giving a very easy entry into a short position. Here is the previous chart for reference:


Here is the update (chart was made last night, price is now near 81.00):


Using a 3 position, Dollar Cost Averaging (DCA) process over the course of 7 days, a relatively low risk short entry near $88 could have been produced using key points along the trend.

Crude is now on a course to a potential target of 60ish in the ST. But keep in mind that major war in the middle east could erupt soon, possibly upsetting the wave count. Crude clearly bearish while below 84.93.

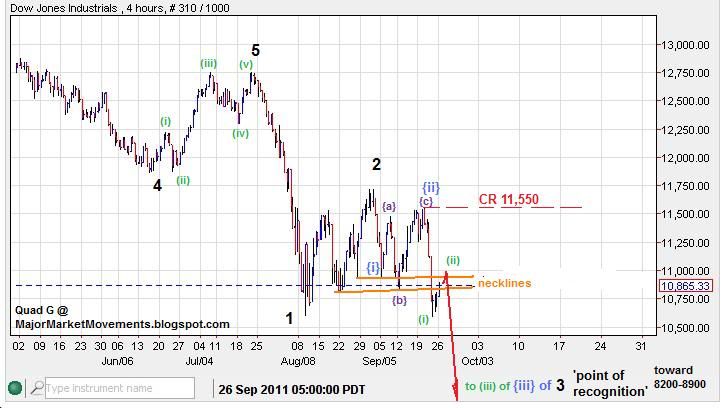
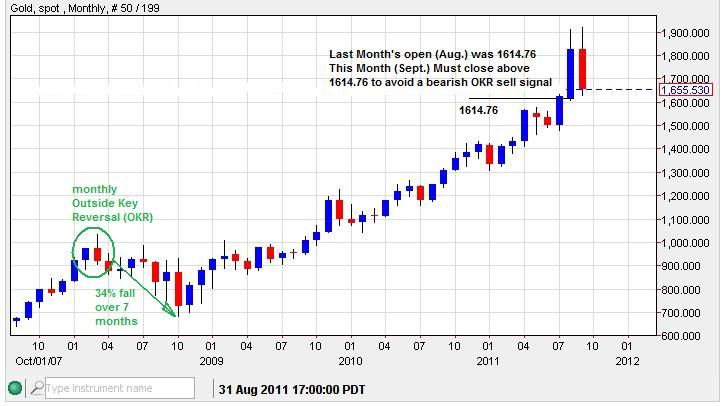
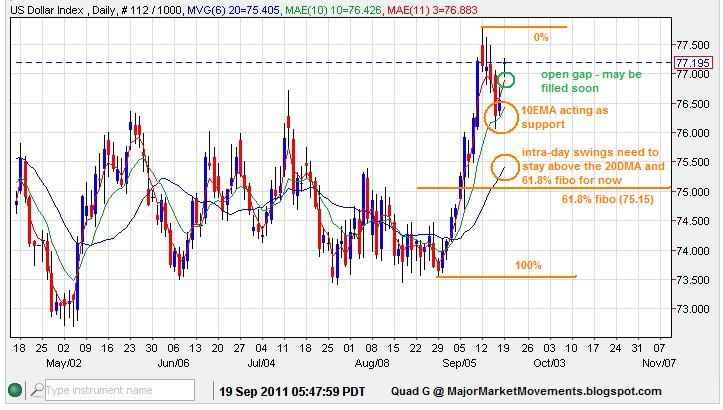
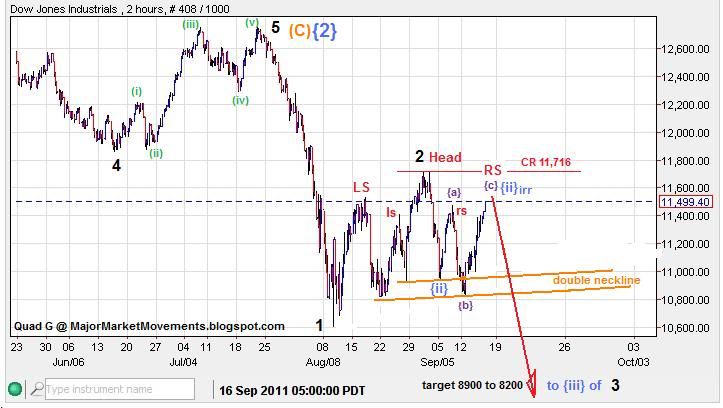
Dow - Has broken the double neckline that I posted recently as anticipated. A weekly close tomorrow below 10,990 will post a bearish outside key reversal on the weekly. BAC has hit the 6.00 level this morning, clearly bearish while below 6.50 at this point.

I have to go take care of other priorities, but will be monitoring the situation through out the day.

All the best.


...

Tuesday, September 20, 2011

MMM - Mid-day update 9/20/11

Gold - Produced a double bottom last night at 1769, I saw the return and sent an alert, but I doubt few received it in time. Basically it was a second chance for the night owls to get in at the prescribed buy zone. Gold looking ST bullish while above 1775. A daily close at or above 1823 today would be a bullish step to lock in this wave C bottom, but must keep above 1775.

Silver - The call for a double zig-zag bottom is still good from yesterday at 38.94, just a few cents above key support at 38.72 for a low risk entry. The Short Term (ST) key support is now brought up to 39.17, A drop through that level in the next 24hrs could spell trouble for any more ST advances to the upside.

HUI - The bounce off support (584) that I called on Sept 15th is now critical ST support for further uptrend. I still suspect that a target of 700 can be reached soon.

Natgas - I see what appears to be a triangle/thrust pattern to the downside, if so a reversal may be in the cards. A move back up above 4.10 this week should confirm the reversal pattern. This 3.70 to 3.85 area is an important support zone, dropping below invites much more selling.


Dow - Moved into a higher-high, killing my top call on Friday. However, the Bearish SsHsS (Head and double shoulder) pattern is still intact while the Dow is below 11,716. Take note that the financials (BKX)and the small caps (Russel1 2000) are not making higher-highs, and Copper is still caving as expected. A sign that investors are not in a serious risk-on mode at this time. The daily Bollinger Bands are producing a pronounced 'pinch', which usually suggests that a strong impulse is about to emerge. I still suspect that impulse will be to the downside, but if the bands instead start to be pushed to the upside as they widen again, then I am likely wrong and the impulse will instead continue higher.

USD - Attempting to fill in part of the aforementioned gap from the start of the week. That gap fill whether full or partial could be finished in the next 24hrs.

Crude - One more daily close below the 20DMA (87.45) will likely put the 3/10/20 ribbon in a MT bearish alignment.

It's been a crazy day for me, I'll post charts when I am able. Tomorrow is the big FED day, stock jocks appear to anticipate a grand liquidity dump from the FED, we'll see.


...

Monday, September 19, 2011

Morning Coffee with Quad G - 9/19/11

Mornin' or noon by now!

Gold - There is the potential for a bullish inverse head and shoulder (iHnS) pattern in the ST if PoG can stay above 1762.46. Here is what is would look like:


The 61.8% and 78.6% fibo retrace levels often provide a buy zone for wave Cs that are part of a suspected triangle. PoG has entered that zone a second time. Moving below the 78.6% level puts the triangle pattern in jeopardy, but does not kill it unless price moves below the level of wave A, in this case 1702.

Silver - Still inside a bullish triangle pattern while above 38.70. A double zig-zag pattern can be observed moving down from 43.35 in early August, a move back above 40.90 soon should confirm the end of the double zig-zag for wave C. If 38.70 is taken out however, then the Bullish triangle is disrupted and much further downside is possible, a zone from 34.00 to 37.00.

USD - The dip last week appears to be part of a wave 2 down corrective pattern. The opening gap this week may be filled before proceeding higher into a 3rd wave up.


USD might fiddle with a convergence of channel lines before moving higher:


Key Supports are at the 20DMA and the 61.8% fibo level. Moving below these levels would put further upside potentials in jeopardy. So far the 10EMA has been lending support while the 3/10/20 is in a Bullish alignment. When the 10EMA acts as support, the trend is usually in an larger impulse to the upside.


Copper - I have mentioned before that copper was bearish while under 4.25 and that lower-lows were likely in the works. Here are the reasons why:


Looks like wave 5 truncated in an ending diagonal with an impulsive drop off producing a potential 'copper top' for the stock market. Wave {ii} up was clearly a 3 wave corrective pattern up right into the Support/Resistance (S/R) zone between 4.20 and 4.25. As you can see the 3 wave pattern stayed inside the base channel (blue), text book 3 wave correction. This provided a very low risk shorting opportunity of a few cents, very rare for the copper market to see such a low risk entry. Now the potential for a third wave down could target 3.00 to 3.10 very soon.

Crude - From previous reports I warned of a break down below the bearish ascending wedge pattern while below the green trend-line. Price of Oil (POO) has put a toe over the lower wedge boundary today:


Dow - I called a top early on Friday, and it looks like it's going to hold. However a gap down this morning may see at least a partial fill before proceeding lower. A daily close today below 11,247 would produce an inside double close key reversal pattern, very bearish. Such a move should lock in the right shoulder of this pattern I showed last week:


There is an abundance of technical evidence that a deflationary juggernaut is about to break down the markets. I'm sure that the Central Banks (CBs) are clearly aware of these technical pictures. They need to turn on a fire hose of liquidity soon to prevent this from happening. A shock and awe amount of liquidity, piddly amounts are not likely to be enough.


...

MMM Weekly Round Table Discussion 9/19/11 to 9/25/11

There is a new entry on the calendar this week. Also a highly awaited FOMC meeting this Wednesday the 21st at 11:15PST. The FED needs to come out swinging at this meeting. I suspect that if the FED instead gives another milk-toast announcement the stock market may crumble. I think the market wants to see another massive easing program, something bigger than QEII (600billion).

Pull up a seat to the round table! Tell us what you think or ask a question.

I will respond to this discussion faster than to comments left at other blog entries. I will also leave short updated comments and alerts at this section. You can sign up for comments to be sent by email, found at the sidebar.

The Calendar and Round Table links can be found at the top of the side bar.

All the best!

...

Friday, September 16, 2011

Morning Coffee with Quad G - 9/16/11

Mornin' all,

Dow - This chart depicts the bearish head and double shoulder (SsHsS) pattern that I mentioned earlier and the latest ST EW count:


This count and SsHsS pattern is dead if the Dow moves above 11,716. When in doubt, get out.

Silver - You have seen my bearish point of view recently, However the required behavior has not revealed itself so far. This lends to the possiblity of a bull count that looks like this:


This count has two different possibilities that both need silver to remain above 38.72 or the count changes.

The red projection would see a triangle play out for a few more weeks as a wave {b} of B, then launch higher into wave {c} of B to challenge the all time high near $50. Followed by a wave C pull back toward the price territory of the previous triangle.

The Green projection which is far more bullish could play out if an immediate 5 wave impulse is observed back above $44.00 as wave (i) green. This type of move would favor the alternate count (: colon) which would see a potential 3rd of a 3rd advance that should easily cross the $50 barrier much sooner than later.

All the best!


...

Gold - Update 9/16/11

Here is the oldest chart that has been a basic guide for the structure going forward since gold was in the 900s back in early 2009, calling for a potential target of 1450+ back then:


And it has since evolved over time:


Now here is the latest LT count update:


The parabolic base trend-lines (orange) continue to arc higher, approaching near vertical, which suggests the final blow-off top is near. If this triangle for green wave (4) plays out, the final 5th is likely to be seen in the final months of the year. Target Minimum 2300, target maximum 3840.

Here is a zoomed in view of the count depicting the triangle wave (4) idea:


Wave C red of that triangle is nearing completion in the 1710 to 1786 zone. The 78.6% fib retracement of wave B red (1749ish) is a good possible candidate for a bottom support:


This ST chart gives an idea of what the structure might look like. Once PoG climbs back above 1823 (Key Resistance), the Wave C low should be locked in. Wave C red of the triangle count should be the lowest low before the wave (5) blow-off into 2300 to 3840.

This triangle count is dead if PoG moves below the extent of wave A red (1702). Also moving back into the previous channel (blue) would be bearish.

Please remember these are Elliot Wave counts. This is not fortune telling, it is not a crystal ball. EW gives a very dim view of what might be inside a set of parameters. If those parameters are violated then the count dies and another must be formulated that could be radically different. EW is very scientific but also artistic, it requires a bit of imagination, subjective thought and experience. EW is but one tool of many. Please DYODD when considering investments.


...