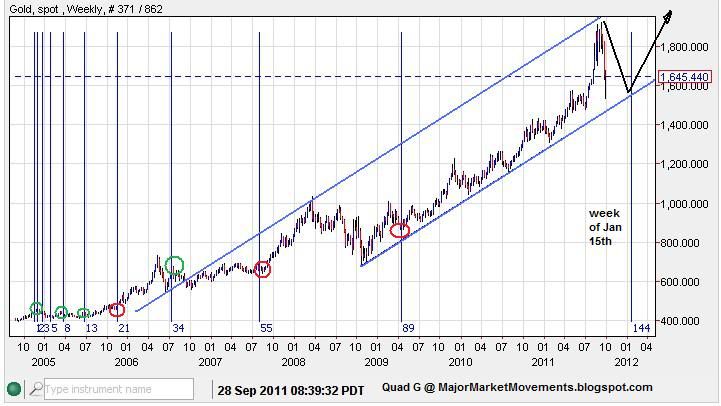
Here are the older charts:
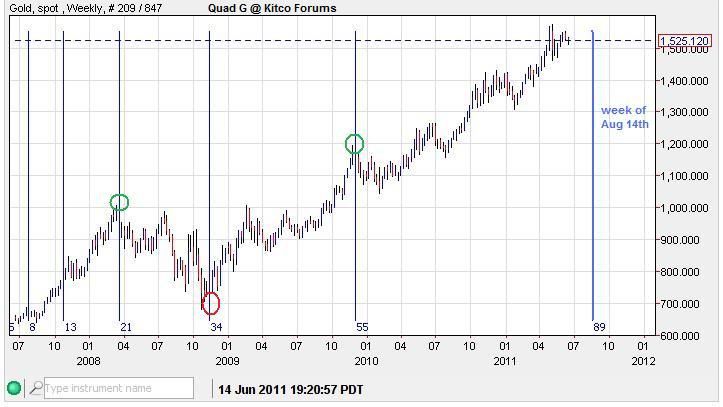
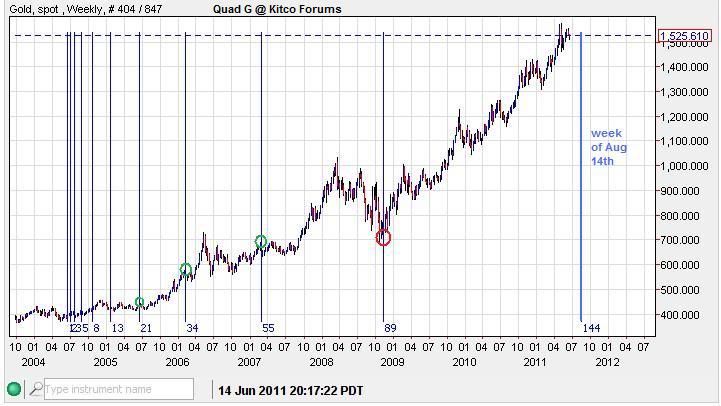

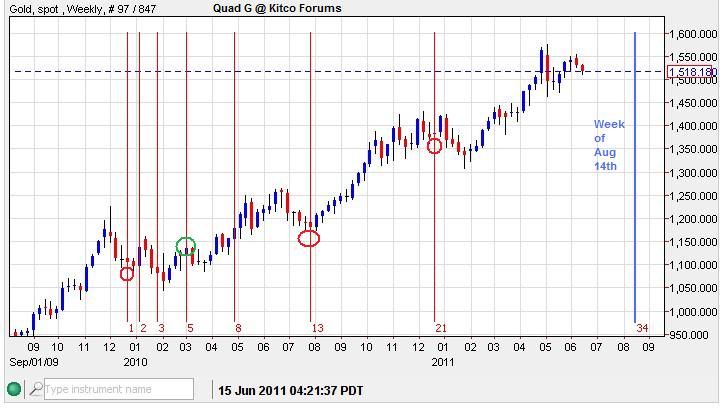
As the week of the 14th came closer, some daily fibo alignments became apparent and pointed to a turn date window of August 18th +/- 1 trading day:
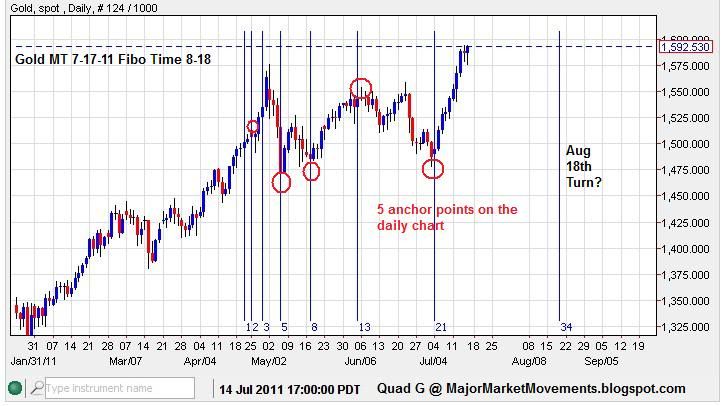
This is a relatively large cluster of time fibos that have pointed to the same time period, thus it's significance was likely to be just as large. Originally I was looking for a trend down or sideways into that date, so that a larger rally would erupt. However, as you will see in a moment the trend moved strongly up into the turn window. This could mean only one thing, that a significant top was likely to form for at least several weeks.
Here is the updated outcome so far:
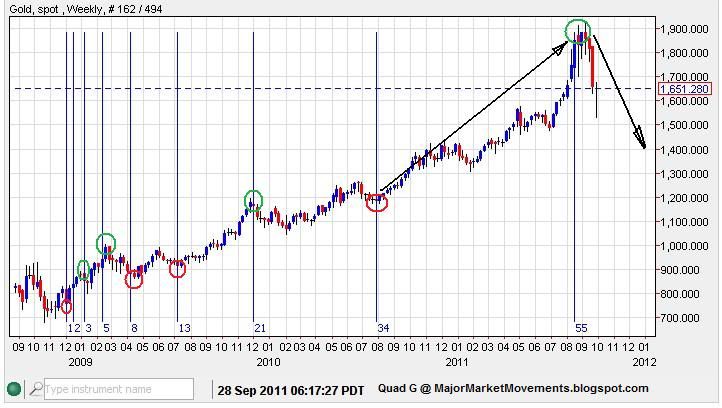

The trend was certainly up into these turn date windows, so the resulting trend is certainly down for at least several weeks if not months. This is very likely to invert the cycle that I was originally looking at. Since we saw an August high instead of a low, the high what I was looking for in January '12 may actually be a low.
Here is a new set of weekly time fibos that roughly point to a time period between the last week of December and the second week of January:

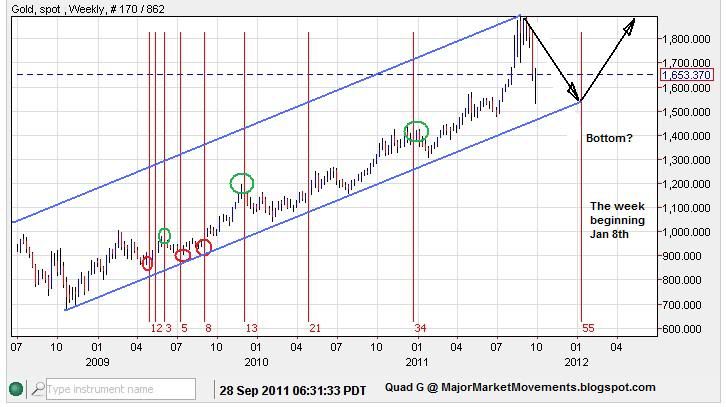
If PoG can stay within the long term up channel (blue) over the next few months into the late December to mid-January time frame, moving in a choppy sideways manner, I think another major bottom could be produced for another large surge higher into 2012. As time approaches this weekly span, I will be able to use the Time fibo tool in the daily time frame to perhaps nail down a more specific turn date. It should be noted that a major Bradley turn date is set for December 28th also.
...