Mornin' all,
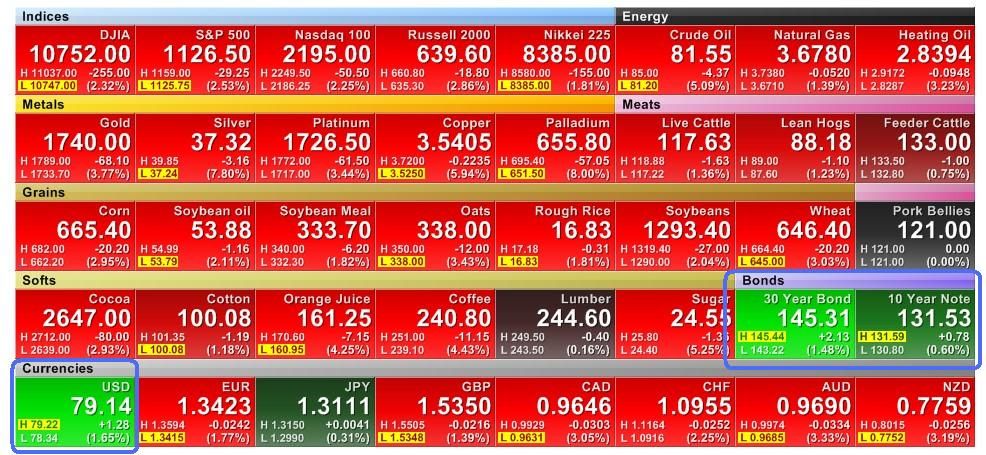
Yesterday displayed a classic deflationary picture, all asset classes down except bonds and cash (USD), the continuation can be seen this morning:
Gold and Silver have both tripped some significant support levels creating this cascade. The plunge in stocks yesterday needed to be greeted with some metals buying as a safe haven, but the lions share went to bonds and cash. Mostly long bonds because it is the one asset class that is guaranteed a buyer (The Fed) with a 400 billion resuscitation of Operation Twist. However, this 'gimmick' does not expand the FEDs balance sheet as would QE3. So the net affect is zilch for monetary base expansion. Yes, interest rates may be forced down a bit more, credit may become cheaper still for a while, but it's all artificial. And if few are unwilling or unable (no job) to use such cheap credit......then what good is it? We saw yesterday with the FEDs policy that they intend to protect the bond market above all else, even at the expense of deflation. The 'Student' of the Great Depression (Bernanke) may now very well be schooled by the 'Greatest Depression'. Looks like his helicopter is in for repairs, at least his maintenance crew will have a job.
This will be a running report through the morning, I'll start with first things first (gold) and then add more as I prepare each report.
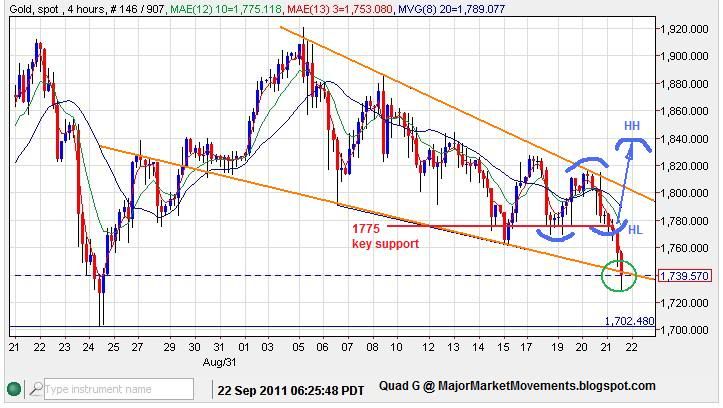
Gold - Previously I labeled 1775 as key support for PoG and here is why:
Gold had been in a long series of lower-highs and lower-lows. However gold had a chance of breaking out of that bearish pattern if PoG could produce a higher-low at about 1775 and then proceed to make a higher-high above 1817. But with passing below 1775 and then the previous swing low at 1770, the previous bearish pattern is reinforced with dramatic affect. With PoG puncturing the lower orange trend-line, the pattern is now one of a 'bleeding edge' which is typically very bearish. Many stops were likely below that descending trend-line and are being taken out in one swift stroke.
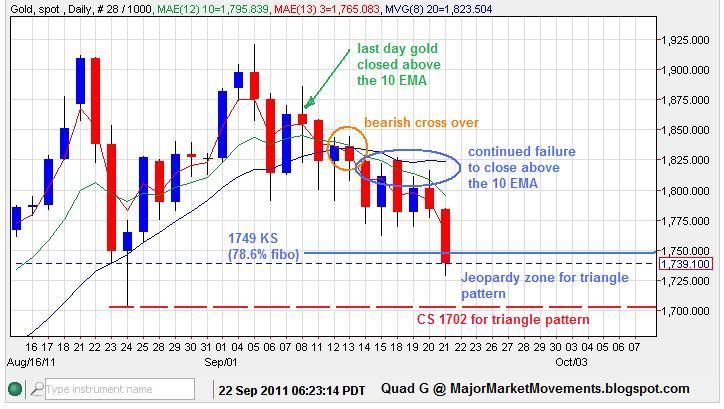
The triangle pattern is not dead but in jeopardy with price between 1702 and 1749:
If 1702 is taken out then the Bullish triangle is broken, EW rules do not allow wave C to fall below the extreme of wave A (1702). If this happens, then this correction could become much larger, possibly moving into the 1478 to 1575 range, with some support levels in between.
The 3/10/20 ribbon has been in a MT bearish mode. Generally, MT long positions are exited, reduced and/or hedged when this occurs. Then another set of ST positioning (generally smaller is size) is then used for bottom picking. This bearish alignment will persist as long as daily closes remain below the 10 EMA and 20 DMA. So far we have had several days of closes below the 10 EMA.
From a candle-stick perspective, a daily close today back up above 1770 would suggest a bullish snap-back rally.
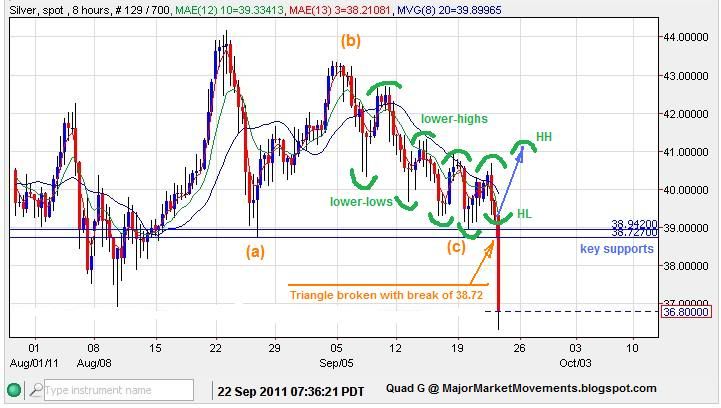
Silver - The bullish triangle pattern that was competing with a bearish HnS pattern has lost the fight with a move below 38.94 and 38.72:
As you can see we had a long series of lower-highs and lower-lows, this pattern came right down into critical support for the bullish triangle pattern, a higher-low followed by a higher-high was need to upset the bearish trend before 38.94 was tripped. Didn't happen, the market favored bonds over metals for safe haven buying.
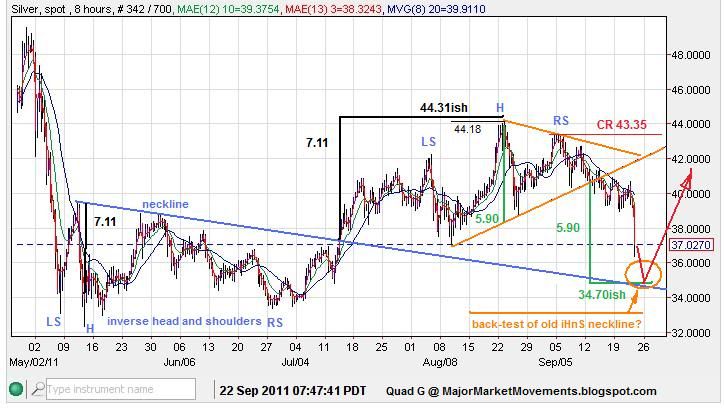
With the triangle count killed, the competing HnS pattern comes back into focus:
The neckline was broken at 40.60, so a $5.90 drop from that level targets 34.70ish
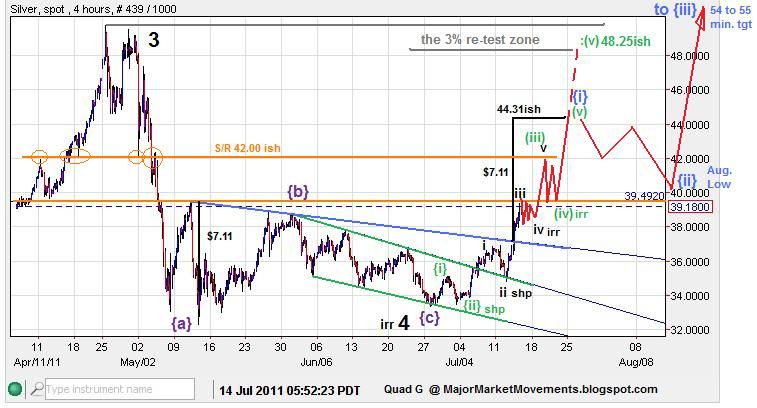
Which just so happens to intersect with the old bullish iHnS neckline, the target of which was recently fulfilled near 44.31 at 44.18. Older chart first, update second:
The back-test of the old iHnS neckline and the projected target of the new HnS are converging over the next few days. This should provide a good level of support. If it fails, then outright capitulation is very possible, and lower-lows below 33.00 are very probable.
The 3/10/20 ribbon is also in a bearish alignment. A snap back rally above 38.72 would be very Bullish, but seemingly unlikely.
Also review my recent article:
http://majormarketmovements.blogspot.com/2011/09/silver-in-tedious-neutral-zone.html
BKX (Banking index)- I recently mentioned that the index was in a diamond pattern that is likely a continuation pattern, here is the chart depicting that call:
Also notice what I have also mentioned previously, when a market is in a bearish trend the intermediate rallies often fail when the RSI moves into the 50 to 60 range (blue lines). Most stock indicies with exhibit the same behavior. The 50DMA crossed over the 200DMA, AKA the 'Death Cross' an early warning that a steep slide was possible.
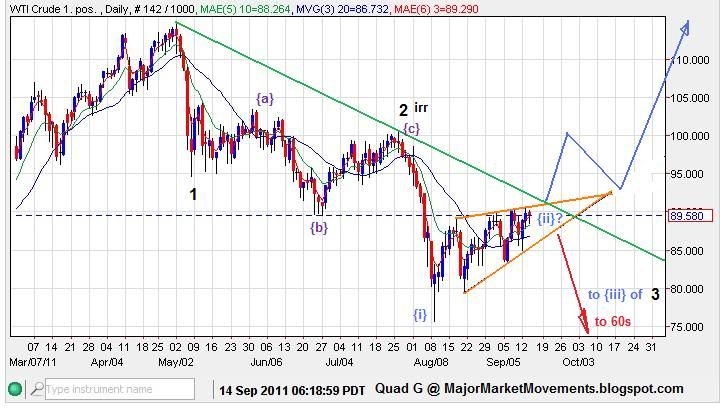
Crude - Has moved precisely as anticipated, giving a very easy entry into a short position. Here is the previous chart for reference:
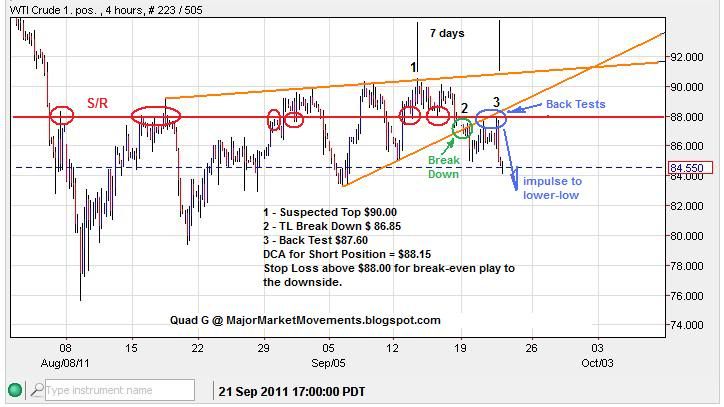
Here is the update (chart was made last night, price is now near 81.00):
Using a 3 position, Dollar Cost Averaging (DCA) process over the course of 7 days, a relatively low risk short entry near $88 could have been produced using key points along the trend.
Crude is now on a course to a potential target of 60ish in the ST. But keep in mind that major war in the middle east could erupt soon, possibly upsetting the wave count. Crude clearly bearish while below 84.93.
Dow - Has broken the double neckline that I posted recently as anticipated. A weekly close tomorrow below 10,990 will post a bearish outside key reversal on the weekly. BAC has hit the 6.00 level this morning, clearly bearish while below 6.50 at this point.
I have to go take care of other priorities, but will be monitoring the situation through out the day.
All the best.
...
