A break out above 77.80 would likely see another thrust up to USD's old stomping grounds between 78.75 and 81.45. This zone would likely be the best place to find a ST top with a multi-week correction to follow. We'll see, one step at a time.
Gold - Currently experiencing some resistance below the 10 EMA (1838)and a descending trend-line right now above at 1833. Even though the ST may see a bit more bearishness below these levels. The MT picture is looking better everyday. The more that price action coils between 1702 and 1920, the greater the upside potential will be with a near future break-out to the upside. Here is a look at the Gold chart in 1979 to 1980:
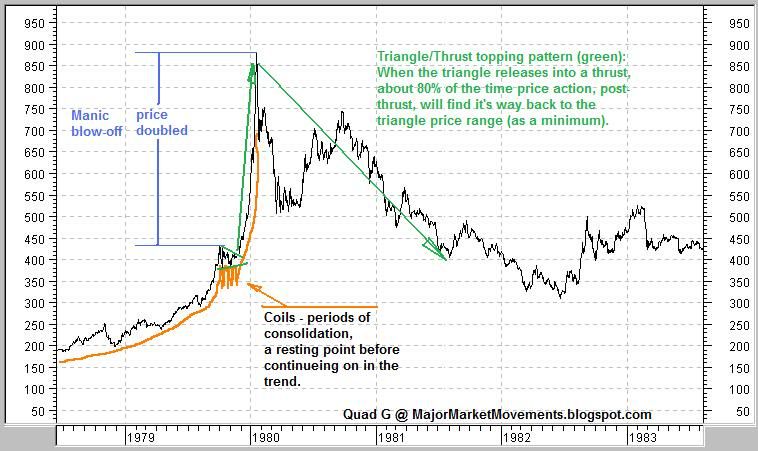
Is PoG setting up the same type of move 32 years later?
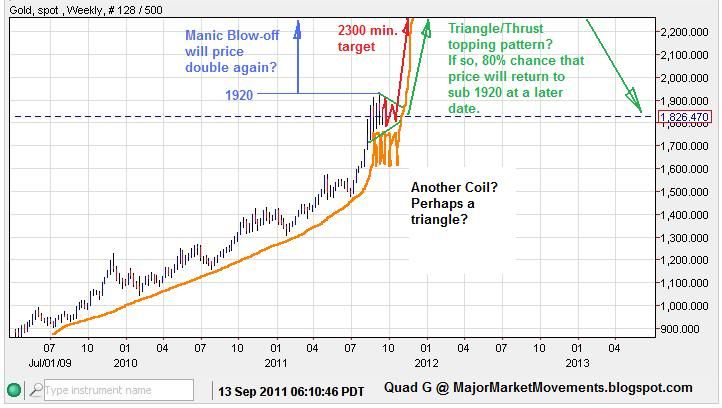
A fractal repeat of 1980's historic top would suggest gold could double the price at 1920, producing a potential blow-off target of 3840 with in a few short months. However, the Triangle/Thrust pattern suggests that no matter how high gold might climb returning to sub-1920 has a roughly 80% chance.
Silver - A daily close today under the 10 EMA (currently 41.34) will produce a bearish cross over in the 3/10/20 ribbon. Price would need to close above the 20DMA (currently 41.54) to reverse this bearish trend. Price action has tripped the neckline of a bearish HnS, which was back-tested over night near 41.00. However, impulse moves to the downside have yet to be seen. I would say that a daily close today above the 10 EMA could be enough to cancel the bearish HnS pattern.
Soybeans - They have back tested the previous break-out with a move back to 1380 to 1400 as anticipated. A successful back test should see price rise up quickly out of this zone heading toward higher-highs above 1460. There is also an open gap between 1413 to 1424 that may want to be filled. If price falls below 1365-1370 (roughly the 50% retracement level), then the upside potential is in jeopardy, not dead but in trouble.
Dow - That triple gap area is still open above between 11,170 and 11,295. I suspect that this gap could be filled this week, which would be good for the over all downward trend. The 3/10/20 ribbon has a bearish cross-over and will remain that way with daily closes below the 10EMA (currently 11,208). The 20DMA (currently 11,242 may cap intra-day extremes), so a complete gap fill may not happen. The gap fill potential will become less likely with a move below 10,824.
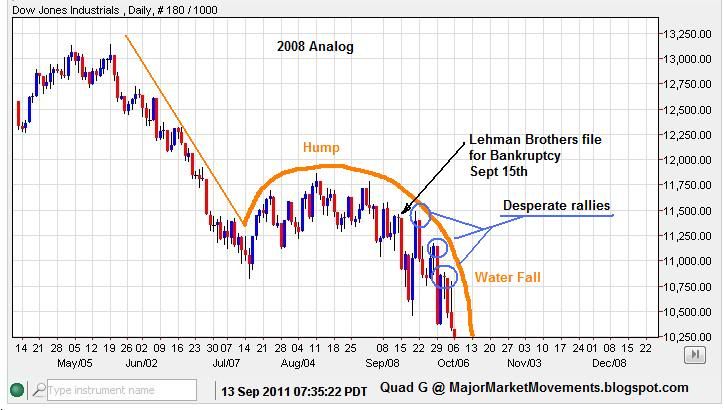
Take a look at the pattern just before the grandest dump in 2008:
And compare it to the action so far in 2011:
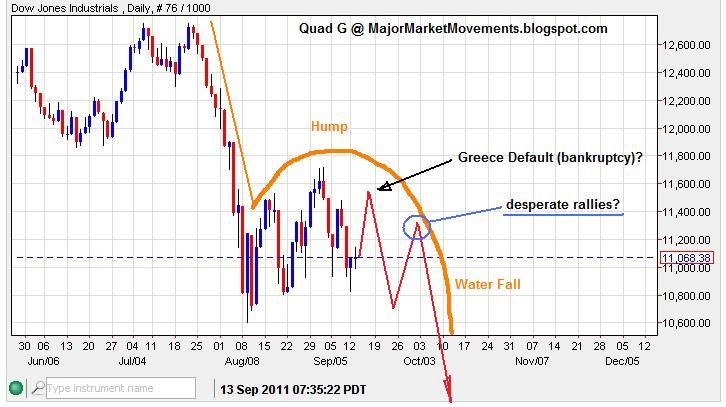
Similar undulations could be seen just before the market vomits another 25% soon thereafter. All part of a potential long term sell off in the Dow to sub-3000 by 2015 to 2016.
LOL!.....Have a nice day.
...