Gold - This should be it's own article but for the sake of time I'm gonna cram it in here. First let's look at a potential triangle/thrust bottoming pattern:
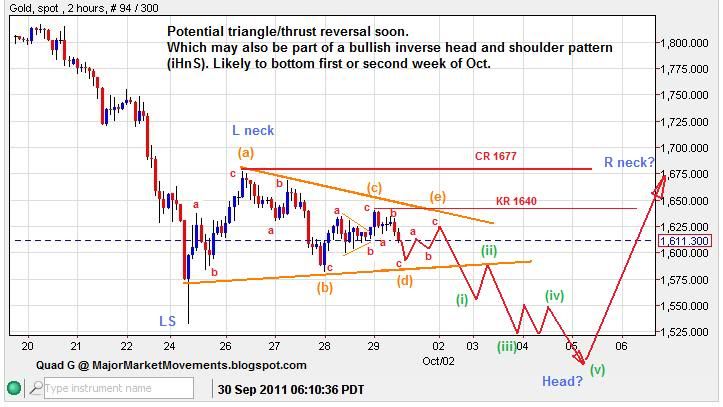
The current ST triangle is fairly mature and could be finished soon with a 3 leg wave (e) up. The resulting 5 wave series to the downside should be a final thrust to a bottom. Then price action should rebound back up into the price territory of the triangle, possibly into a right neck. If Key Resistance (KR) is taken out at 1640, then the triangle, at least as I have it drawn, is incorrect. If Critical Resistance (CR) is taken out then the triangle pattern is dead.
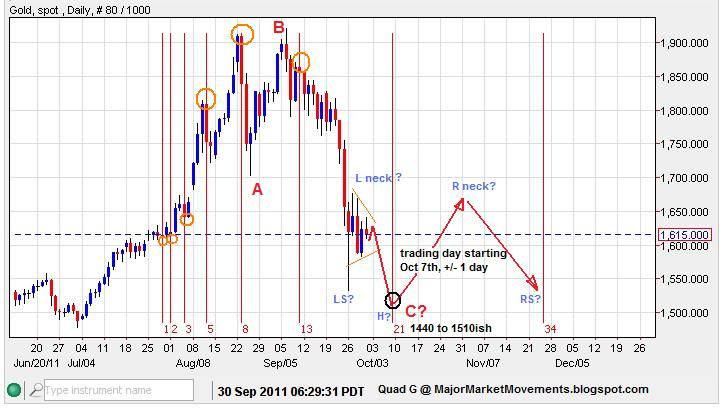
Zooming out and adding a time fibo measure we see that a potential exists for a turn near the trading day starting on Oct. 7th (which is actually 5pm on Oct. 6th).
Zooming out even further to a longer term view, a major source of support is clustered near 1440ish to 1510ish. Now that the 12% to 15% degree of correction area is busted, the 25 to 38% correction zone should be considered. The top of that zone is 1440:
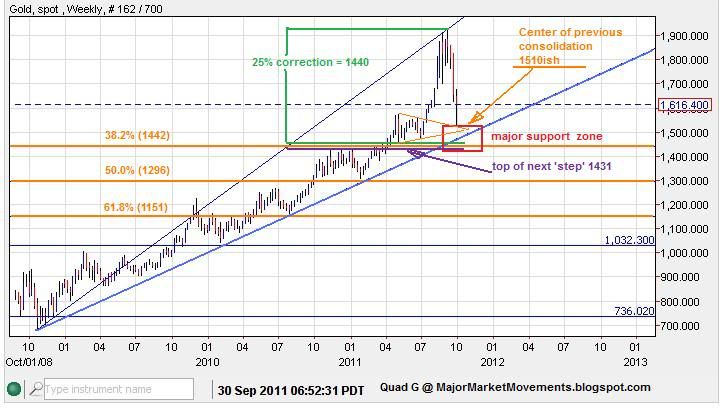
I suspect that this larger correction is part of a 4th wave. I will present an updated EW count that I have in my head at a later time.
Dow - Time for a guessing game! Which one of these Dead Cat Bounces happened in 2008 and which one happened in 2011?
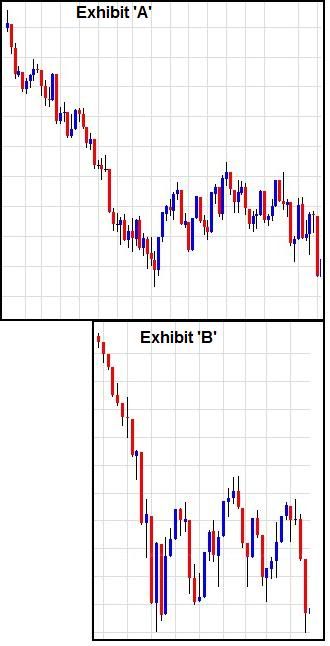
Hint #1: Both of these DCBs occur in roughly the same price area.
Hint #2: Both of these DCBs occur in roughly the same time period but 3 years apart.
Hint #3: The DCB in 2008 eventually led to an almost 28% collapse in the Dow within 8 days.
Hint #4: the Current DCBs top is 11,716 in 2011.
Good Hunting......
...