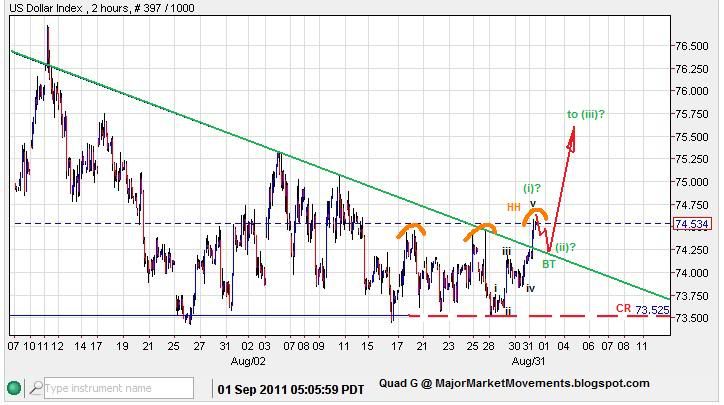
It's possible to count a very truncated 5th wave to the downside as an ending diagonal (ED). The Green trend-line has been broken with a 5 wave impulse to the upside. If this break-out is for real, then a small 3 wave back test (BT) may occur soon and then another surge higher. 73.52 MUST not be broken for this move to play out. If this indeed was an ED 5th wave the resulting impulse higher should be swift and fully retrace the ED, moving up to 76.72 and higher.
I will present the LT Bull count potential in an article soon.
A crash in the stock market will likely send many positions to cash, this creates demand for USD, thus a move higher.
I will not be able to produce the USD article today, but you can get a sneak peek of the charts at my chart archive here: http://photobucket.com/QuadG
Natgas - Been on the hunt for the end of wave (D) and I think there is a good chance that it's finished. Here is the previous article explaining the move:
http://majormarketmovements.blogspot.com/2011/07/natural-gas-still-inside-long-term.html. As I showed in the previous 'Coffee' update, the price seems to be turning just before the actual seasonal turn, The completion of wave (D) may be no different. Here is the update:
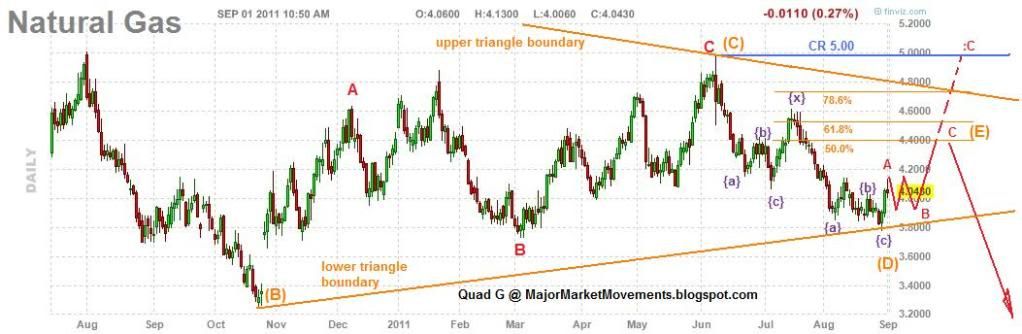
Wave (D) ended near the lower triangle boundary. Seasonal demand should kick in about now and help natgas up into wave (E) as a choppy 3 wave move. Wave (E) should hit a minimum target near the 50% fibo retracement level of 4.40ish. The upper triangle boundary and the 61.8% fibo may also serve as resistance. If natgas moves above the 5.00 level, then the bearish LT triangle pattern is broken and a major bottom could be in place, much further upside is possible in such an event.
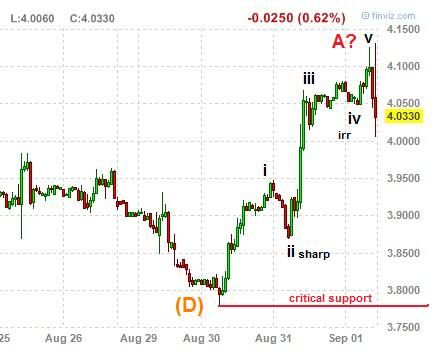
Also, in the ST we can see a nicely formed 5 wave impulse to the upside, 3.78ish is now critical support:
Gold - In the ST I see what could be a bullish barrier triangle, once tripped above 1840, there is enough built-in potential to spring PoG up to test 1900. This bullish triangle is in jeopardy below 1811, and dead below 1775.50. 1800 is also key support. The MT picture is somewhat mixed. I see the potential for PoG to move into a multi-month Bullish triangle pattern as a 4th wave, with a range of up to 12-15% (I think Blister also suggested this possibility). But this correction is still young and thus full of potential surprises.
Dow - Appears to be moving up into a weakening top as expected, right into the resistances previously specified, and just under the daily Bolling Band. A daily close today below 11,532 would signal a reversal. A weekly close tomorrow at or below 11,287 would also signal a reversal and the start of what could be another 15% dive in the market. All part of a LT move in the Dow to below 3000 pts. If the FED wanted to gin up this market, a liquidity dump of another 200pts higher in the Dow could create a sizable short squeeze putting the potential of a major SM crash in jeopardy. Job report comes out early tomorrow before the markets open, the conventional wisdom is that a bad jobs report will unleash the FED to offer QE3 at least by the September meeting.
Join the conversation at the MMM Weekly Round Table discussion here: http://majormarketmovements.blogspot.com/2011/08/mmm-weekly-round-table-discussion-82911.html
Good Hunting.
...