Sunday, April 28, 2013

MMM QG3 Model Portfolio Update 4-28-13

This is an update showing the current performance results of an on going model portfolio using the QG3 trading method which is the primary focus of my Market Signal Service.

Metals Portfolio:


FOREX Portfolio:


100K Model Portfolio:


If you are interested in using the QG3 trading method, I provide QG3 signals as part of my market signal service. Subscribe here for daily email updates: http://majormarketmovements.blogspot.com/p/mmm-market-signal.html

After a 15 day free trial, monthly payments are $20.00 or about $1.00 per trading day.

Past performance is not necessarily indicative of future results.

Quad G


MMM Weekend Update 4-28-13

Gold - There is a technical situation that I have been aware of for a while now that has been reliably accurate in the few instances that I have seen it in the past. Basically when the 3EMA closes beyond the upper or lower Bollinger Band, it's an extreme conditions that is always followed by a correction. I've never seen the condition last more than two sessions before a reversal occurs. There are exception to every technical rule but I have yet to see the exception to this rule.

An example from September 2011:


The latest occurrence:


So far the upside advance has hit a conglomeration of resistance levels from various sources coming tightly together:


The price of Gold has moved up into the Fibo/Full Moon turn date last week. If it is a successful turn date we should see at least 4 (total of 5) more days or more to the downside. If the price moves up above last week's high or 1485.22 then the turn date window is busted and a greater upside surge could be realized, possibly challenging 1600 in very little time.


-----------------------------------------------------------------------------------------------------------------------------

Silver - Is currently wrestling the price inside a 4 point channel. This could be a bullish base channel or bear flag. How the price deals with the 20DMA next week should determine the outcome. A daily close above the 20DMA would suggest an acceleration channel the upside is underway, but must stay above key support at 22.99 (lower channel support).


If this week continues higher and closes next Friday above $25.99, a major Harami reversal pattern will be printed, possibly setting a major bottom at 22.00


I've been teaching my subscribers about the benefits of observing candlestick patterns in the 1hr, 2hr and 4hr time frames and how to trade them effectively. Silver has printed some excellent examples of 4hr candles and their corresponding reactions:


----------------------------------------------------------------------------------------------------------------------------

USD/JPY - Continues to wrestle with the prominent psychological resistance at 100.00. A potentially bullish triangle consolidation pattern underneath 100 threatens to break it soon with a resulting thrust upward into an Ending Diagonal. Such a pattern needs to stay above 95.80. The thrust up has a few measured targets, 101.50ish, 104.20ish and 105.54 (not depicted, 2.618 x wave 1 (8.15)+ wave 1).


The larger pattern is still being fulfilled. My long term bottom call from May 2012 is producing the expected impulsive behavior:


Update:


----------------------------------------------------------------------------------------------------------------------------

EUR/USD - The QG3 continues to produce excellent trading signals. Subscribers were recently signaled to cover shorts to lock in profits in the vicinity of 488 ticks.


---------------------------------------------------------------------------------------------------------------------------

If you are interest in receiving my daily email updates and signals for multiple markets sign up here:
http://majormarketmovements.blogspot.com/p/mmm-market-signal.html

Good Hunting,
QG


Sunday, April 21, 2013

MMM Weekend Update 4-21-13

Gold - Though I understood that a break of 1520 would likely start a run down toward a target zone of 1310 to 1430, I did not expect such ferocity in the sell-off reaching the target zone inside 2 days. This run also violated the lower base channel line that I posted last week. This suggests that the channel line is relatively 'soft' support, so further selling in the weeks ahead below 1310 looks possible.

A the next support zone is between 1226 and 1308, with a sweet-spot about 1250 to 1285. With the next Fibo turn date coming this week (April 23rd to 24th +/-1 day and Full moon on the 25th) If the trend continues down into that date then a significant bottom could be forming for at least another Dead Cat Bounce (DCB), if not something greater (green projection). However, continued upward/sideways moves into the turn date window would suggest a top, with another leg down likely into May (red projection). An unexpected drop through 1226 would kill both of these scenarios to favor further downside.


Zoomed out:


In 2010 the market advanced through its 'point of recognition'. Which is often a point at which the market has gained greater confidence in the prevailing direction. With such confidence latter corrections will often fail to back-test its break-outs adequately. The market is now correcting down in an attempt to fill that void as you'll see in this next slide. Corrections are often 'janitors' that sweep up the disorganized crap left behind by bulls and bears.


Speaking of crap, the 'dump' that the bears made last week will also likely be 'swept' up by the market Janitors at some point. For example, The New York market has yet to spend anytime in the 1404 to 1480 price range since the dump. At some point relatively soon, I think they will.

If Gold does fall down into this weeks turn date window, watch for a potential bullish hammer on a weekly basis, it should look something like this by Friday:


We now have a 'Thick Black Line' TBL established for the gold market:


Forward looking potential if price can stay above the mid-channel line (dashed green):


---------------------------------------------------------------------------------------------------

Silver - A triangle thrust bottom could be see this week. If true, the price should stay below 24.00 until heading to a lower-low.


There should be plenty of LT support between 15 and 21ish.


--------------------------------------------------------------------------------------------------

Dow - Just piecing together some cycles and measurements. This scenario looks possible if the price remains under the upper expanding wedge boundary:


-------------------------------------------------------------------------------------------------

If you are interested in receiving my daily updates on market conditions you can sign up here:
http://majormarketmovements.blogspot.com/p/mmm-market-signal.html

Good Hunting,
QG


...


Sunday, April 14, 2013

MMM Weekend Update 4-16-13

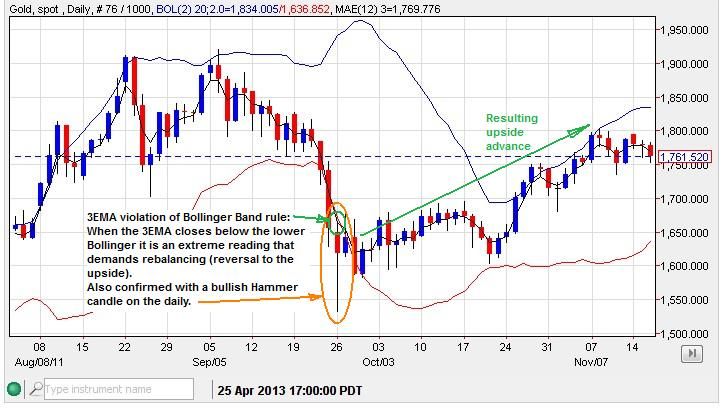
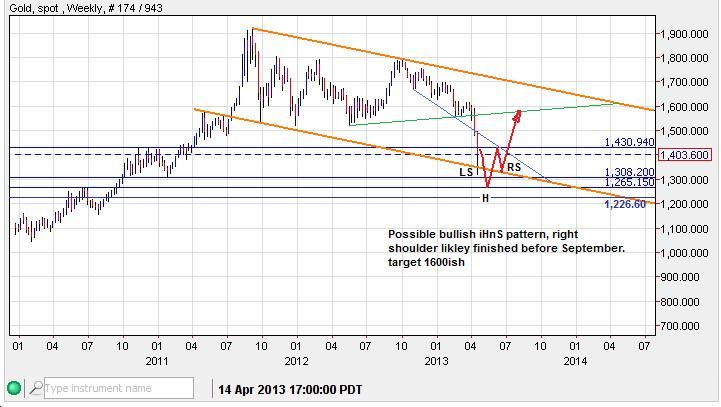
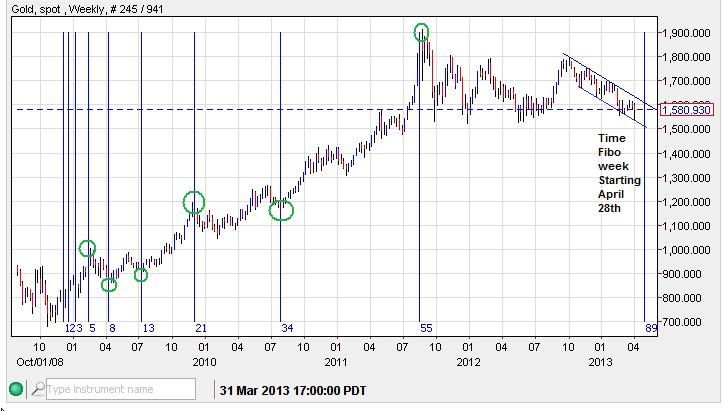
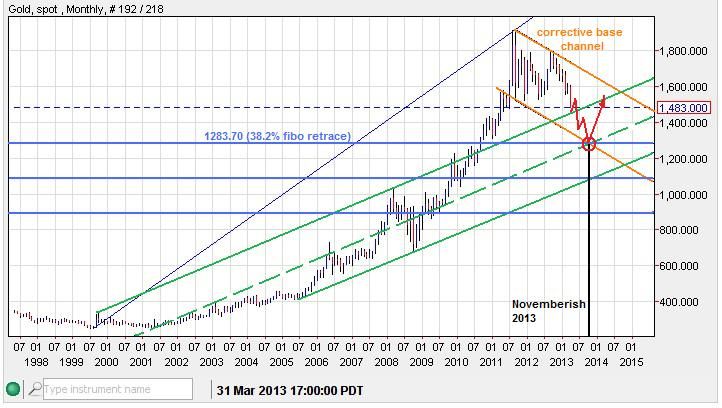
Gold - With a new multi-year low, I suspect that we are going to see alot of choppy action to the downside as those that bought above 1500 will likely be panicking out (selling) into the hands of those that have been waiting patiently to buy a larger correction. Sellers will be exiting at the bounces and new buyers will want to get in on the dips. But I suspect the trend will continue down for at least a few months as lower-highs and lower-lows are predominant. The last swing high was 1590, so the trend is MT bearish under that price.

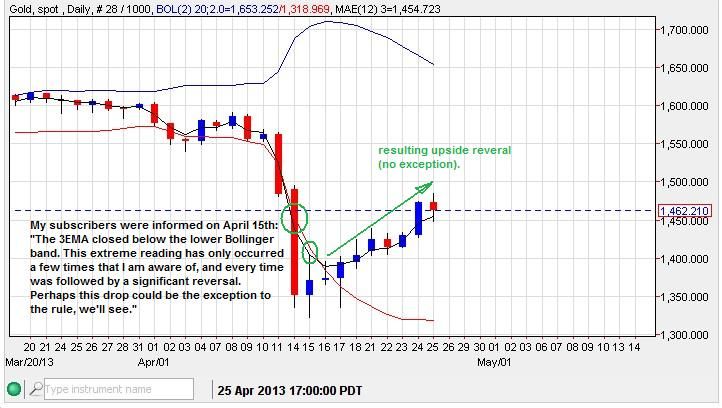
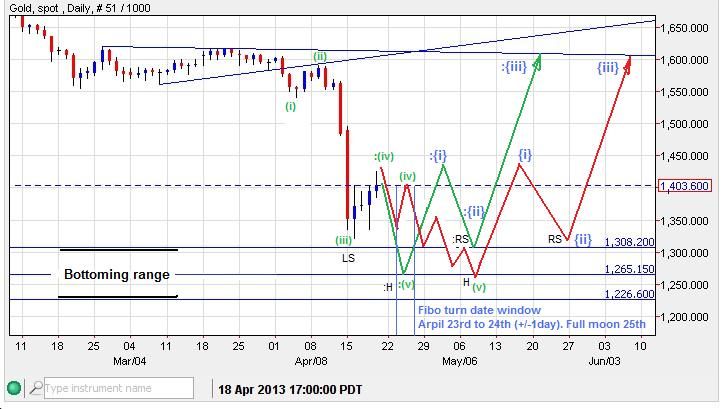
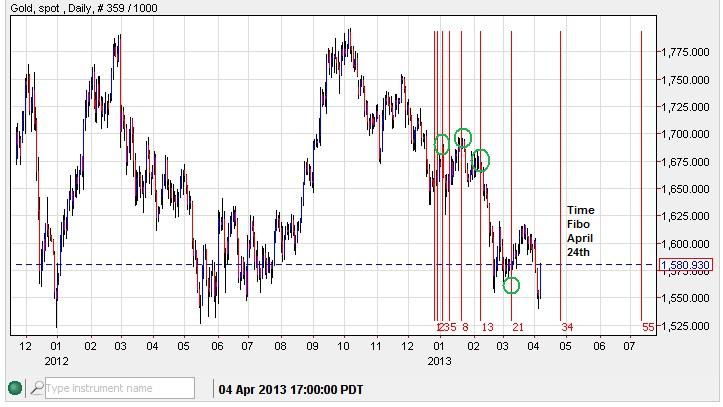
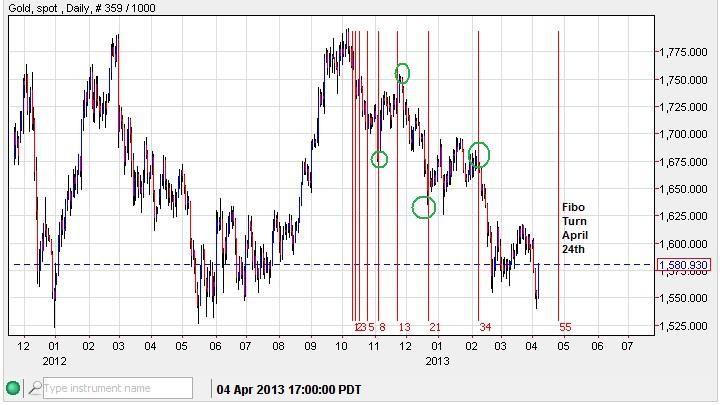
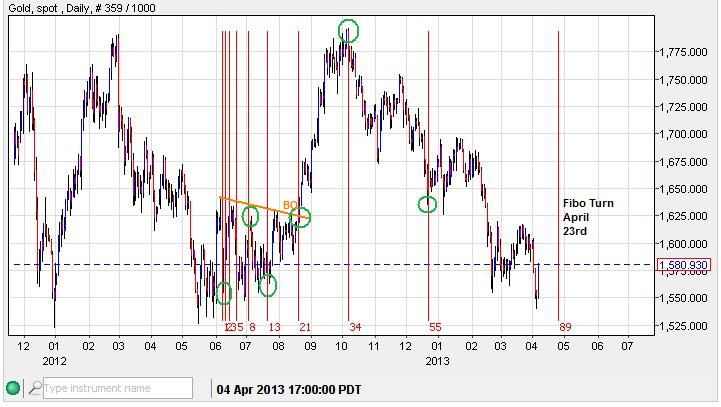
I suspect that the ST trend will continue down into the April 23rd-24th turn date (+/- 1 day) from which a ST bottom could be seen with a bounce up ST (at least). 1440-50ish looks like a probable target by that turn date as long as price remains below 1540 in the interim.

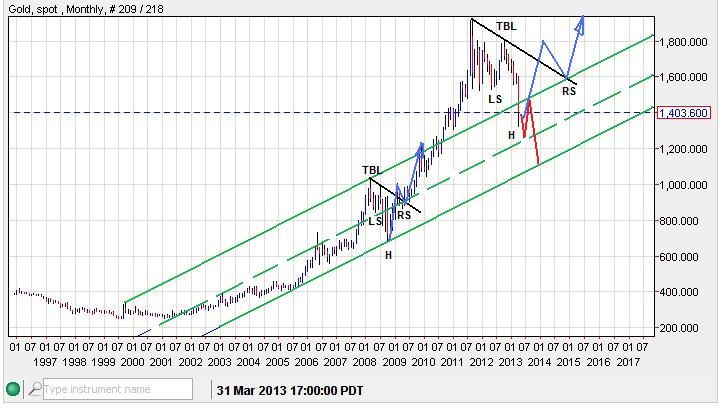
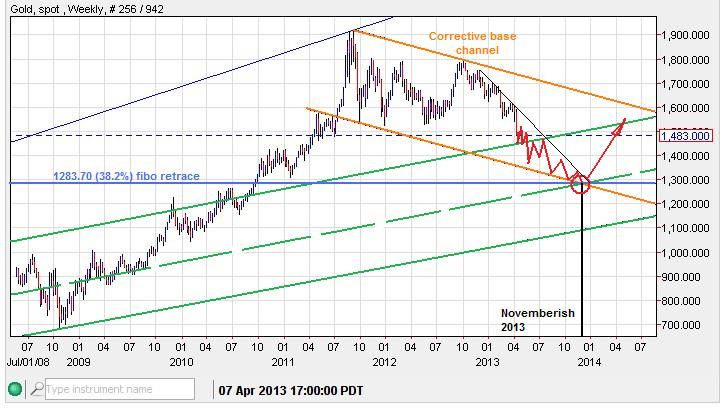
Probably the most important thing to consider in the LT is the price staying inside the base channel. A violation of the base channel with an acceleration channel to the downside would likely kill the Gold bull for decades instead of years.

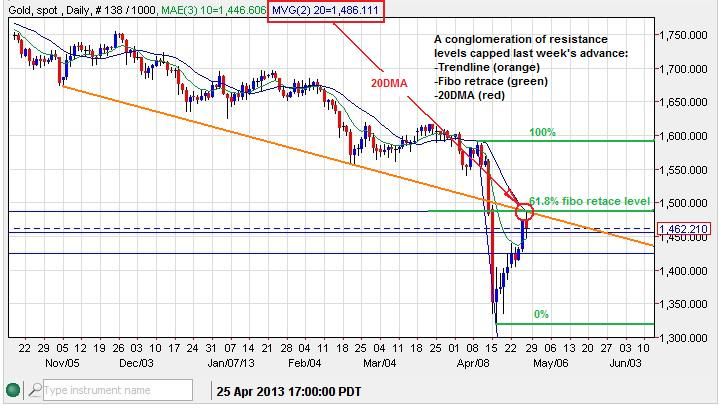
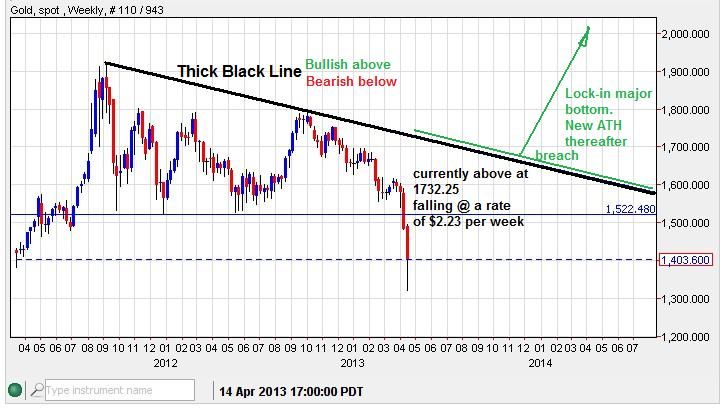
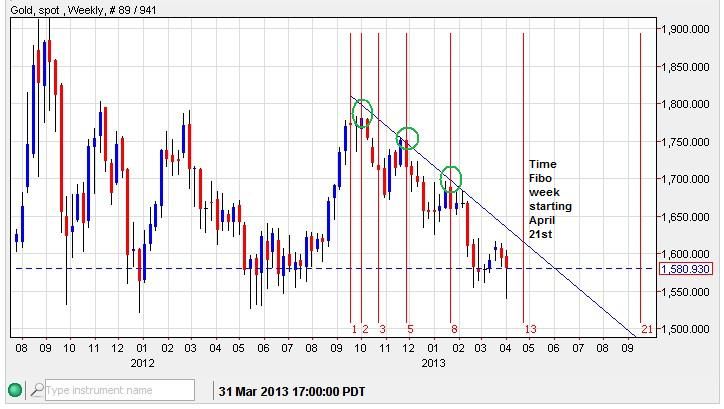
Here are some long term measurements that could be hit in the MT, the red circle is a support cluster of channel and fibo lines, converging around November 2013:
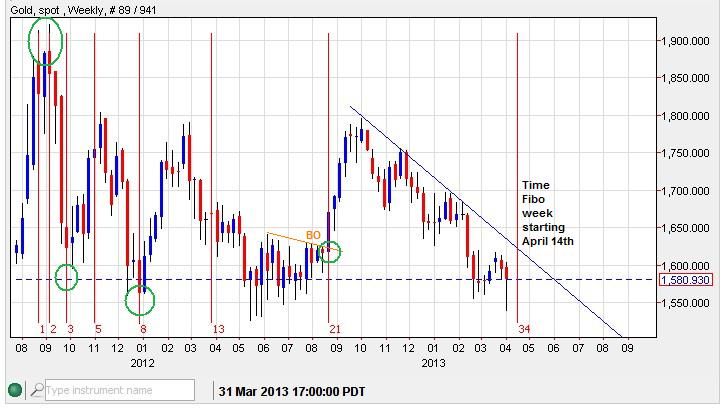
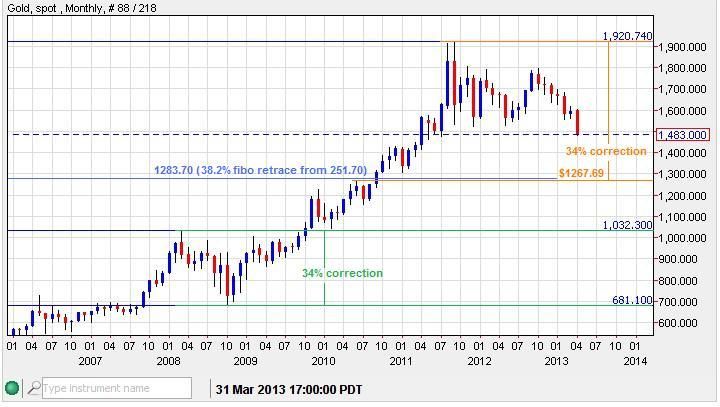

Zoomed in:


In percentage terms gold could correct as far as 2008:


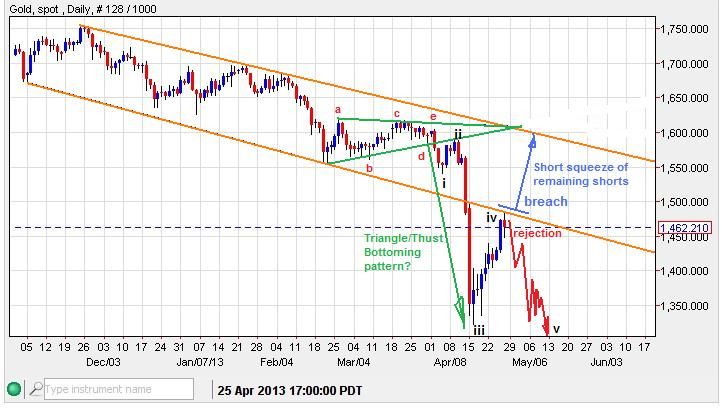
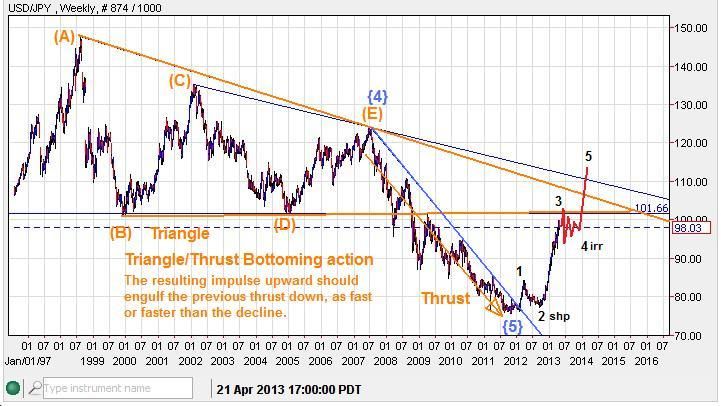
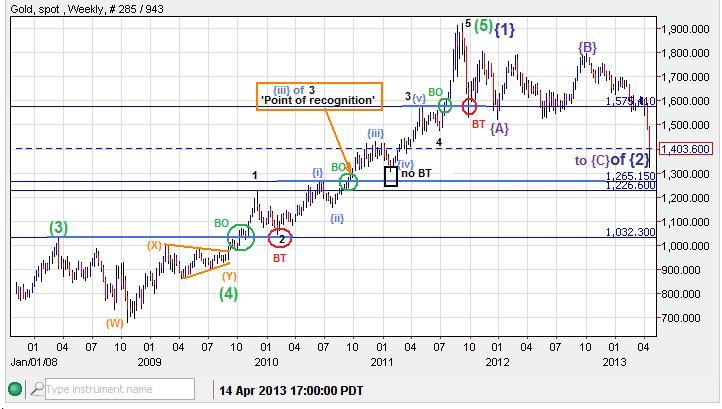
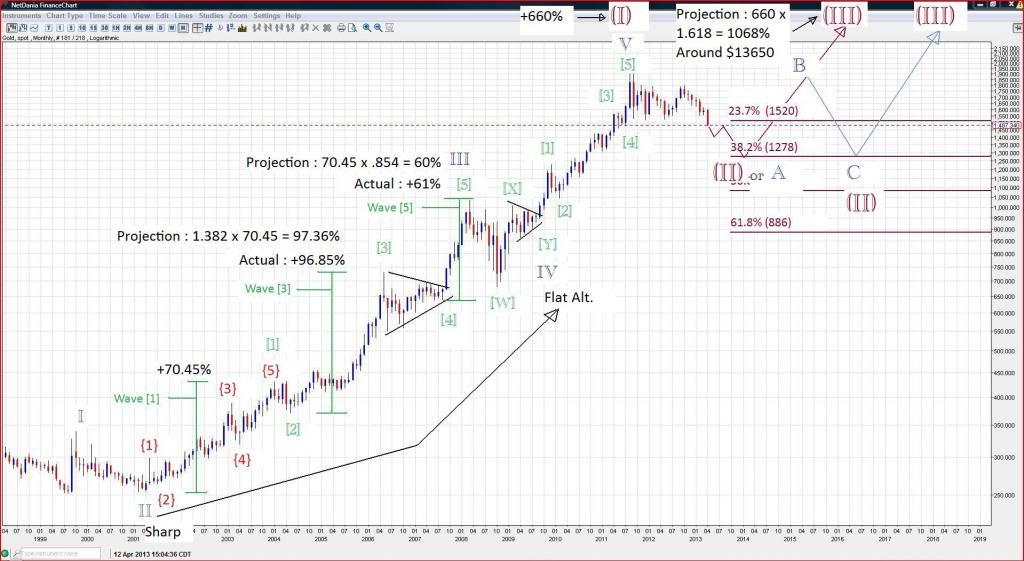
My fellow contributor HoldemPlayer over at the Kitco Forums beat me to the punch with an updated LT Elliot Wave count that I too would favor at this time:


----------------------------------------------------------------------------------------------------------------------------------------

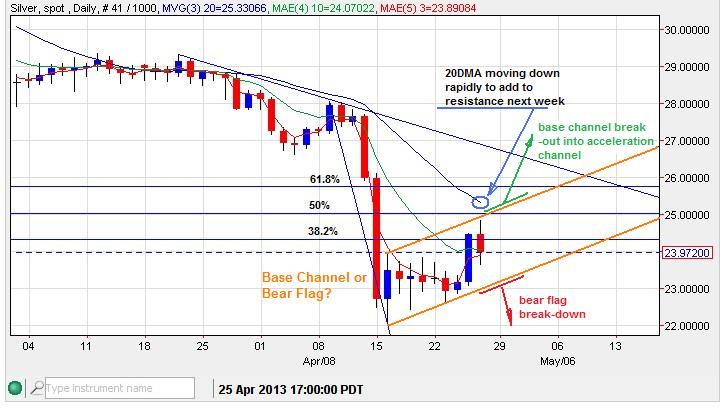
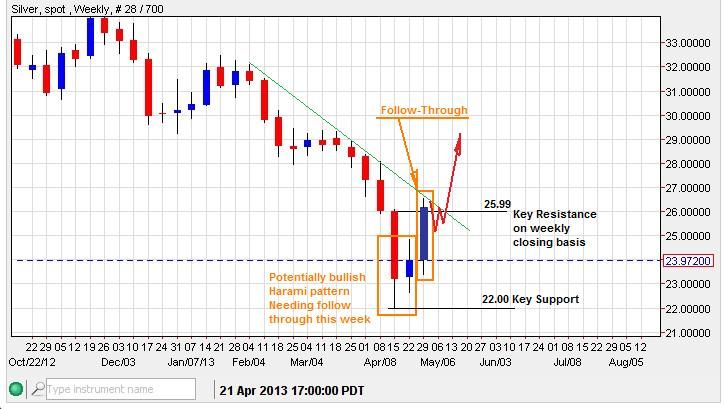
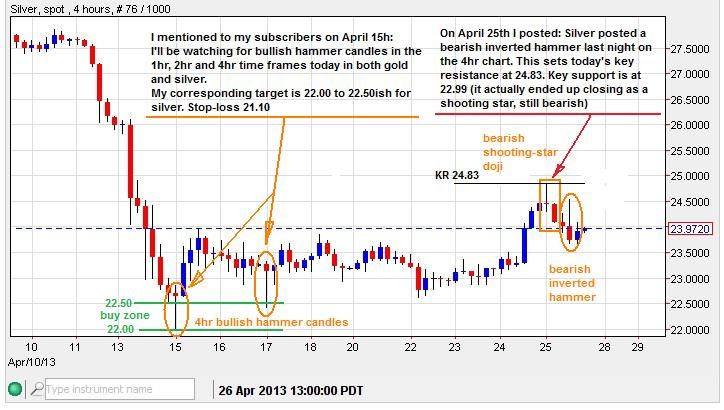
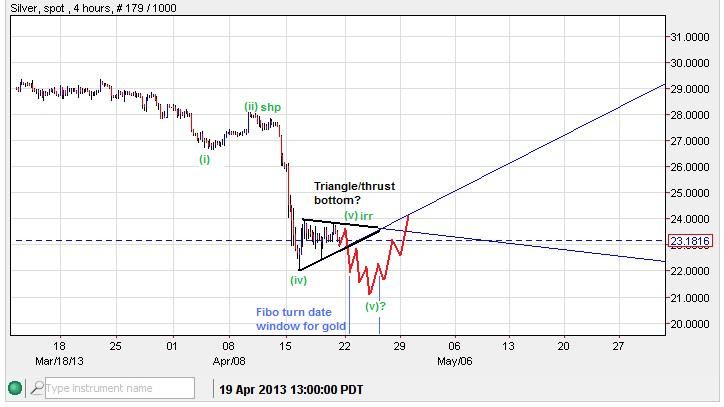
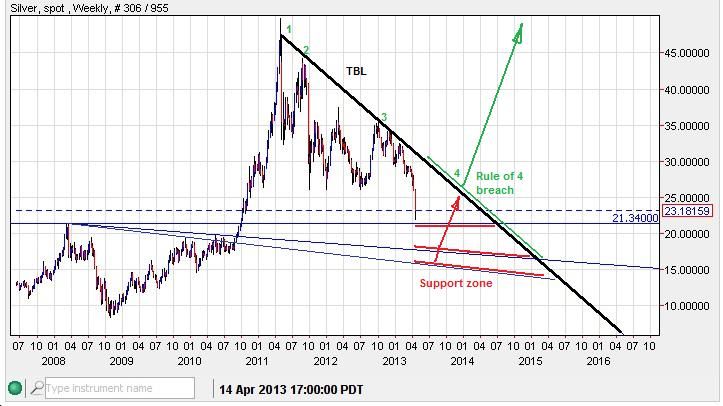
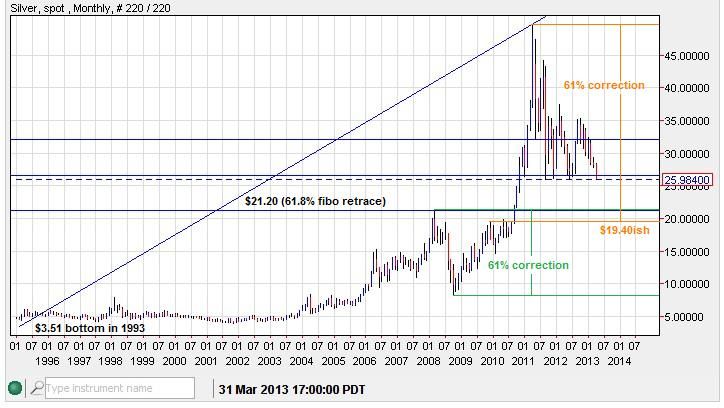
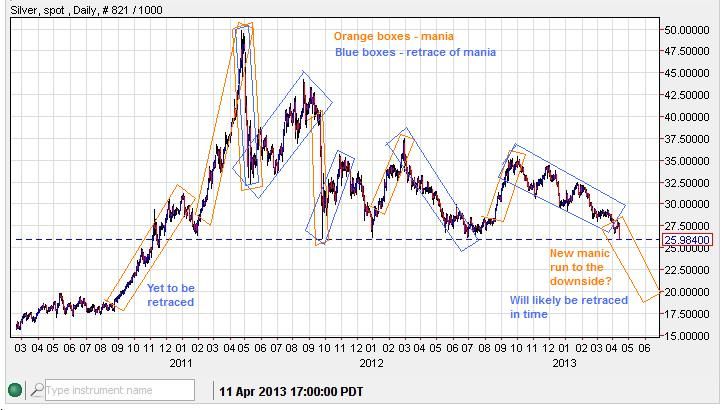
Silver - Friday's wash out closed under 26.00, this almost assures further selling in the weeks ahead. Weeks that close in the bottom 10% of their intra-week range, especially at a new multi-month low, has a very high probability of seeing further downside. Lower targets are 24.20ish (61.8% fibo retrace, not shown) of the 2008 bottom and the 2011 top. And then potetially 19-22ish after a bounce.

This larger correction is probably a larger handle of a multi-decade cup formation with the left rim at $50 in 1980, bottom of cup in 1993 and right rim at $50 in 2011. If and when $50 is broken to the upside the probability of it trading below that level ever again is significantly reduced.


No matter how far a market moves up or down in a manic run, such periods are almost always retraced as irrationality is covered by sanity.


----------------------------------------------------------------------------------------------------------------------------------------

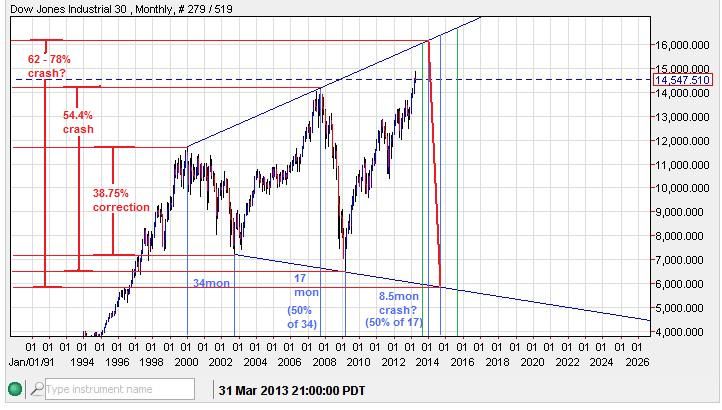
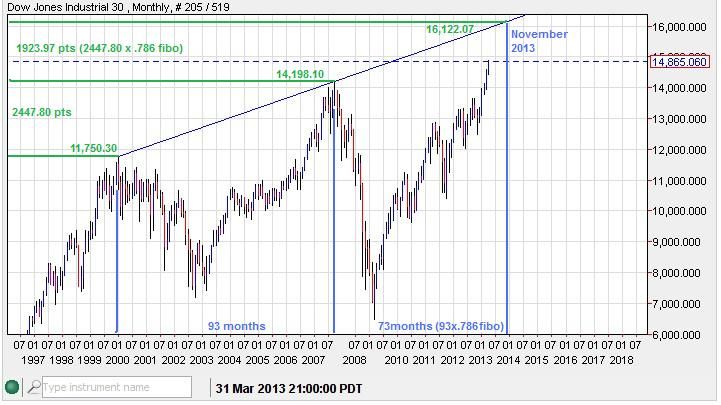
Dow - Here are some interesting fibo relationships in time and price that connect in November 2013 at a price of 16,122ish. Which just so happens to hit a multi-year ascending trend-line. Fascinating by itself, but then add the Novemerish 2013 target for Gold and I become even more attentive. A Dow/Gold ratio could continue to correct upward to 12.60ish by November and then fall toward a new low below 5.69? we'll see.


---------------------------------------------------------------------------------------------------------------------------------------

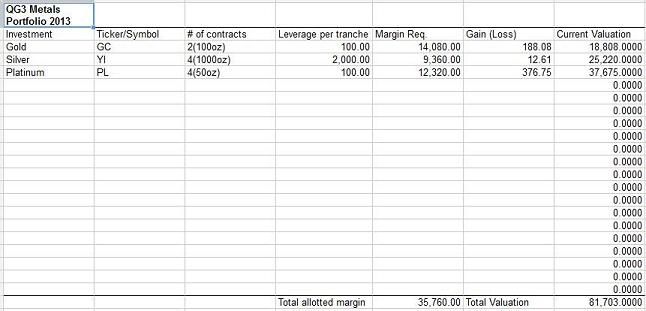
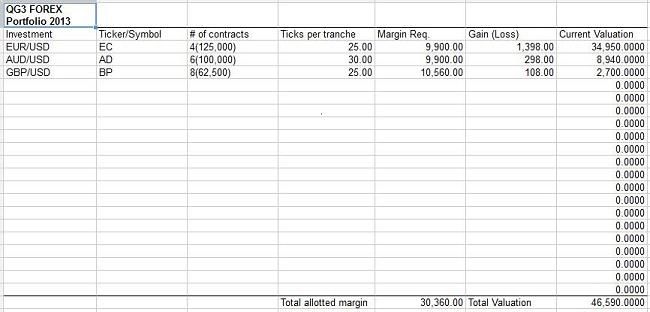
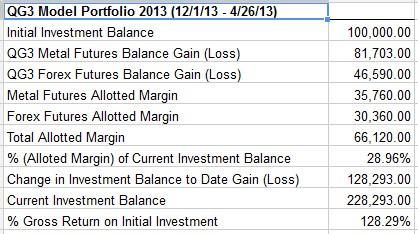
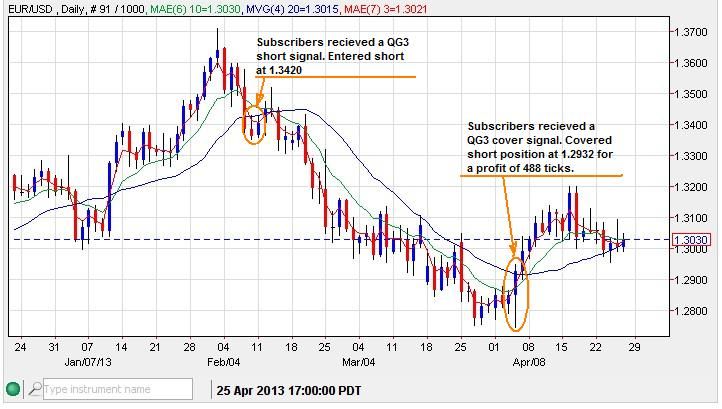
My QG3 subscription performance tracking will not be posted today. I am working on releasing a quarterly performance portfolio. I will get this posted ASAP.

Quad G


Sunday, April 7, 2013

MMM Weekend Update 4-7-13

Gold - The fibo turn date window for April 4th to April 9th saw a trend move down into that date and saw a decisive turn on Thursday (4th) and Friday (5th) last week.

I performed a Time Fibo sweep for dates coming up in the near future. 3 interesting weekly turns point to a span of time between the week opening April 14th to the week opening April 28th. Weekly turns can get us in the ball park, but daily time fibos can fine tune the turn inside the weekly span. The daily turns point to a span of time between April 23rd to the 24th. A full-moon is also on the 25th. Those series of dates are right in the middle of the weekly alignments. So, a trend down into that 23rd to 24th window would suggest a bottom turn, a trend up into that turn date window would suggest a top. With a fairly large compilation of alignments, I would have to say that the turn date window should have a very noticeable MT reaction. I suspect that most of April could remain range bound between 1540 and 1620, but the month of May could see a significant trend develop, I think the trend will be bullish if price can stay above 1540.

Weekly Time Fibo Alignments:


Daily Time Fibo Alignments:


ST Elliot wave potential:


If the Elliot wave pattern plays out, it could set up a bullish iHnS projection:


Last week's daily candle stick pattern was also bullish:


-----------------------------------------------------------------------------------------------------------

USD - A bearish inverted hammer was printed last week, setting up critical resistance at 83.49


-----------------------------------------------------------------------------------------------------------

USD/JPY - Provided an excellent buying opportunity, but could be getting toppy soon.


-----------------------------------------------------------------------------------------------------------

S&P500 - logged in a bearish topping candle last week on the daily, trend would be bearish while under 1573.66


-----------------------------------------------------------------------------------------------------------

Good Hunting this week,
QG