I suspect that the ST trend will continue down into the April 23rd-24th turn date (+/- 1 day) from which a ST bottom could be seen with a bounce up ST (at least). 1440-50ish looks like a probable target by that turn date as long as price remains below 1540 in the interim.
Probably the most important thing to consider in the LT is the price staying inside the base channel. A violation of the base channel with an acceleration channel to the downside would likely kill the Gold bull for decades instead of years.
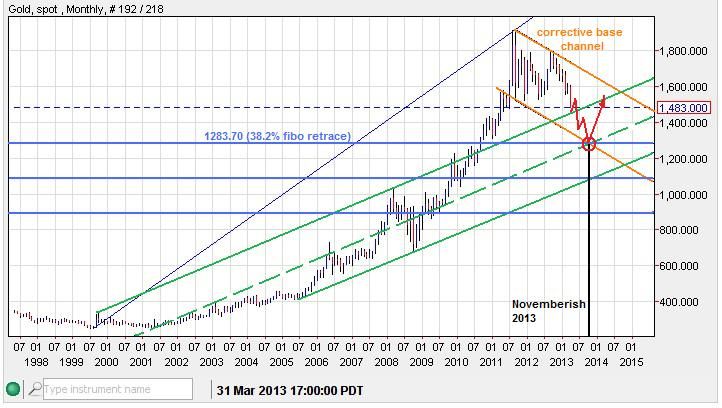
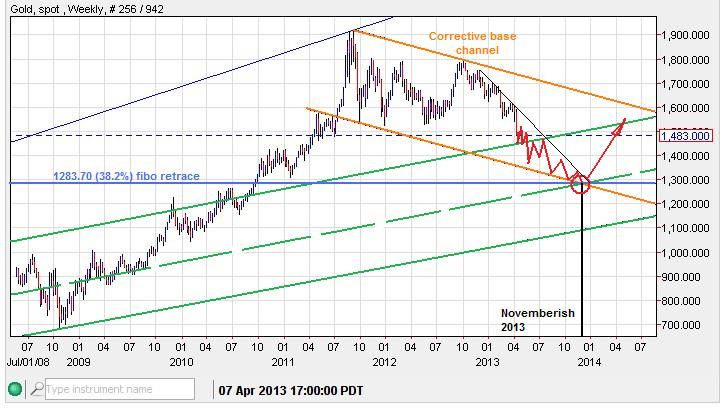
Here are some long term measurements that could be hit in the MT, the red circle is a support cluster of channel and fibo lines, converging around November 2013:
Zoomed in:
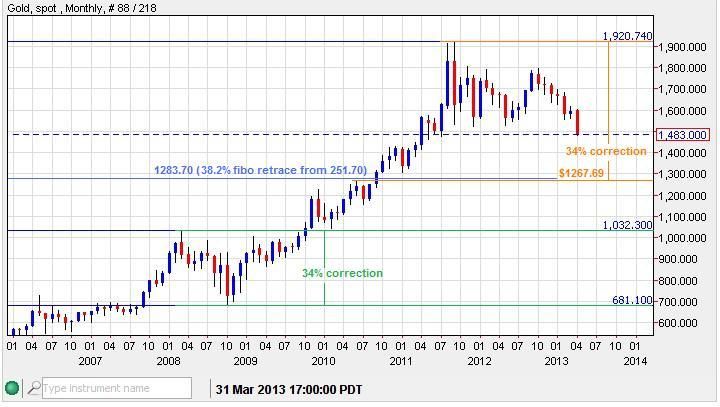
In percentage terms gold could correct as far as 2008:
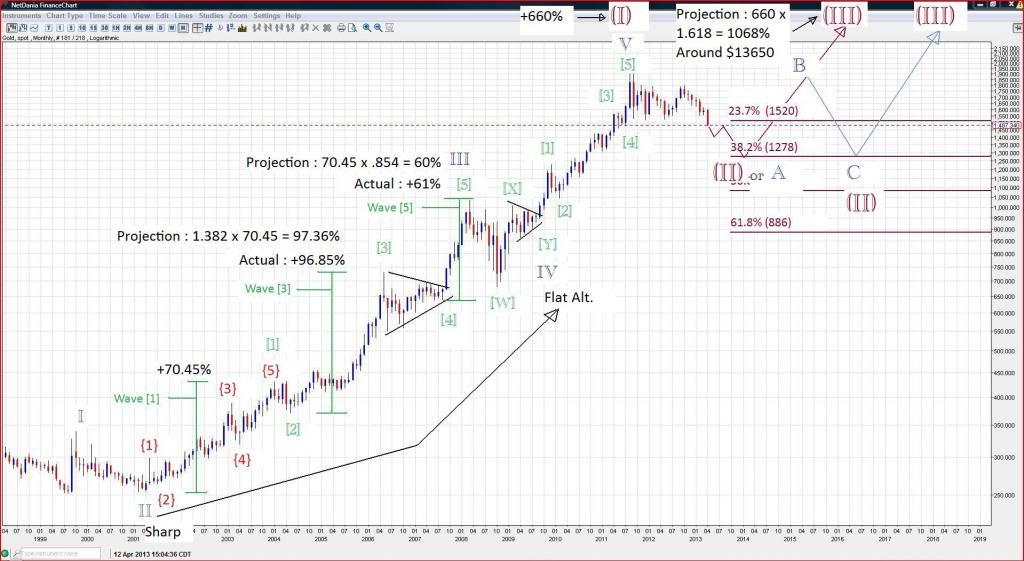
My fellow contributor HoldemPlayer over at the Kitco Forums beat me to the punch with an updated LT Elliot Wave count that I too would favor at this time:
----------------------------------------------------------------------------------------------------------------------------------------
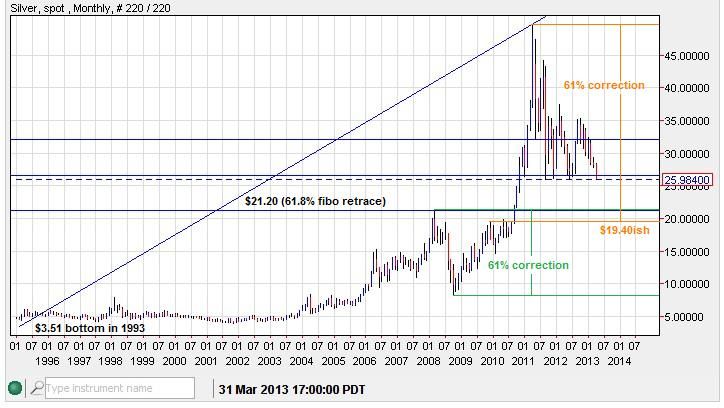
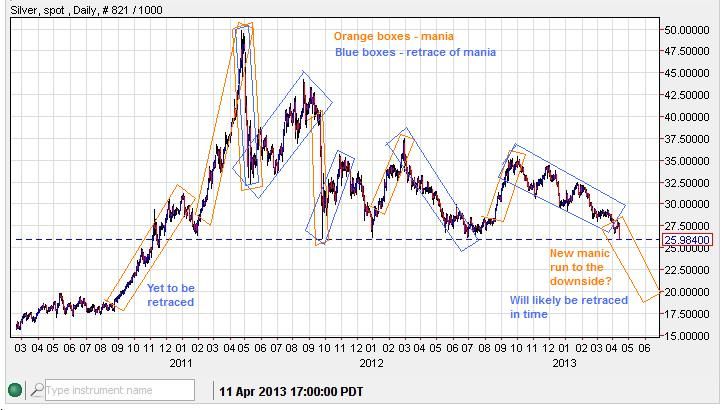
Silver - Friday's wash out closed under 26.00, this almost assures further selling in the weeks ahead. Weeks that close in the bottom 10% of their intra-week range, especially at a new multi-month low, has a very high probability of seeing further downside. Lower targets are 24.20ish (61.8% fibo retrace, not shown) of the 2008 bottom and the 2011 top. And then potetially 19-22ish after a bounce.
This larger correction is probably a larger handle of a multi-decade cup formation with the left rim at $50 in 1980, bottom of cup in 1993 and right rim at $50 in 2011. If and when $50 is broken to the upside the probability of it trading below that level ever again is significantly reduced.
No matter how far a market moves up or down in a manic run, such periods are almost always retraced as irrationality is covered by sanity.
----------------------------------------------------------------------------------------------------------------------------------------
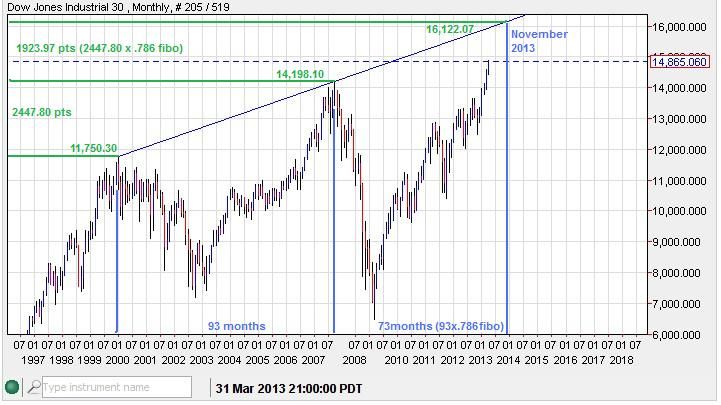
Dow - Here are some interesting fibo relationships in time and price that connect in November 2013 at a price of 16,122ish. Which just so happens to hit a multi-year ascending trend-line. Fascinating by itself, but then add the Novemerish 2013 target for Gold and I become even more attentive. A Dow/Gold ratio could continue to correct upward to 12.60ish by November and then fall toward a new low below 5.69? we'll see.
---------------------------------------------------------------------------------------------------------------------------------------
My QG3 subscription performance tracking will not be posted today. I am working on releasing a quarterly performance portfolio. I will get this posted ASAP.
Quad G