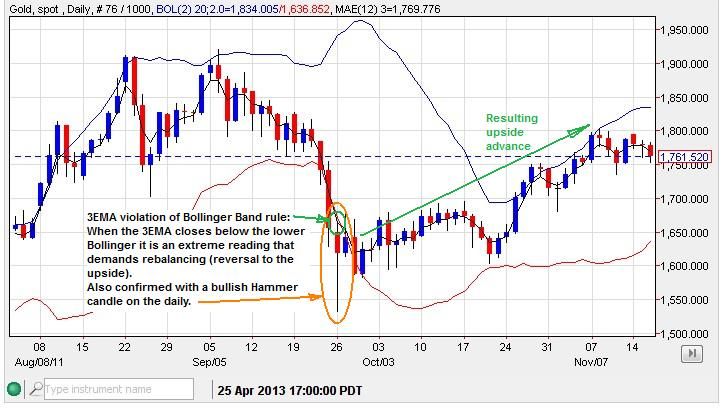
An example from September 2011:
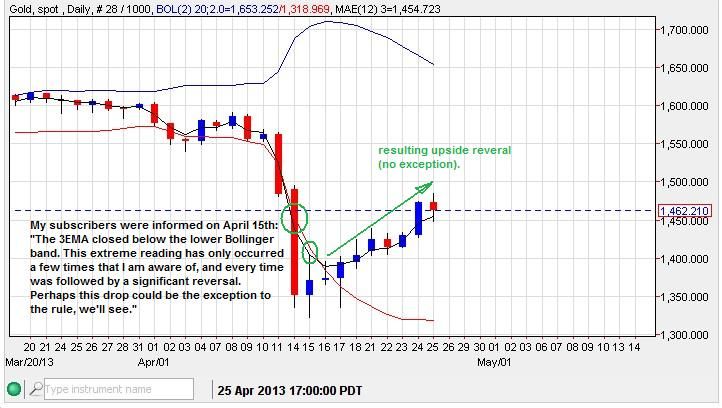
The latest occurrence:
So far the upside advance has hit a conglomeration of resistance levels from various sources coming tightly together:
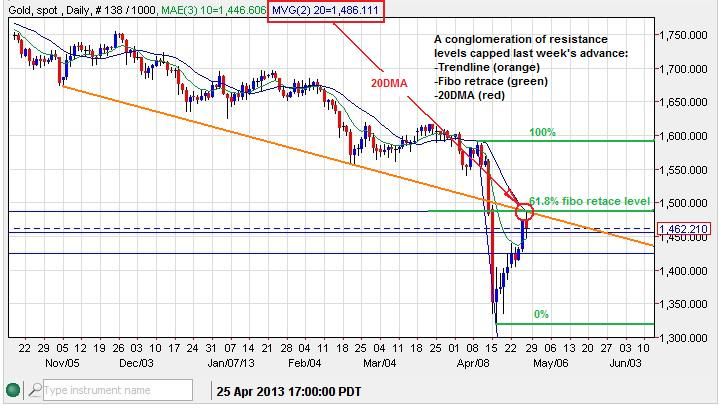
The price of Gold has moved up into the Fibo/Full Moon turn date last week. If it is a successful turn date we should see at least 4 (total of 5) more days or more to the downside. If the price moves up above last week's high or 1485.22 then the turn date window is busted and a greater upside surge could be realized, possibly challenging 1600 in very little time.
-----------------------------------------------------------------------------------------------------------------------------
Silver - Is currently wrestling the price inside a 4 point channel. This could be a bullish base channel or bear flag. How the price deals with the 20DMA next week should determine the outcome. A daily close above the 20DMA would suggest an acceleration channel the upside is underway, but must stay above key support at 22.99 (lower channel support).
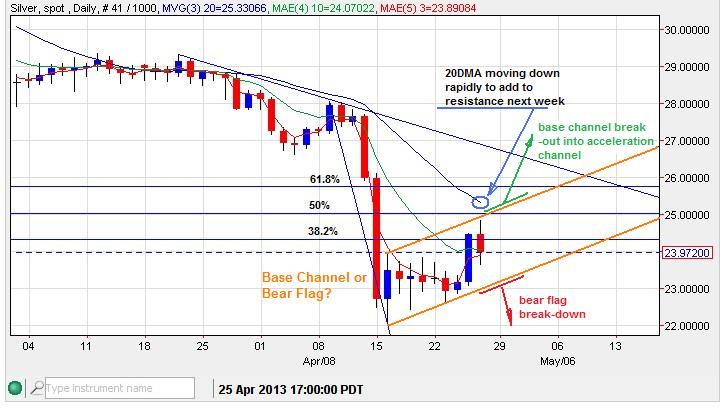
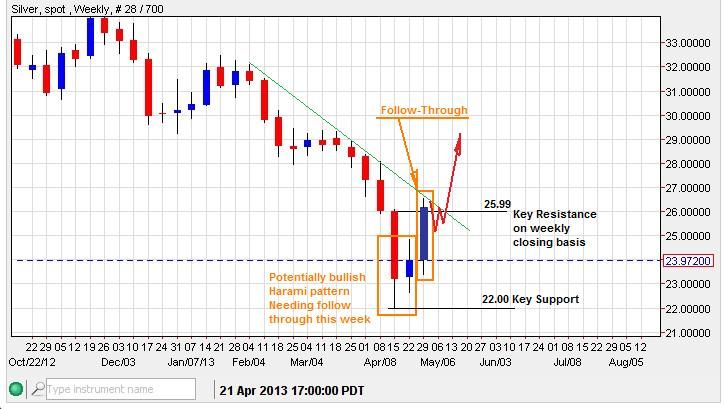
If this week continues higher and closes next Friday above $25.99, a major Harami reversal pattern will be printed, possibly setting a major bottom at 22.00
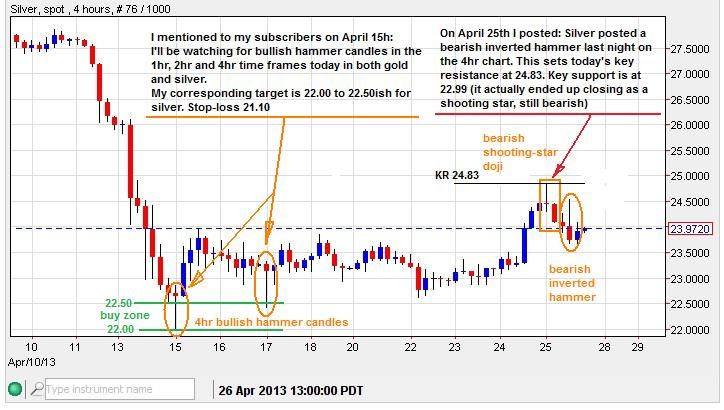
I've been teaching my subscribers about the benefits of observing candlestick patterns in the 1hr, 2hr and 4hr time frames and how to trade them effectively. Silver has printed some excellent examples of 4hr candles and their corresponding reactions:
----------------------------------------------------------------------------------------------------------------------------
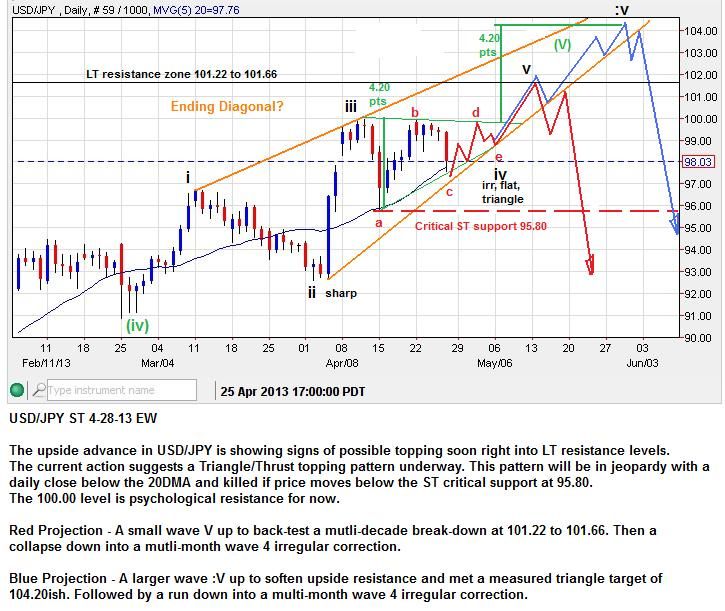
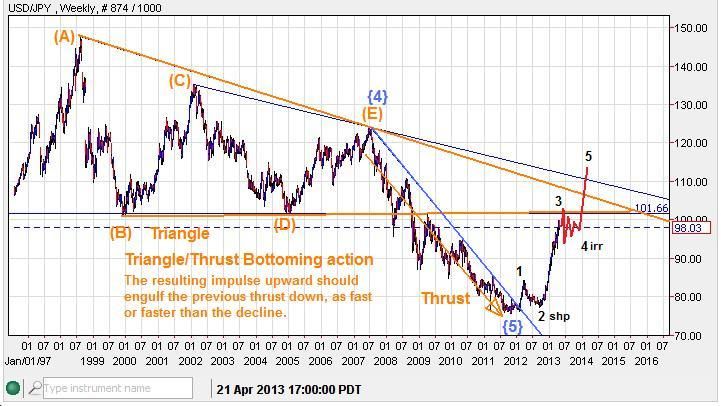
USD/JPY - Continues to wrestle with the prominent psychological resistance at 100.00. A potentially bullish triangle consolidation pattern underneath 100 threatens to break it soon with a resulting thrust upward into an Ending Diagonal. Such a pattern needs to stay above 95.80. The thrust up has a few measured targets, 101.50ish, 104.20ish and 105.54 (not depicted, 2.618 x wave 1 (8.15)+ wave 1).
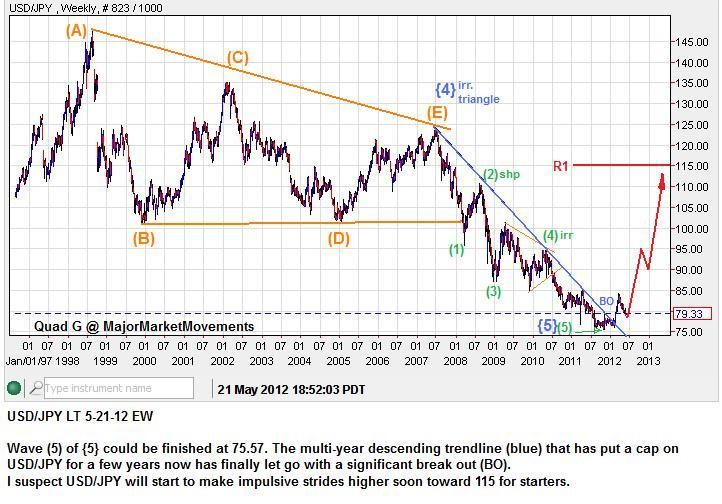
The larger pattern is still being fulfilled. My long term bottom call from May 2012 is producing the expected impulsive behavior:
Update:
----------------------------------------------------------------------------------------------------------------------------
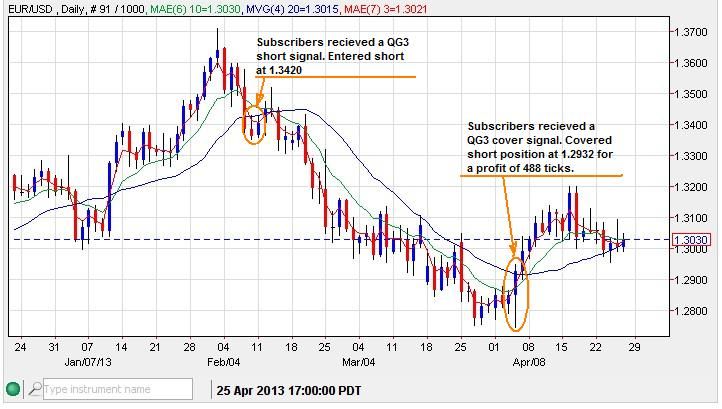
EUR/USD - The QG3 continues to produce excellent trading signals. Subscribers were recently signaled to cover shorts to lock in profits in the vicinity of 488 ticks.
---------------------------------------------------------------------------------------------------------------------------
If you are interest in receiving my daily email updates and signals for multiple markets sign up here:
http://majormarketmovements.blogspot.com/p/mmm-market-signal.html
Good Hunting,
QG