With the Stock Market crashing and the potential for a substantial rise in USD, The US price of gold may move into a consolidation period. Here is what that count may eventually look like:
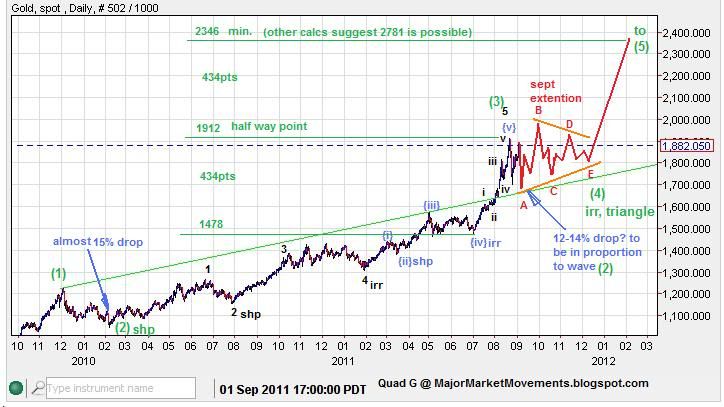
The wave (2) green drop in late 2009 to early 2010, was a little over 14%, inside the 12 to 15% window as a sharp correction. It's still early, but an irregular (4)green could play out here as a triangle. It's still possible to see a move into a 12 to 14% range to complete a wave A red, the deepest part of the triangle. Such a move down should find support at the aforementioned gap and keep above the 61.8% fibo of 1643, also the green trend-line (currently below at 1658). Moving into that range would be a gift, likely many investors would jump at this level, as the risk would be fairly low with great potential going forward. I would not expect a move into that area sub-1700 to last very long, perhaps only a day or two. Wave B red to follow, could make a higher-high above 1912 as an extended B wave of a bullish running triangle, possibly testing 2000ish, the bullish aspects of the month of September would certainly account for it.
This pattern is far from being certain at this point in time, but it has some potential and should be watched for. This would be a huge gift of a move, one filled with great buying opportunities and increasing confidence in the outcome.
Looking at this count in the ST it could be interpreted as such, I'm also embedding a bit of 'Trade School':
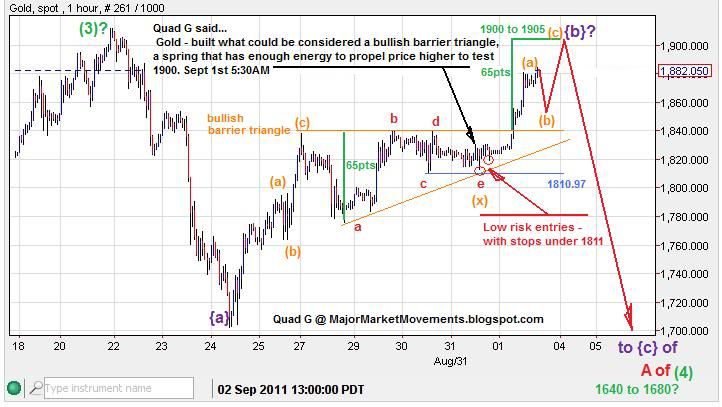
The outcome of a triangle is usually one final thrust up based on the kind of structure that moved into it. In this case, I see what could be counted as 3 wave zig-zag moving into the triangle, so another 3 wave zig-zag could be expected to exit the triangle. This would form an over-all corrective wave called a 'double zig-zag' which is very common for price movements in PoG. This move higher has hit it's measured initial target today in the 1900 to 1905 area. A Sharp move down might be possible soon, but has some hurdles namely the 3/10/20 ribbon which is in a bullish alignment. Also, if PoG recovers above 1912, then this count could be dead.
If there was a presence of bears in this market they would likely jump at the chance to short near this 1900 to 1905 level setting stops above 1912, giving less than a 1% risk.
Trade School - I mentioned back in the early morning on Sept. 1tst that a bullish barrier triangle for forming, and gave parameters of 1811 as a jeopardy level and 1840 as the break-out level, and potential measured target of 1900+. Everything went text book. With the triangle in jeopardy below 1811, the risk was below that level, a place to set stops, let's say a tight stop of 1809. PoG then came down three times: 1813, 1819 and 1824 (not circled). With a predetermined stop level of 1809, this gives us a risk of $4, $10, $15, all three opportunities under 1%, very low risk. Now with a potential target of 1900, we can quickly gage what the risk reward ratio would be: let's say you averaged 3 contracts in at 1819, for a combined risk of $10 (with stops at 1809). The 1900 target minus 1819 = a potential gain of $81. $81 reward divided by a $10 risk gives a risk reward ratio of 1:8! that is an extremely good RRR. Any RRR 1:3 or better is usually a worth while trade. Sizing up risk is the first priority before entering a trade, decide how much you are willing to risk before entering the trade. Determine the key level of support, figure a stop below it then add your risk level, say 1% or about $18. If the price comes down into your acceptable risk zone that you have established then pull the trigger. Then STICK WITH YOUR GAME PLAN. It's easy to get nervous and not allow yourself to take the hit and cancel your stop loss, BAD IDEA almost 90% of the time. It's better to take the hit, sit back and look for another low risk opportunity, let the dead trade go and move on.
Now let's take a look at the 3/10/20 ribbon on the daily chart:
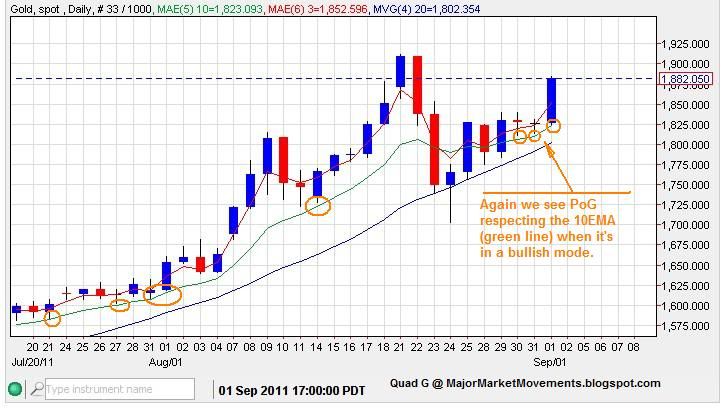
The ribbon is in a MT bullish alignment and will remain that way with daily closes above the 10EMA. As you can see, the 10 EMA has been giving support on an intra-day basis, which is usually a sign of bullishness. This is often a level that traders will take a risk from. If any ST bearish potential is in this market it will first need to produce a daily close under the 10 EMA. The last time the 3/10/20 ribbon made a bullish cross over back under 1550, PoG moved up over 360pts. It's a formidable signal for MT trades.
...