Case/Shiller home price and Consumer confidence numbers out today. Both are likely to come in lower. The Case/Shiller numbers have finished a multi-year dead cat bounce and the next big slide in real-estate prices are likely underway. I've mentioned this many times before, that a second leg down in RE should begin this year and will likely keep falling into 2015 or later. If my outlook is correct, home prices may come down to their late 1980 to early 1990 levels.
Gold - With the potential for the SM to take another dive lower soon, PoG may see some of the exit money. With 1822 taken out this morning key support is now at 1800. There are multiple EW counts that can be seen, so not very useful at this time. The 3/10/20 is still MT bullish while daily closes remain above the 10EMA (currently 1800).
Silver - The EW picture is far more clear than gold's. Silver may advance higher toward 44+ soon but MUST stay above 38.70. The 3/10/20 is also bullish with daily closes above the 10 EMA (currently 41.00).
USD - Here is the chart that explains much:
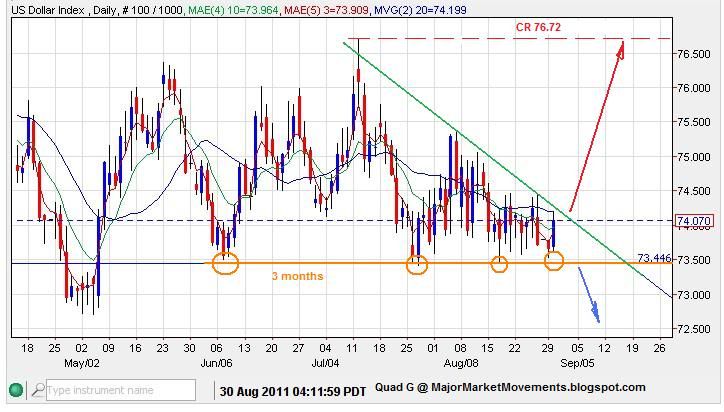
For 3 months USD has found support at the 73.40 level. As the trading range narrows a break-out is likely to occur soon. Piercing the green trend-line should initiate a short squeeze that could push the index higher toward Critical Resistance (CR) at 76.70ish. If 76.70 is breached then much further upside in possible, likely on the back of a major market crash. However, breaking 73.40 can be just as powerful, likely many stops are below that level, tripping them would likely force a strong sell off as another bottom is searched for.
Copper - needs to exceed it's base channel soon to the upside to stay bullish, that level is near 4.25 at this time. Shying away from the top of the base channel and falling impulsively back below 3.93 would be bearish and invite more selling.
Dow - Moved back up to the resistance zone above 11,500. If my view point is correct the Dow should not exceed the upper base channel line (currently above at 11,744 today). There is a pocket of resistance between 11,555 (lateral S/R) and 11,679 (50% fibo). Beyond that is a very tight cluster of resistance between 11,862 (lateral S/R) 11,886 (upper daily Bollinger Band), 11,932 (61.8% fibo) and 11,937 (50DMA). 4 types of resistance currently in a tight range of 75pts. The last 'C' leg up of this dead cat bounce could be finished this week or early next and then resume with it's next plunge lower to sub-10k as part of a very long multi-year campaign to reach sub-3000. This bearish projection is in jeopardy if the Dow climbs back above 12,000.
I will have an article on SPY (ETF of S&P 500) out shortly.
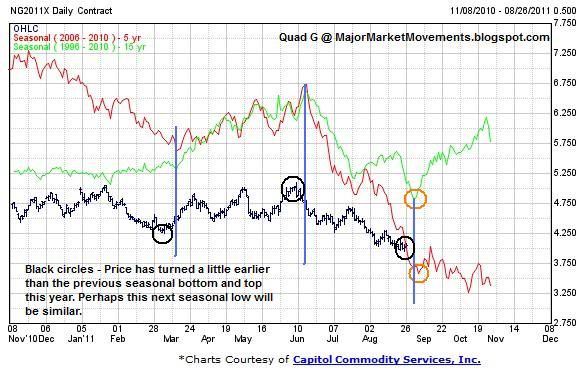
Natural Gas - Natgas could be finishing up the D wave down before a E wave up. Price should bounce off the lateral support area between 3.70 and 3.85. If 3.70 fails then natgas will more likely attempt to fill the gap from last October, continuing to move down toward the 3.40 level. That projection can be seen here: http://majormarketmovements.blogspot.com/2011/07/natural-gas-still-inside-long-term.html
The seasonals may kick in soon, as you can see, a significant low is possible this early September:
Keep up with the conversation here at the MMM Weekly Round Table: http://majormarketmovements.blogspot.com/2011/08/mmm-weekly-round-table-discussion-82911.html
Good hunting folks.
...