Mornin' all,
Gold - So far since the open, gold has consolidated above the 10 EMA. Daily closes above the 10 EMA will keep the MT trend positive.
Silver - Also attempting to consolidate above it's 10 EMA. Critical support for silver is at 38.70ish.
USD - For 3 months now USD has formed a base at the 73.40 level. A 4th attempt to break that base is in progress. The 'rule of 4' says that the 4th attempt to break a level is often successful, but if the market fails to do so the price can swing strongly in the opposite direction. In this case, if the current ST downtrend fails to bust 73.40 soon, then USD bears may have exhausted themselves and bulls will be able to run it higher. The ST upside break-out point is above at approx. 74.46.
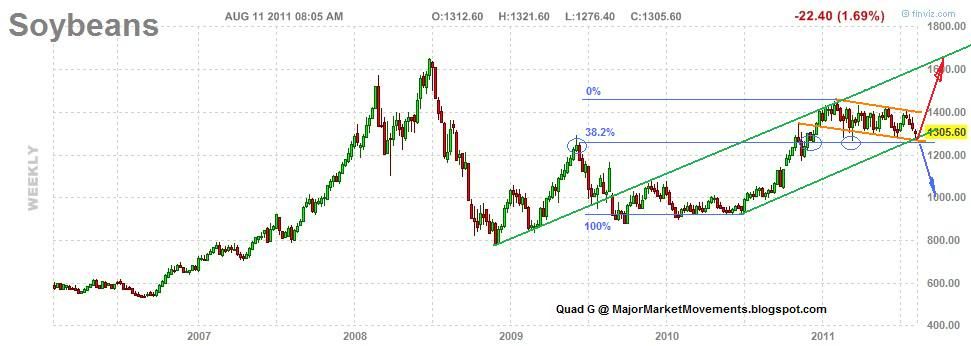
Soybeans - Here is the previous chart for reference posted:
(click on chart for full view)
Beans have broken out above the large Bull flag, now at 1427, making a nice bounce off key support below 1300. The break-out at some point may move down to back-test that break-out, then afterward move higher. Ultimately I think the 2008 highs at 1600 could be tested soon.
Corn - looking bullish while above 720, the current uptrend from 690ish could be an impulsive 3rd wave that is not yet complete.
Wheat - The key support for wheat is at 700. So far wheat has managed to challenge it's downward sloping multi-month upper trend channel line at 770ish, but it's approach is somewhat lazy. Bulls will want to see that 770 level breached with conviction and soon.
Dow - Is very close to moving up to the resistance zone again 11500 to 11800. However, the RSI (14) on the daily has hit 50. In a bear trending market, the RSI will often turn down from the 50 to 60 level and rarely exceed 60. I think this current move to the upside is a C leg of a 3 wave corrective pattern to the upside, Upon it's completion another strong move down should develop heading to sub-10k if my interpretation is correct
...
