The fundamentals can be discussed all day long, but Technical Analysis is the only pure language for trading successfully.
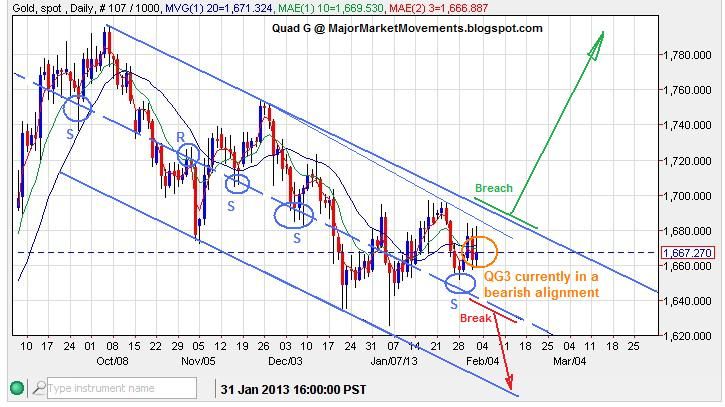
Gold price is in a precarious position with the QG3 making an official bearish cross-over:
The recent sideways chop could be ending soon unleashing a run, consider the Bollinger Band 'Pinch':
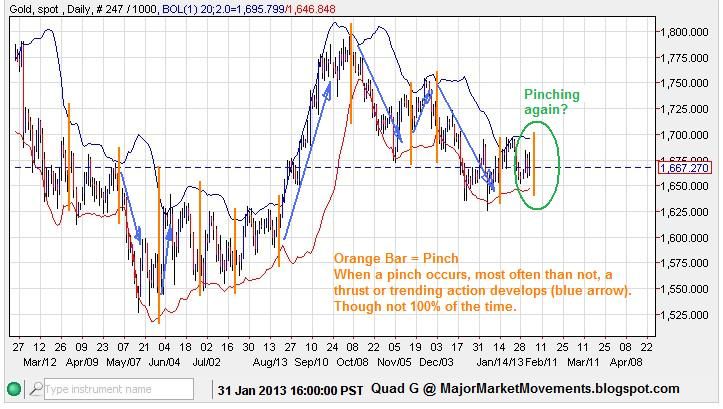
The 'Pinch' doesn't necessarily point to any particular direction, it mainly indicates that an area of consolidation is about to have a break-out into a thrust or trend.
------------------------------------------------------------------------------------------------------------------------------------------
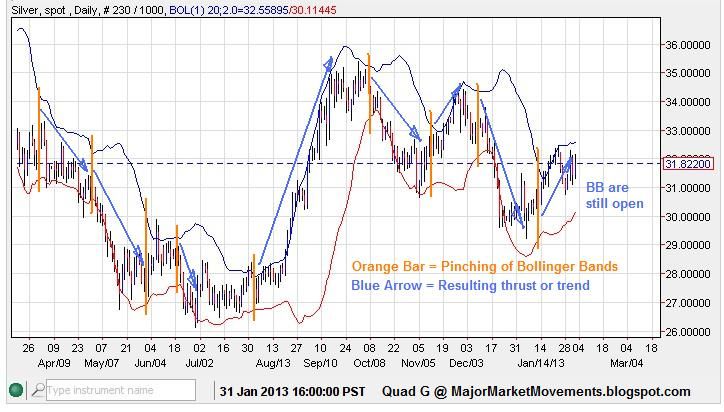
Silver - In much better shape than gold, but has also been plagued with recent chop, as though the market is waiting for something before making a firm decision:

Silver feels the 'Pinch' a little better than the gold price does, currently the BBs are open to the upside:
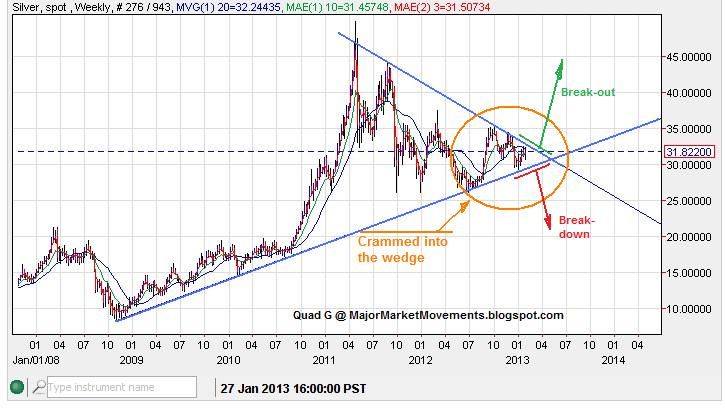
The long term picture continues to tease as price tediously oscillates inside a LT contracting wedge:
------------------------------------------------------------------------------------------------------------------------------------------
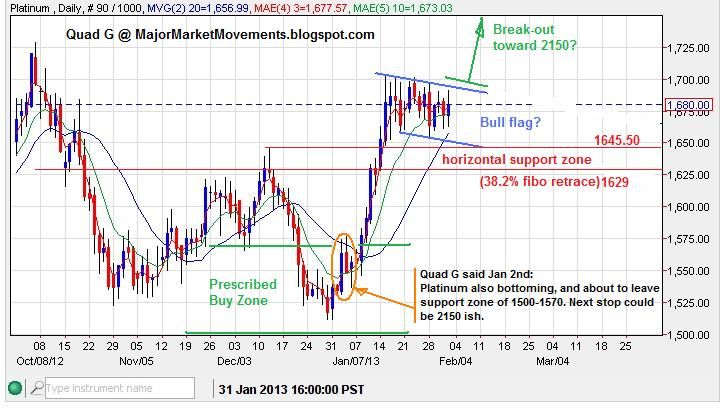
Platinum - Appears to be forming a Bull Flag, a pause in the action before another run higher. But must keep above the support zone:
------------------------------------------------------------------------------------------------------------------------------------------
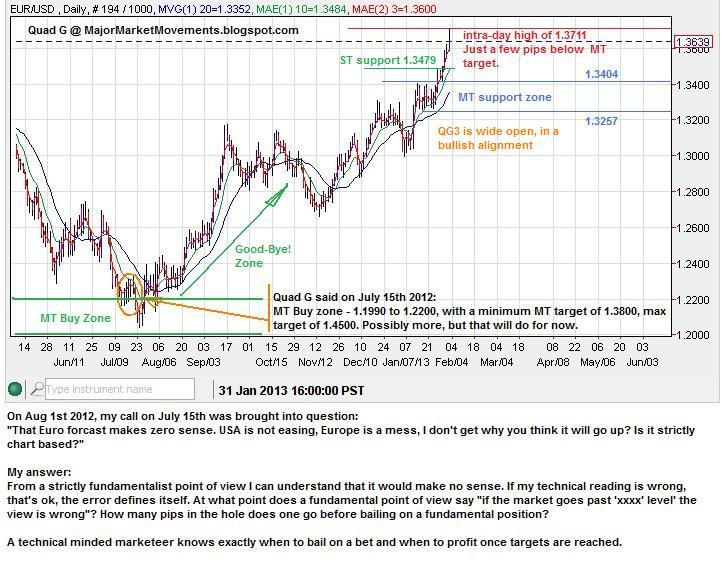
EUR/USD - Performing very nicely as expected, just a few pips away from an initial MT target of 1.3800. Friday almost closed the day with a bearish inverted hammer, no doubt some are taking profits nearing the 1.3800 level.
------------------------------------------------------------------------------------------------------------------------------------------
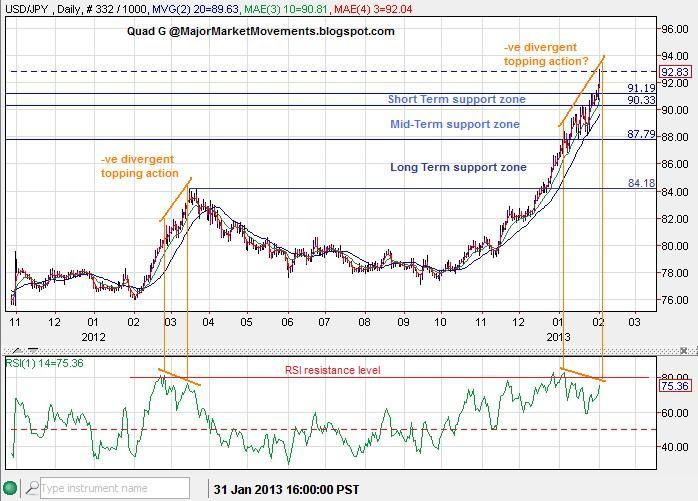
USD/JPY and YCS - It's been a spectacular and very much anticipated quick rise up. As USD/JPY is nearing 94ish, some topping action may become apparent this week and next as negative divergence in the RSI is starting to show itself:
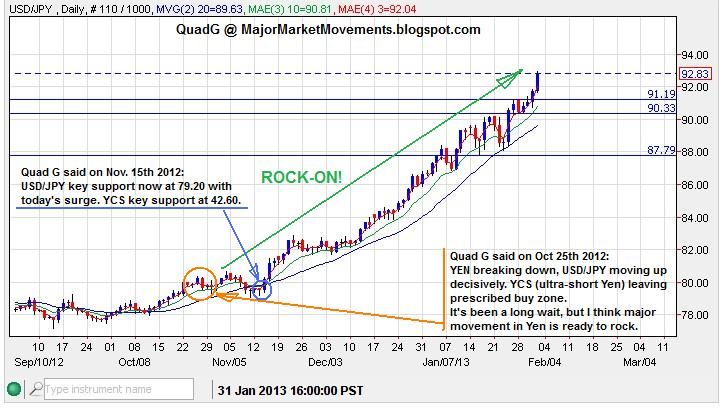
If one had shorted just one JPY/USD futures contract back in mid-november at .012400ish, with the price currently at .010772, you'd be sitting on a gain of about 1628 pips, or about $20,350 (in about 12 weeks time) on a contract that is asking for less than $2500 in margin. But be careful of getting too giddy and greedy, the time to take profits could come very soon.
YCS is a 3x bear ETF that gains when the YEN is moving down in value:
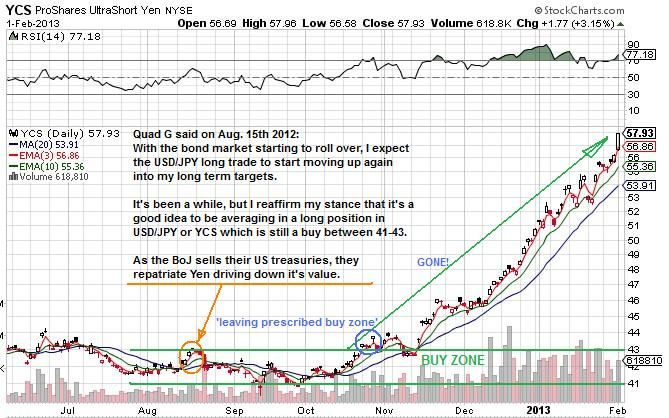
Nice gain so far, about 40% rise out of the buy zone so far. And sure enough, the 30year Bond market confirmed a top in Mid-July.
-----------------------------------------------------------------------------------------------------------------------------------------
Dow - Does this pattern look familiar to you:
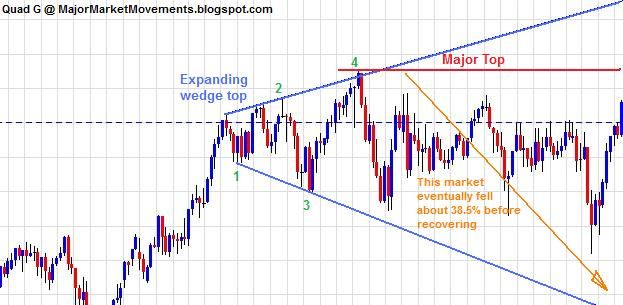
If not, this might jog your memory:
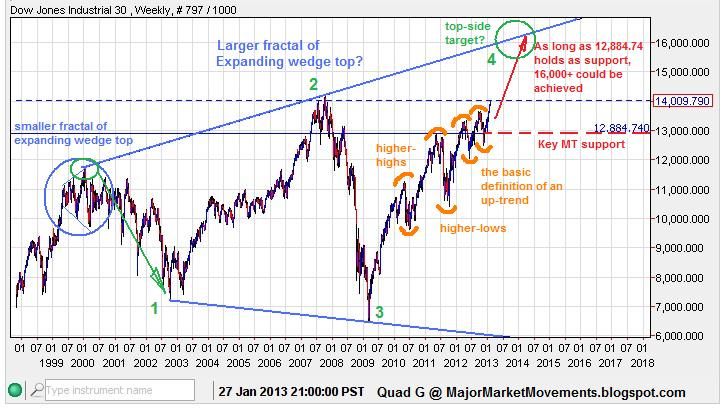
If the same pattern in a larger fractal was to play out, 16,000+ on the Dow looks feasible while the index continues to trade above 12,884.74. The previous resistance zone between 13,400 and 13,800, that is clearly breached, may also serve as support on any ST pull-backs.
-----------------------------------------------------------------------------------------------------------------------------------------
My QG3 Market Signal Service and related video is up and running, you can catch it here: http://majormarketmovements.blogspot.com/p/mmm-market-signal.html
I understand that the video is long, some may not have 52minutes to dedicate. With this in mind, I am also working on a static page that will show much of the same information, though not likely as detailed.
Also, I will be posting monthly results of the QG3 Market Signal Service here, as promised, in just a few hours. I want to thank all those that have decided to subscribe and take a chance with me in this new endeavor.
All the best to you,
Quad G