Showing posts with label AUD/USD. Show all posts

Sunday, July 28, 2013

MMM Weekend Update 7-28-13

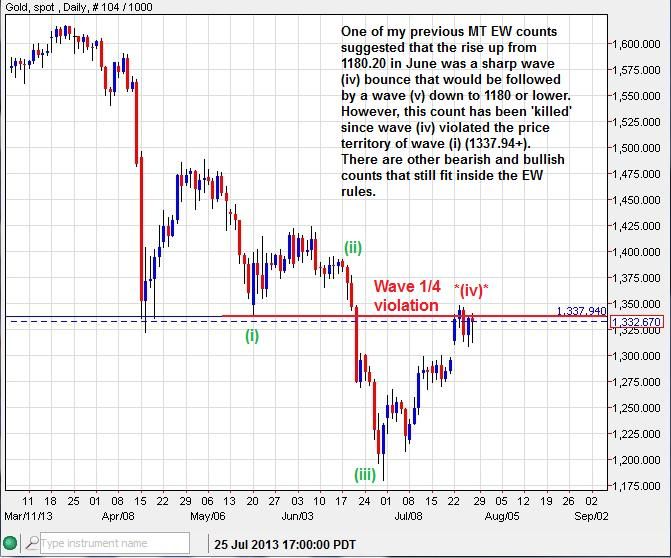
Gold - The previous MT EW count that suggested the current rise off of 1180.20 may have been a sharp wave (iv) green advance has been killed with a wave 1/4 violation above key resistance of 1337.94+ which is the price territory of wave (i). This changes the EW count in favor of some other more bullish counts. There is still another bearish EW count that could account for a dive to below 1180.20, but the price would need to sink below 1240ish before that probability increased.


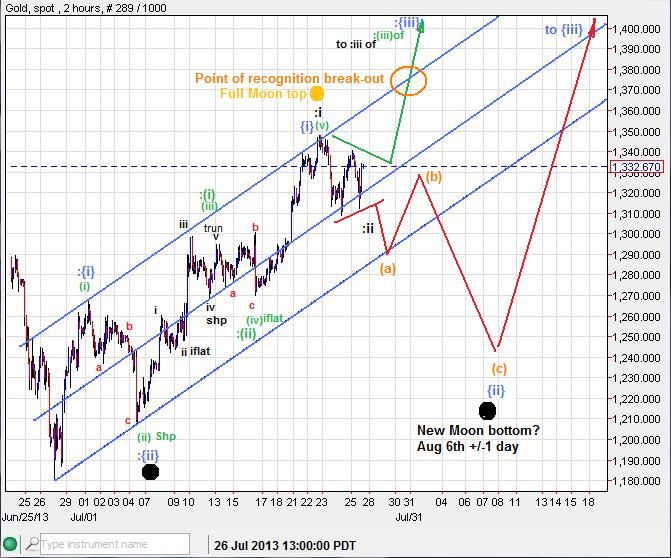
Here is an EW ST update:
The primary count suggests that the Full-moon top will hold and a 3 wave pull-back toward the next new moon could be seen over the next several trading days. The alternative (:colon) is far more bullish, but has some hurdles to jump over before coming into favor.


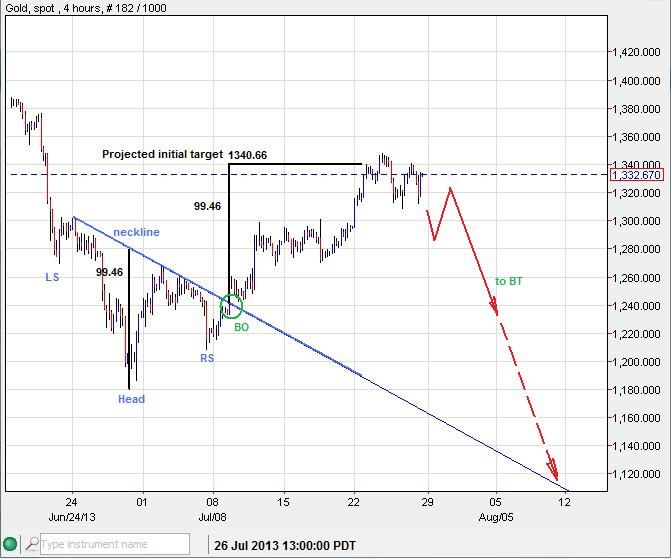
An iHnS pattern, highly 'skewed,' measured for a rough top fairly well. If the top holds, the Break-out of the neckline and even the neckline itself could get a back-test soon.


The New York market is the top dog of all the markets around the world. Seldom does a price move extend beyond NYs attention for very long. I typically gauge the NY market to be between the hours of 8am to 5pm EST. This is the span of time that the NY marketeers holds their chance to influence the gold market for the daily session. When the price moves through territory that NY has not had a chance to weigh in on, the tendency is for the market to eventually correct back into that price territory that I dub the NY 'dead space' during the NY time frame. NY doesn't like to be kept 'out of the loop'. So when you see an over night move run into new price territory, either up or down, know that the probabilities favor a return to that price territory later on during the NY hours.

Here is an example:
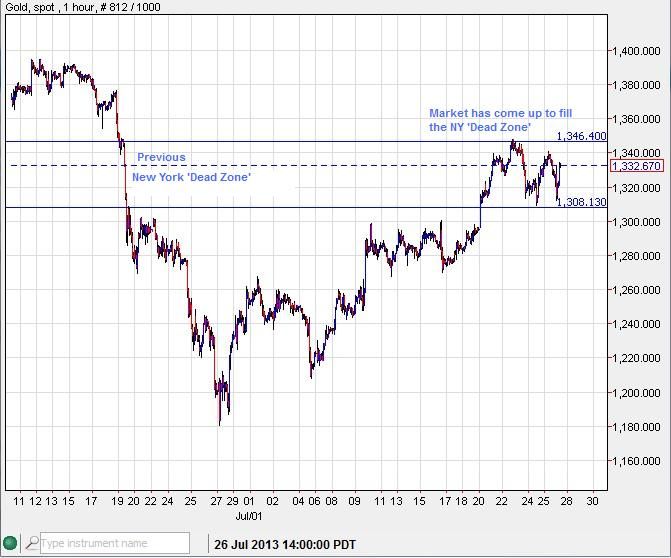


As you can see the over-night market made a big splash one day, leaving a void or Dead Zone that eventually was filled during NY hours. It looks as though NY has been comfortable with its new range now for a few days.

I recently spotted for my subscribers a ST top in Gold's price at 1347ish after observing a 4hr time scale 'hairy top':


---------------------------------------------------------------------------------------------------------------------------------
Silver - Not looking as hot as gold or GDX, leaving the whole PM complex in a quandary going into next week. The weekly closed as a bearish inverted hammer candle, setting key resistance at 20.60:
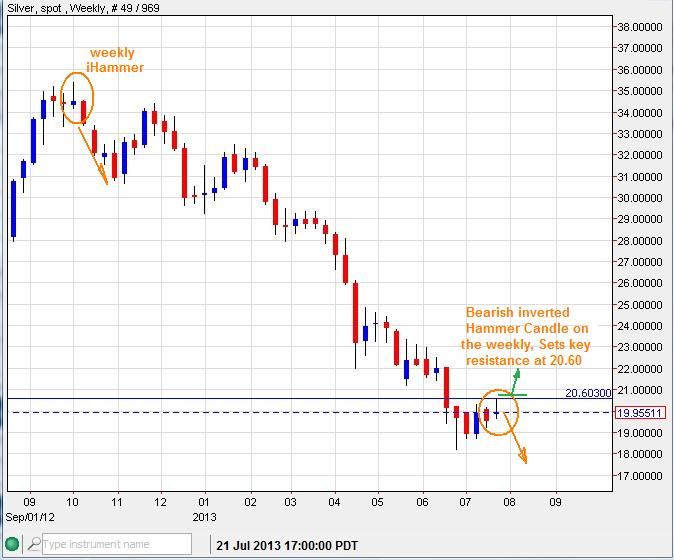


Weekly candles can often be responsible for moves that last at least a couple weeks, this would suggest that further selling is likely while below 20.60. If 20.60 is breached then another short squeeze could be realized.

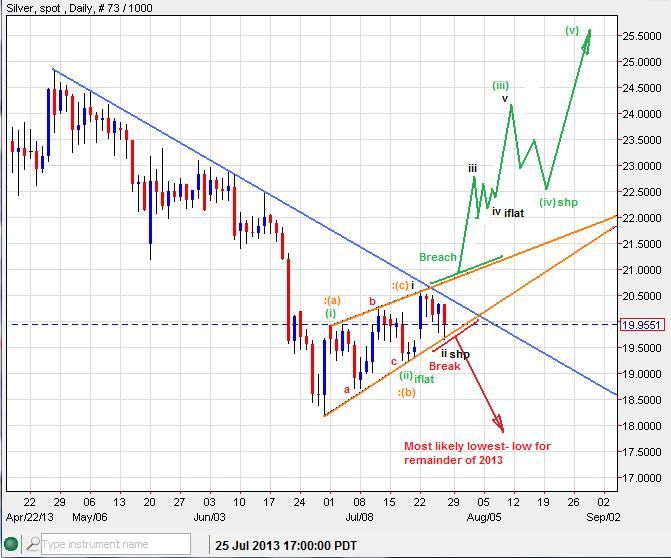
The Silver EW count has a bullish and bearish option, both with their own unique set of qualifiers.


---------------------------------------------------------------------------------------------------------------------------------

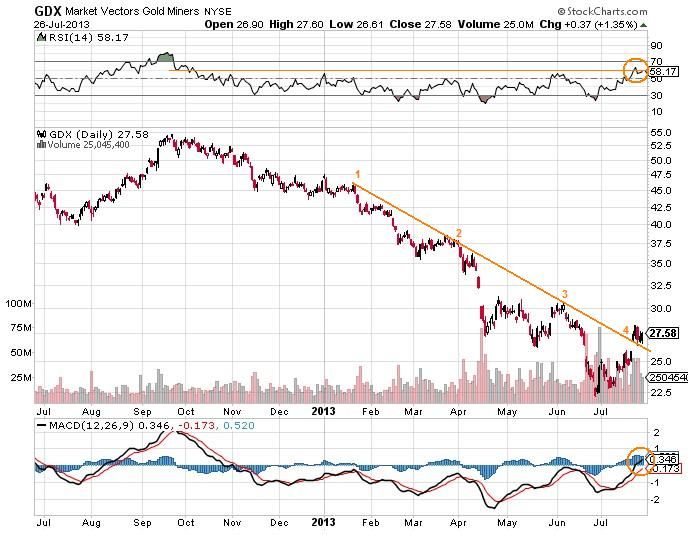
GDX - The miners have produced a Rule of 4 (Ro4) breach to the upside, with price currently riding above the break-out line. The oscillators RSI and MACD have also moved above some key levels. The MACD has moved above its zero line for the first time in months. And the RSI has moved above its 60 line. This all suggests that this market is in recovery. Even if this market was to fall again to a lower-low, I see it as another gift of a buying opportunity for the next MT bull run.


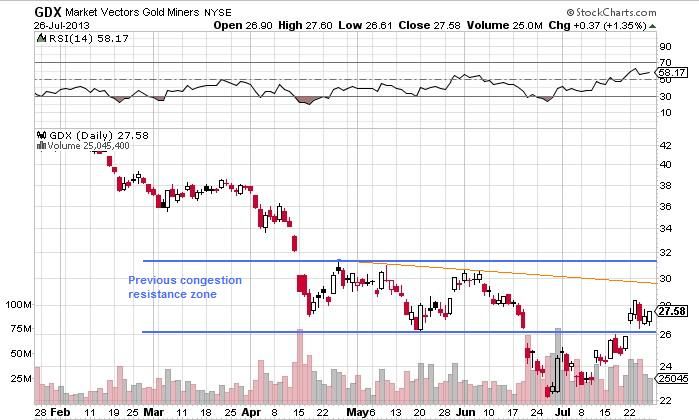
For now, in the ST, GDX is tangling with the resistance posed by the previous congestion zone.


----------------------------------------------------------------------------------------------------------------------------------

AUD/USD - Has a full count to the downside and is working on rolling out into a recovery:
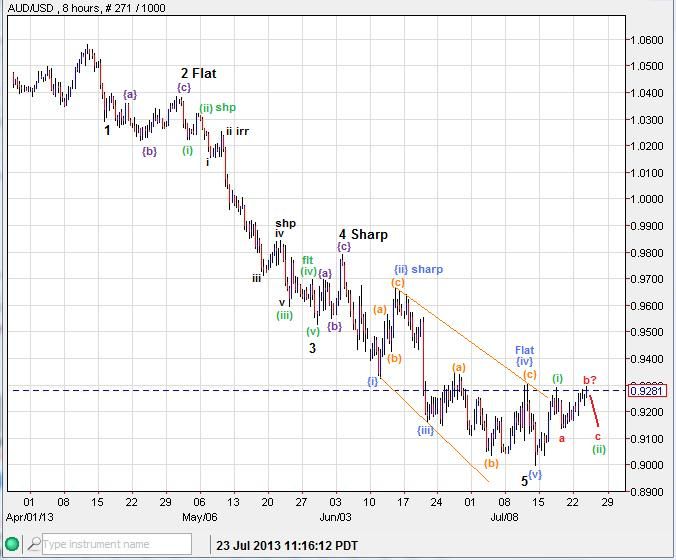


The price has also performed a Break-out and Back-test, this market is poised to move upward while above .9128


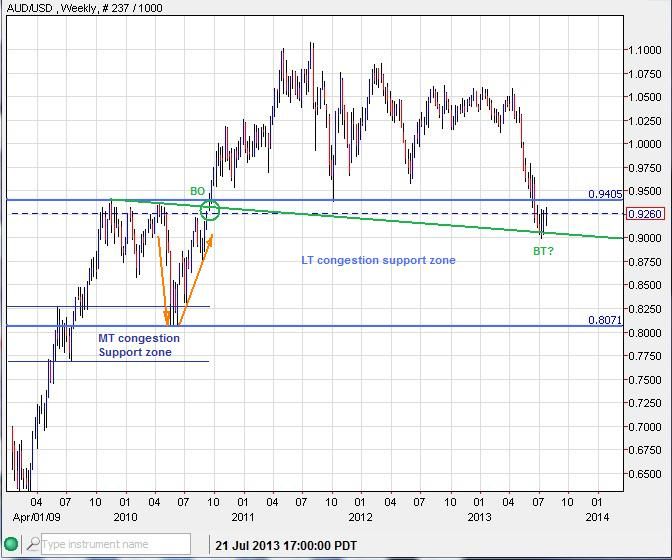
The Long term chart shows that price has come down to back-test an old break-out line inside a previous congestion support zone:


My QG3 trading method has produced some excellent results in this market since I took on the Aussie back in March. So far there has been about 1135 ticks of profit that have been locked in. One contract with an initial margin of $2,013 would have profited about $11,350 in just a few months (minus roll-over and broker fees).
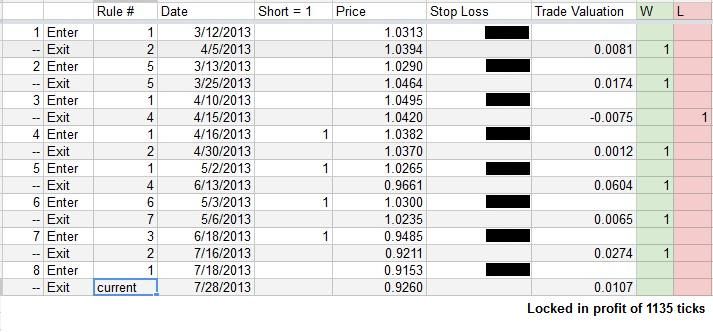


Much of which was due to the QG3 signaling subscribers to get in on the short side of this 'major market movement', keeping them in for most of the way down:
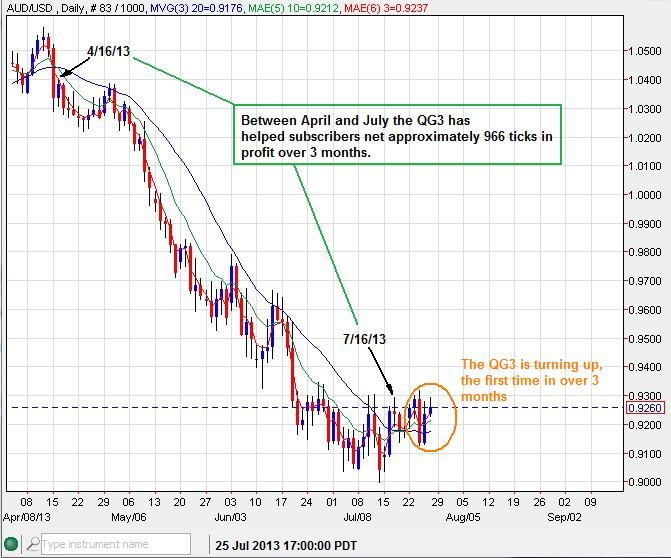


The QG3 trading method has now signaled to get prepared for the possibly of a long side advance.

If you are a trader and would like to receive my daily market updates, you may sign up here:
http://majormarketmovements.blogspot.com/p/mmm-market-signal.html


All the best to you this week,
Quad G


Sunday, June 2, 2013

MMM Weekend Update 6-2-13

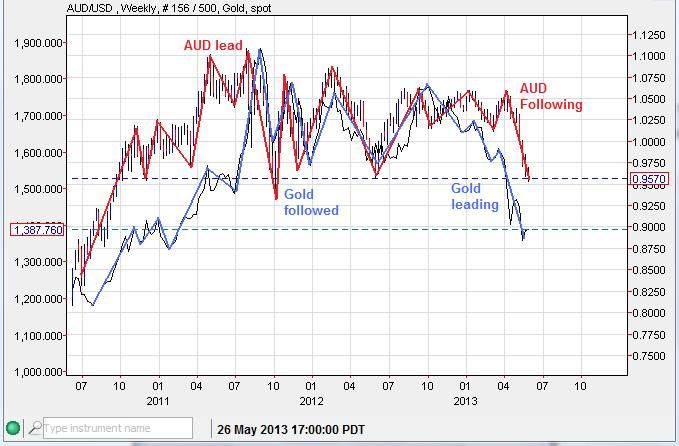
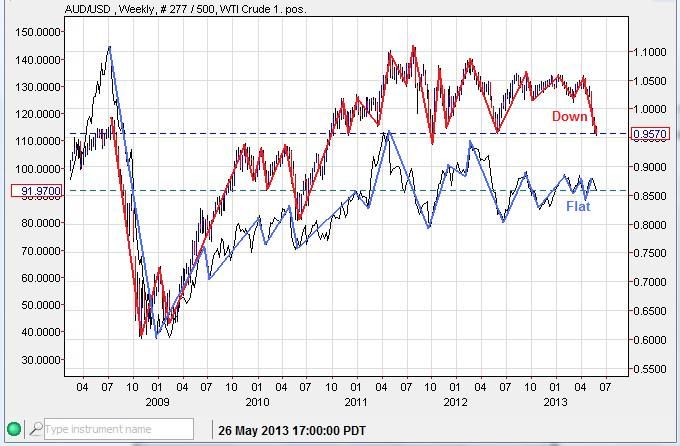
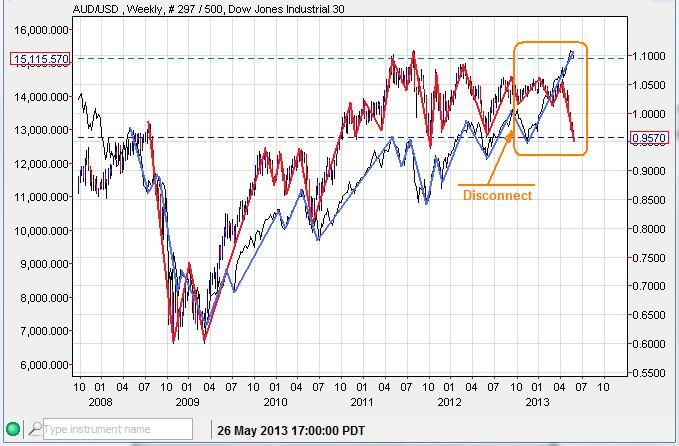
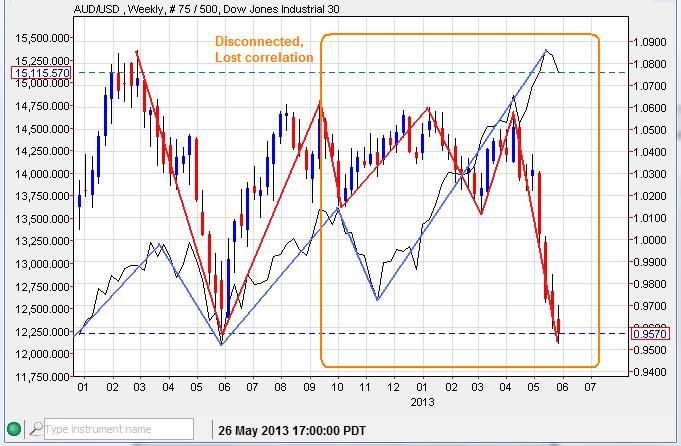
AUD/USD - The Aussie Dollar has had near perfect correlation to the Dow, Crude and Gold for several years now. This correlation has been near a ratio of 1:1 up until recently, when divergent disconnects have started to show.

The Australian Dollar (red) and Gold (blue) have paired up nicely, sometimes switching lead roles with each other. Currently Gold has lead the way down, with the Aussie lagging behind but catching up quickly:


The Aussie/Crude (WTI) has also enjoyed close company, except the recent plunge in AUD (red) has not yet been reflected in the price of Crude (blue) which has drawn flat in recent weeks:


The largest AUD (red) divergence is with the Dow (blue). The stock market has continued skyward, while the Aussie has collapsed:


I suspect that one of these markets in particular is lying, showing a strong face but weak in the knees (The Dow). Perhaps the tremendous Yen intervention by the BoJ has caused the currency markets to temporarily disconnect from their old paradigms. Either way, something is amiss and will likely see a correction soon. I think the Aussie is like a canary in a coal mine, it's either going to choke on the fumes of toxic monetary intervention or has some how died of natural causes (which I highly doubt). The Australian economy is a chief exporter of raw materials and energy to the Eastern and Western economies. Generally a fall in the value of AUD, signals that export demand is shrinking, AUD denominated raw materials and energy ceases to be bid up, reducing demand for the Aussie, thus it's value. Most likely an indication of yet another global economic slow down.
We'll see. Crude Oil is the fence sitter, a leap into bull or bear territory in the weeks ahead, breaking out of it's current consolidation, should make the forth coming trend obvious as to it's next MT direction.

---------------------------------------------------------------------------------------------------------------------------------------

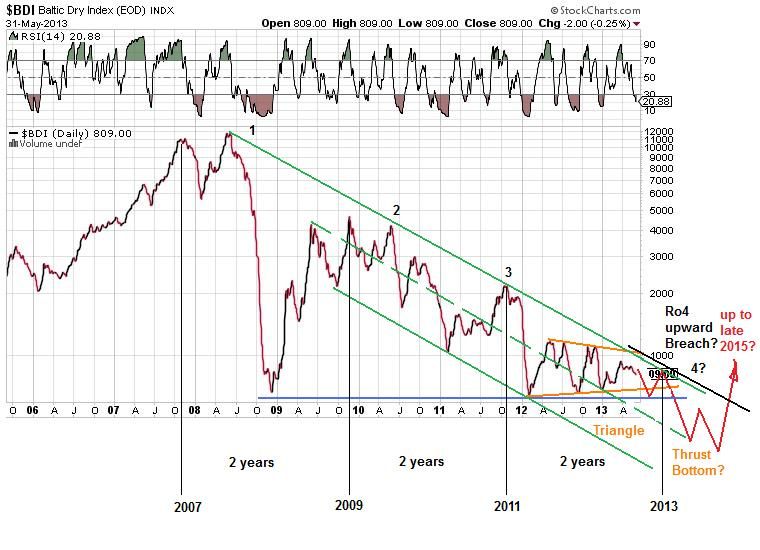
BDI - Baltic Dry Index. Has been a bellwether of global economic activity, From the top in 2007, the index has been looking for a major bottom along with the global economy. The current triangle/thrust pattern and choppy movement above a mid-channel line suggests that the BDI may have at least one more shot down to finalize a bottom in the months ahead, likely unwinding any of the last long side speculation. A Rule of 4 (Ro4) breach above the descending channel (green) should confirm a bottom.


--------------------------------------------------------------------------------------------------------------------------------------

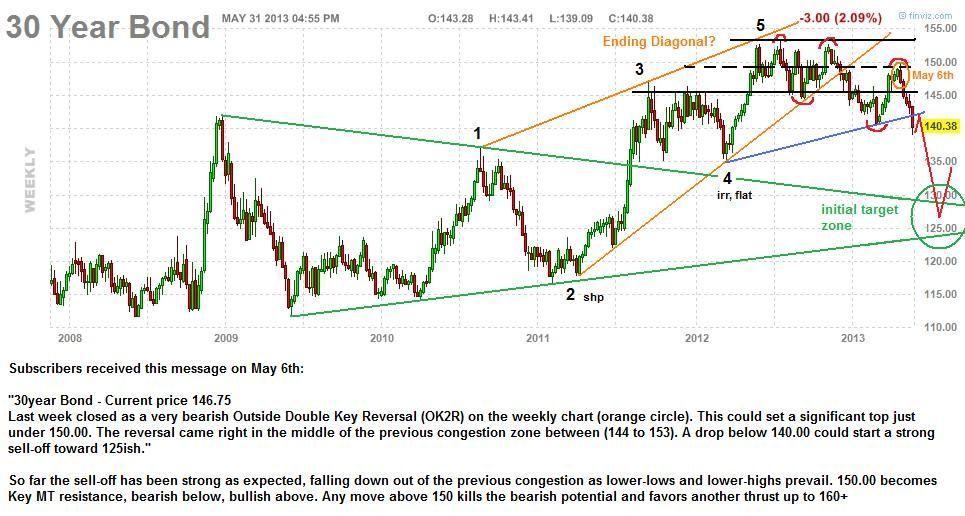
30 Year Bond - The 'Long' bond has had a very consistent 30 year peak-to-trough cycle well into the 1800s. The last trough in price (peak in yield)was in 1981, here it is 32 years later and a peak is due (low in yield). I suspect that major FED involvement (quantitative easing) has caused this 30 year cycle to extend to some degree. However, I doubt that the FED will be able to hold off this cycle much longer. Those that have paid attention to my blog know that I have been hunting for a major top in the Bond market for a few years now. The most recent activity has been giving clues that another potential major top is in place. The action could be that of a stealthy roll-over, with a wash-down soon to be realized, but must keep under 150.00.


As global credit markets continue to be hit by the profligate financial maneuverings of central banks and nations, the US long bond will either be the last life boat in the credit market or go down with the ship. Time is not on it's side according to the 30 year cycle.


Good Hunting Folks,

Quad G

If you would care to receive my daily email updates on market conditions, you may sign up for a free 15 day trial here:
http://majormarketmovements.blogspot.com/p/mmm-market-signal.html


Sunday, May 26, 2013

MMM Weekend Update 5-26-13

Gold - Is currently navigating the previously mentioned support zone of 1310 to 1430. The initial dead cat bounce up to 1488 has now settled back down along with some of the volatility. While the price remains below 1440 to 1488, I suspect the trend will continue to move sideways and down. Above that zone allows a possible run up to 1520 to 1600.

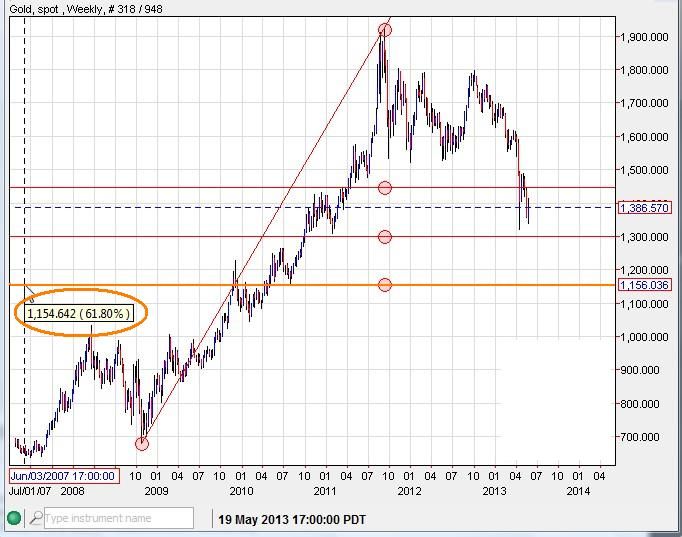
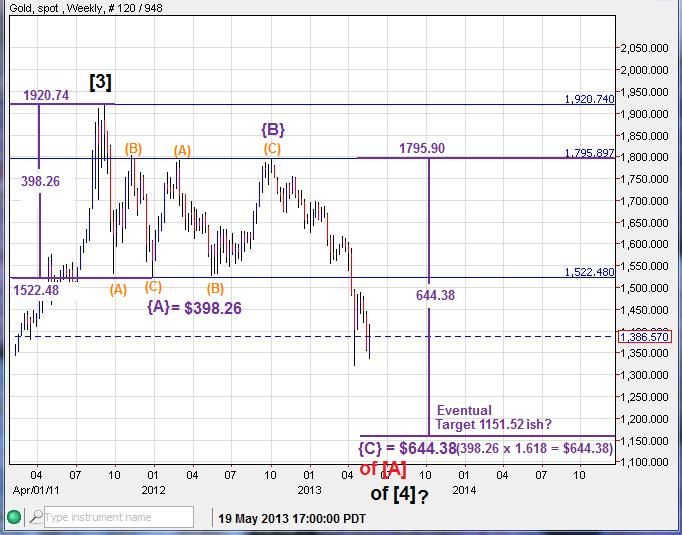
In previous blog postings I have laid out the case for 1230 to 1280 being the next level of significant support and 850 to 1050 likely being bedrock generational support. However, a few other measurements seem to be pointing to the 1150ish level as possible support as well.


If the price actually falls to this level, I'll be on the look out for possible reversal patterns using Elliot Waves, Candlesticks and the QG3.

------------------------------------------------------------------------------------------------------------------------------------------

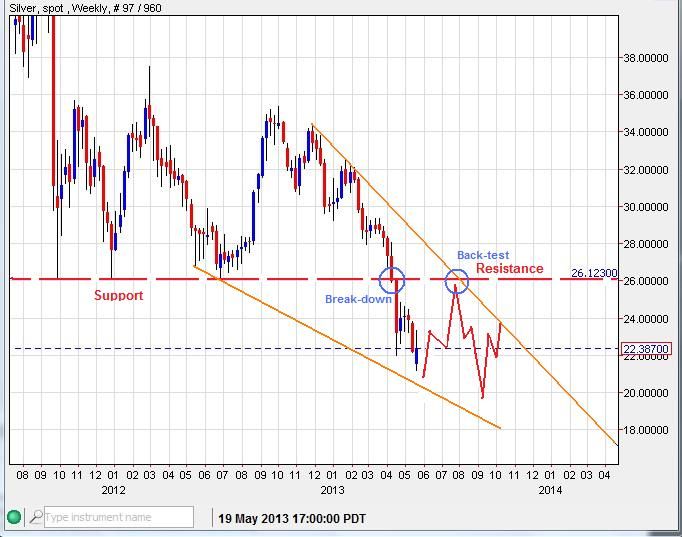
Silver - Unlike Gold, Silver has yet to back test even a small portion of it's break-down. As positive divergences develop in the Oscillators (RSI(14), MACD), I suspect that this back test of the 26.00 level may be realized, possibly inside the next few months. But I highly doubt the first back-test will breach 26.00, a back-up for another run at it later (several months perhaps) is more likely to breach it. A contracting ending diagonal pattern (orange) would be very helpful in gauging a potential major bottom.


------------------------------------------------------------------------------------------------------------------------------------------

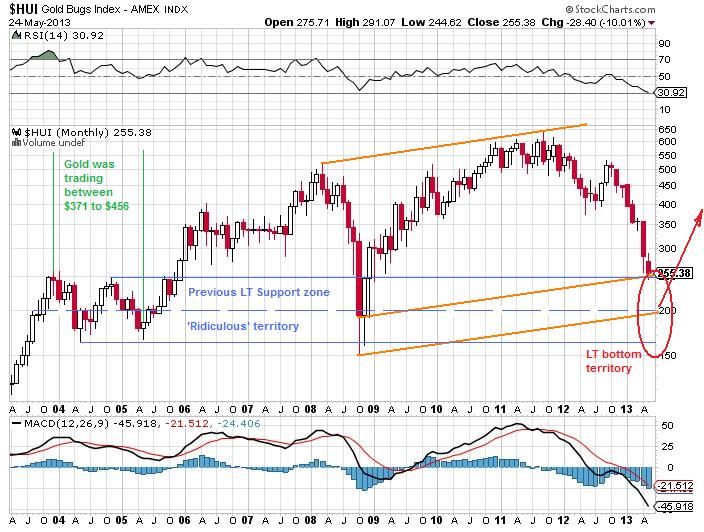
HUI (miner index) - is starting to touch the top of some major LT support. Any further down and stock prices will reach into 'ridiculous' territory. Several senior dividend paying mining stocks now have P/Es in the teens and even single digits. I don't suspect this condition to last for very long.


------------------------------------------------------------------------------------------------------------------------------------------

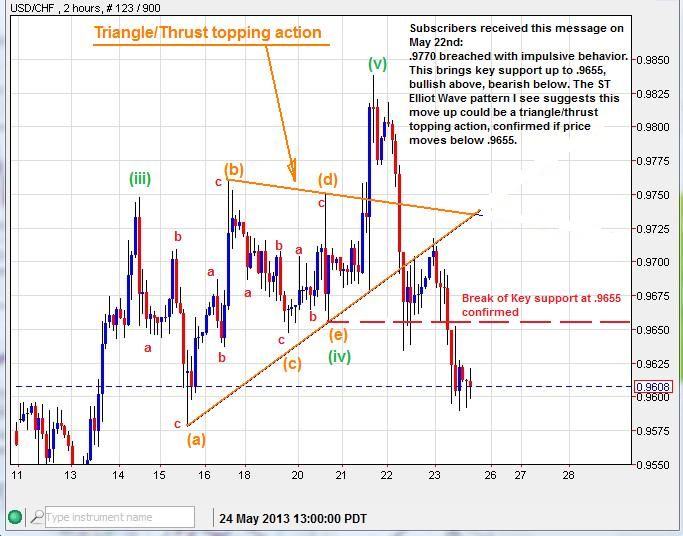
USD/CHF - Produced a text book 'Triangle/Thrust' topping formation leading a downward move into what is likely to be a larger ST consolidation.


-----------------------------------------------------------------------------------------------------------------------------------------

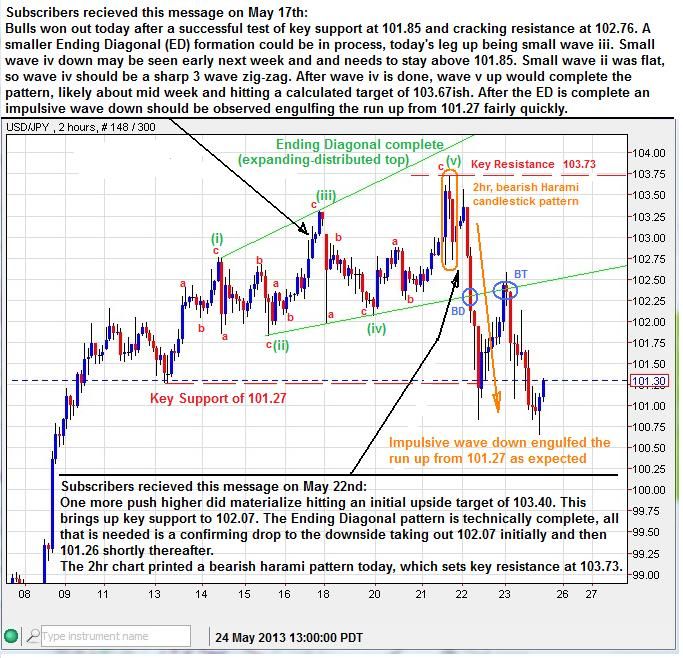
USD/JPY - Produced a text book Ending Diagonal pattern (expanding type - distributed top)


-----------------------------------------------------------------------------------------------------------------------------------------

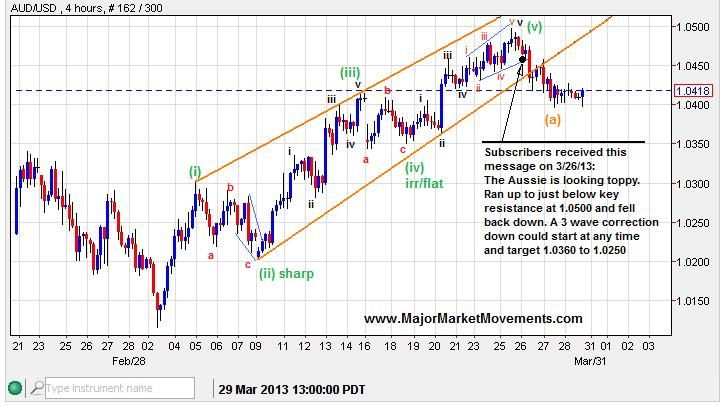
AUD/USD - Elliot Wave and Candlesticks can be useful for identifying ST tops and bottoms, But the QG3 is designed to catch and land the 'big fish'. Our current Short position in the Aussie is likely to net a 'lunker' of several hundred ticks.


----------------------------------------------------------------------------------------------------------------------------------------

If you are interested in taking advantage of some Elliot Wave, Candlestick and QG3 signals, consider becoming a subscriber and receive my daily email updates. Sign-up here for a 15 day free trial:
http://majormarketmovements.blogspot.com/p/mmm-market-signal.html

Good Hunting,
Quad G
Sunday, May 12, 2013

MMM Weekend Update 5-12-13

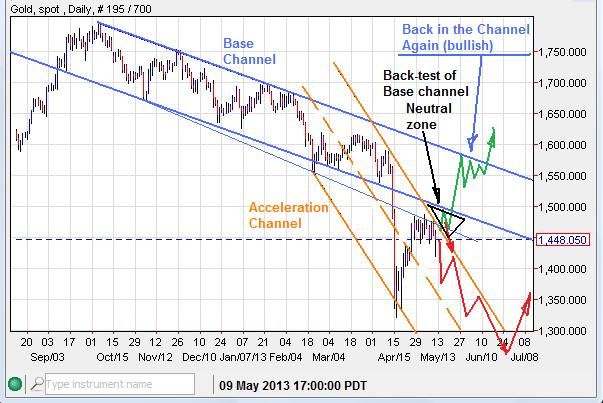
Gold - Is in the process of back-testing the previous break-down out of a base channel. A successful test would see a rejection soon and at least one more leg down (red projection). However, if instead the price moves above the 'neutral zone', back into the channel again, the MT outcome could be very bullish.


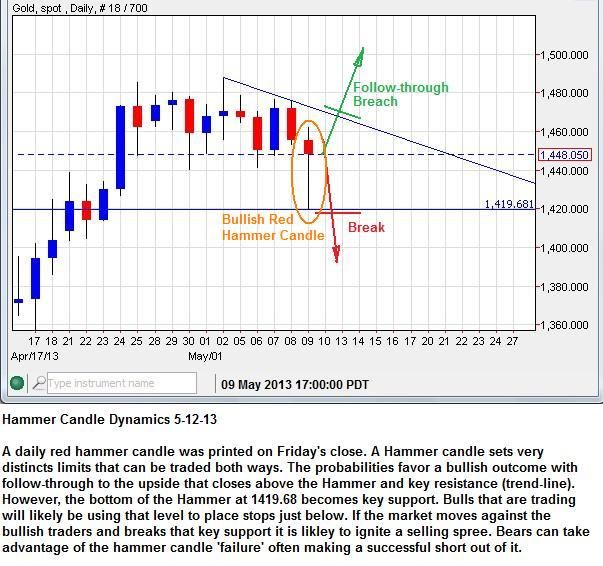
Last week closed with what is typically a bullish hammer candle on Friday, but it's important to understand the 'flip side' of such candles. Playing candles is playing probabilities, there is a bullish and bearish one in each hammer candle:


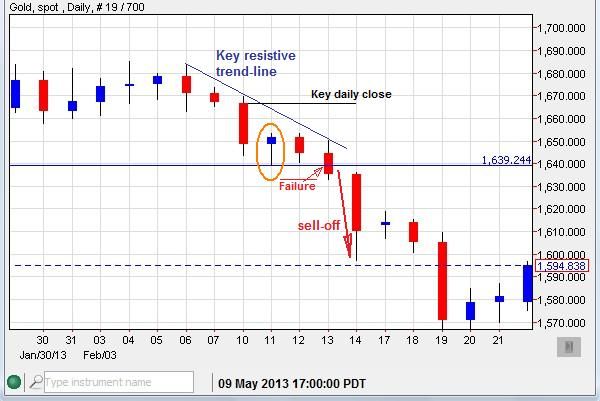
Here is an example of a bullish hammer candle that failed:


---------------------------------------------------------------------------------------------------------------

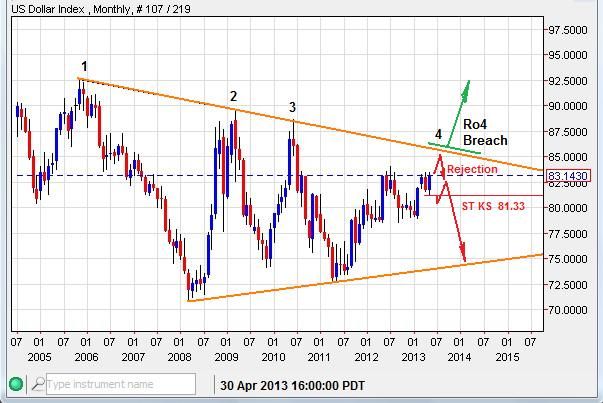
USD - Has been consolidating the last 4-5 weeks, a thrust to the upside could challenge a long term trend line above for the 4th time. As you know I'm a fan of the 'Rule of 4' (Ro4) which has a high probability of producing impulsive behavior when triggered.


---------------------------------------------------------------------------------------------------------------

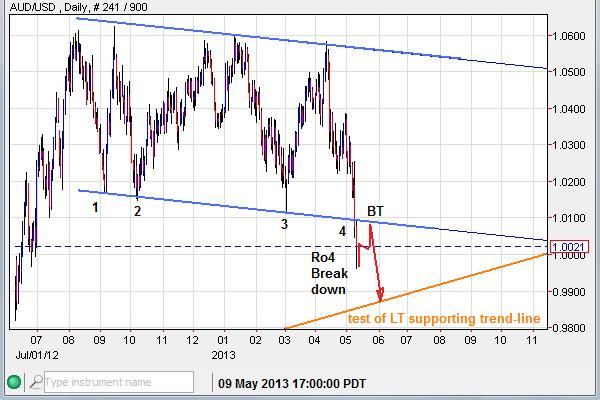
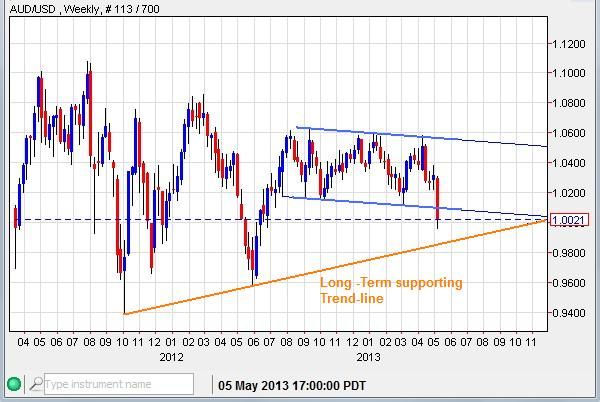
AUD/USD - Has produced a great example of a Ro4 that was triggered to the downside:


---------------------------------------------------------------------------------------------------------------

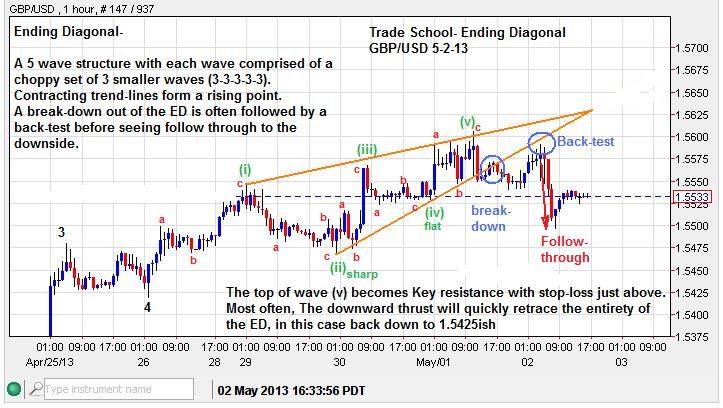
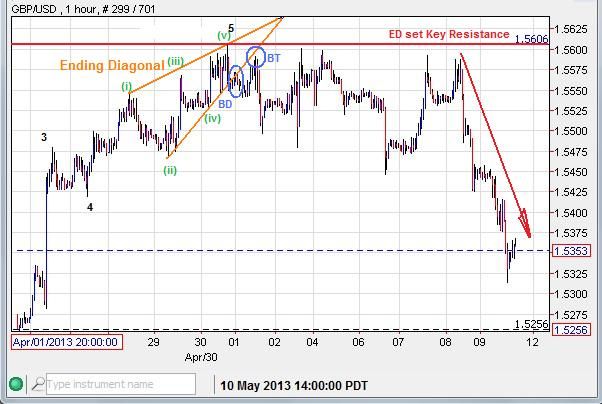
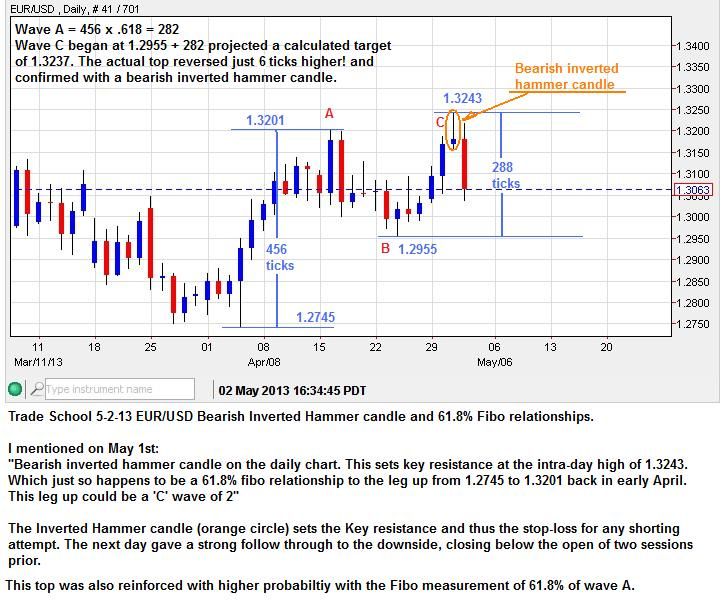
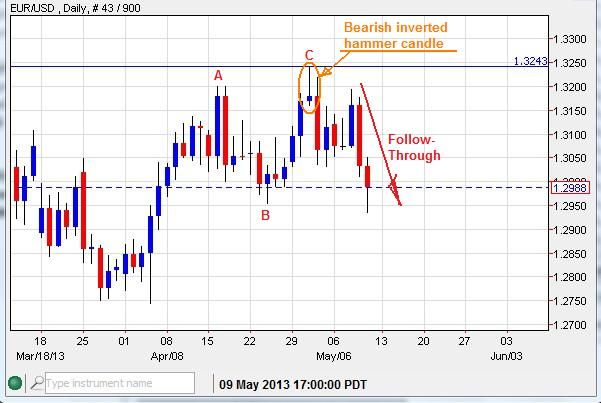
Trade School - As part of my QG3 market signal service, I identify chart patterns that offer a high probability of providing a successful trading outcome. Recently I outlined a successful Ending Diagonal pattern in GBP/USD and a key bearish Hammer Candle as part of an ABC fibo price relationship in EUR/USD.

GBP/USD - Ending Diagonal


Outcome:


EUR/USD - Bearish Inverted Hammer on the Daily and ABC Fibo relationship:


Outcome:


------------------------------------------------------------------------------------------------------------

If you are interested in receiving my daily QG3 Market Signal Service updates, you can sign-up here:
http://majormarketmovements.blogspot.com/p/mmm-market-signal.html

The QG3 method of trading is not for everyone. I've included a 15 day trial period to check out the method to see if it works for you.

Good Hunting out there,
Quad G

Sunday, March 31, 2013

MMM Weekend Update 3-31-13

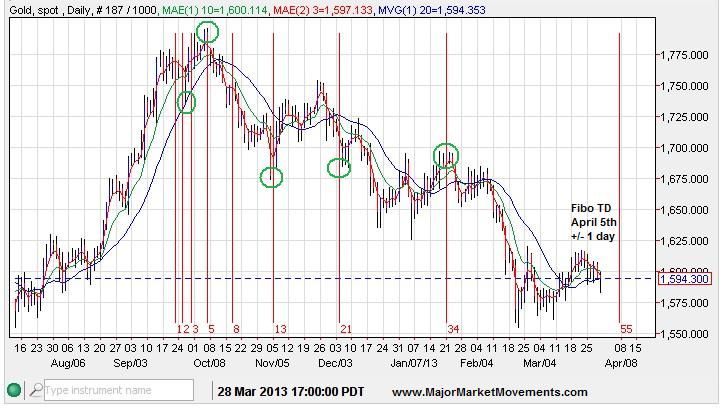
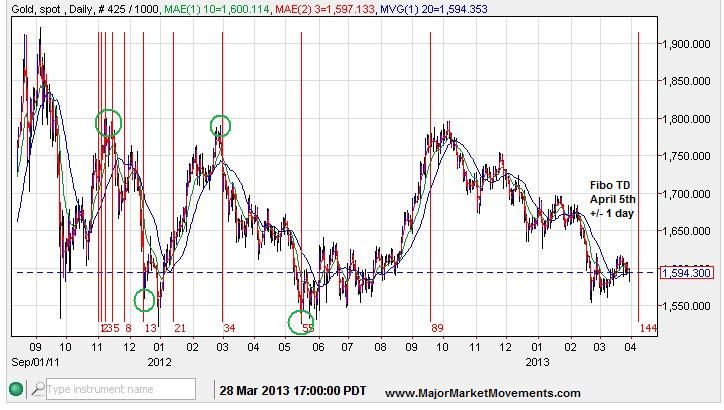
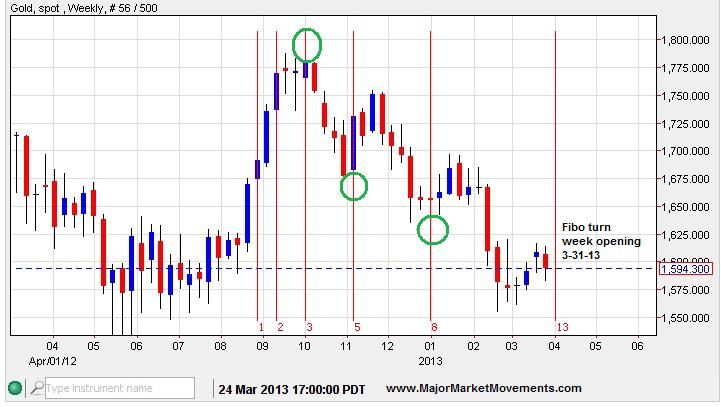
Gold - Another Fibo turn date is coming up this week for April 5th +/-1 trading day, though it could be somewhat less significant than the turn date I called for that materialized on March 8th. Employment numbers are also due out the morning on April 5th. A low into that date would suggest a bottom, a high into that date would suggest a top.


--------------------------------------------------------------------------------------------------------------------------------

Silver - Still battling it out between bull and bears, no decisive winner yet, though the QG3 did turn bearish on Friday.


--------------------------------------------------------------------------------------------------------------------------------

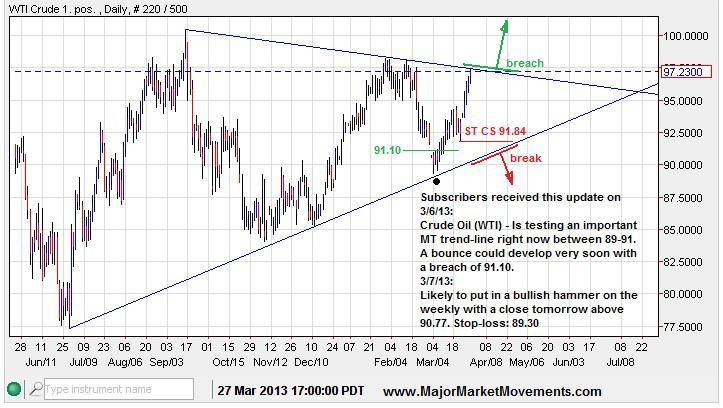
Crude (WTI) - Price is between converging trend-lines, further upside this week above 98ish would suggest crude is likely to continue up to test 104ish.


--------------------------------------------------------------------------------------------------------------------------------

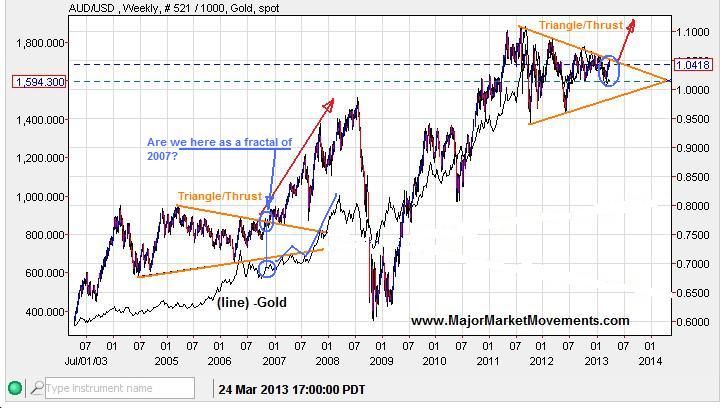
AUD/USD - The multi-month triangle pattern that I have been looking for an end to, now has a very high probability of being complete with an impulse wave finishing up from 1.0115. If true, the proceeding break-out above the triangle could possibly target 1.2000 as even more liquidity pours into the broader economy. Paper then chases physical assets driving prices up. Gold, Dow and Crude correlate to the Aussie fairly well. If the Aussie is on the verge of a thrust up then PMs, Stocks, and Energy may all be rising on a flood of liquidity.
Australia is a very commodity rich nation as a chief exporter. They have also discovered deposits of frackable crude in south central Australia that is potentially as vast as the reserves in Saudi Arabia. A land rush in oil investment may soon sweep Australia, while crude prices remain relatively high.


--------------------------------------------------------------------------------------------------------------------------------

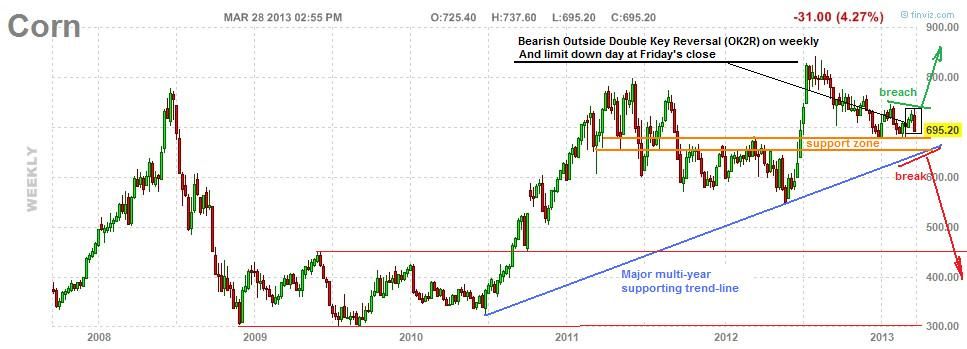
Corn - Made a very bearish move, limiting down on Friday because of a USDA report showing increased growing acreage and increased stocks of Corn, Wheat and Soybeans. An indication that demand is lagging an increase in production.


-------------------------------------------------------------------------------------------------------------------------------

If you would appreciate to receiving my daily email updates regarding movements and possible trades in multiple markets, you can sign up for my QG3 market signal service for only $20.00 a month, that's a little less than a $1 per market active day.
http://majormarketmovements.blogspot.com/p/mmm-market-signal.html

Good Hunting this week,
QG
Sunday, March 24, 2013

MMM Weekend Update 3-24-13

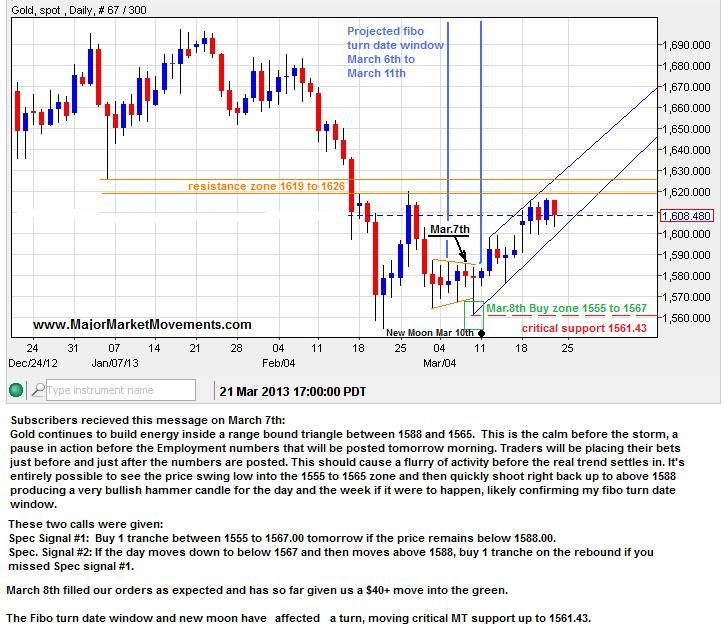
Gold - Just under key resistance zone between 1619 and 1626. Critical MT support is at 1561.43


Antimagnetic, a well respected contributor over at my thread on the Kitco Forums provides some important CoT data that supports the suspicion that a bottom has likely formed. Small speculator positioning is back to mutli-month lows.


--------------------------------------------------------------------------------------------------------------------------------------

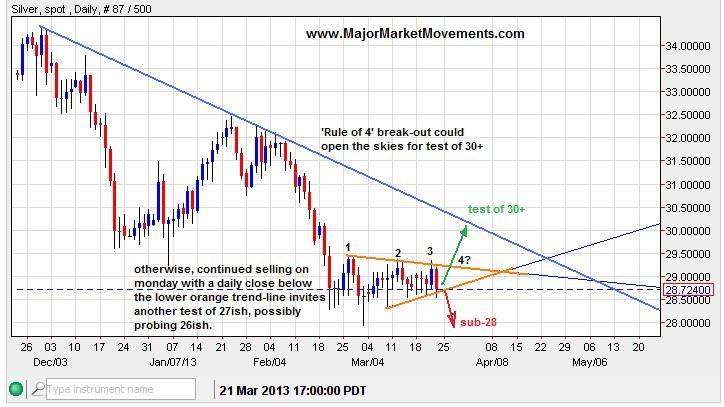
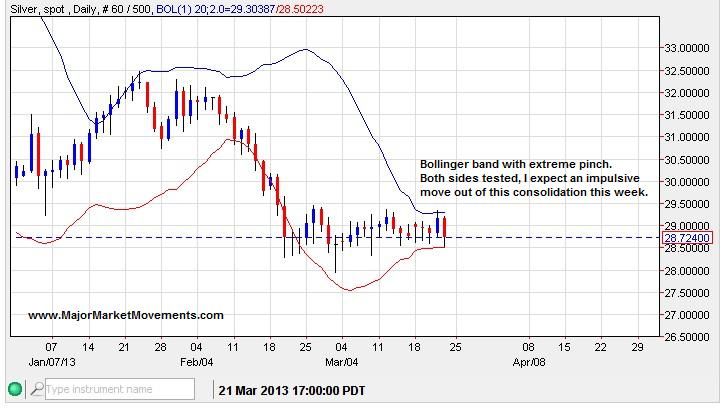
Silver - Silver is in a Pinch, a Bollinger Band pinch. I don't think this condition will last very long, a pop out of this consolidation could start at anytime. Both sides of the bands were tested last week. The next QG3 cross-over is likely to spear head an impulsive run.


Price is still confined inside contracting range bound action, but a break-out could come very soon.


-------------------------------------------------------------------------------------------------------------------------------------

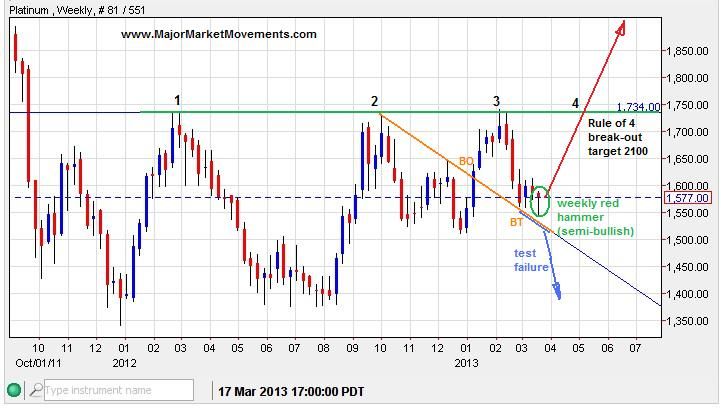
Platinum - Price did in fact drop to back-test it's previous break-out providing a buy op. A rally back up to above 1734 should trigger a 'rule of 4' breach to the upside with a measured target of 2100ish. Price must keep above the orange break-out line or risk failure.


-------------------------------------------------------------------------------------------------------------------------------------

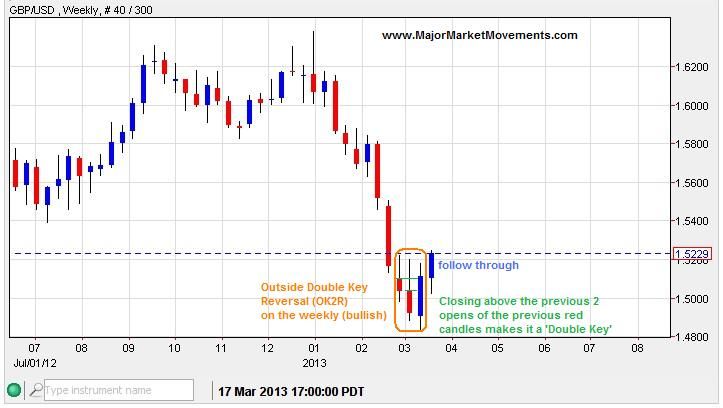
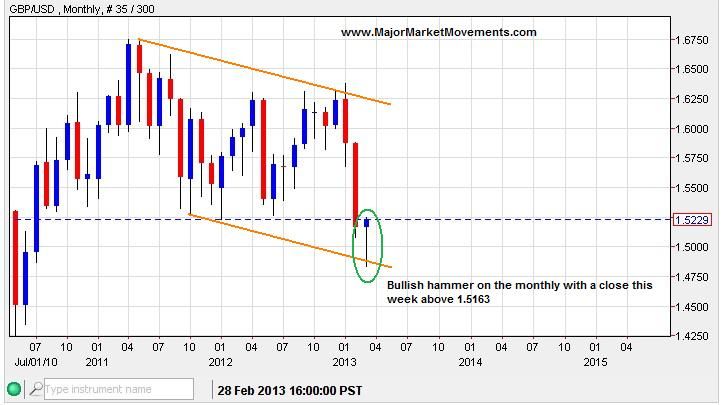
GBP/USD - Candle patterns in the Weekly and monthly time frames are pointing up, targeting a zone between 1.5420 and 1.5825.


Another talented contributor over at the Kitco forums produces some very well crafted Elliot Wave counts. HoldemPlayer is a stickler for EW rules, which I greatly appreciate. His most recent EW count in GBP/USD also suggests a significant bottom is in place and projects a target up to 1.5800+ over the next several weeks.


------------------------------------------------------------------------------------------------------------------------------------

AUD/USD - Has moved up very nicely out of the ending diagonal pattern and hammer candle that was mentioned previously. My subscribers were able to take advantage of a buy zone between 1.0155 and 1.0215 before the price took off north to 1.0400+


-----------------------------------------------------------------------------------------------------------------------------------

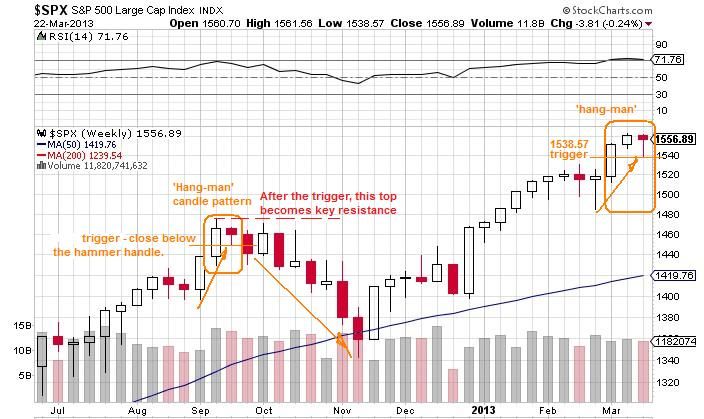
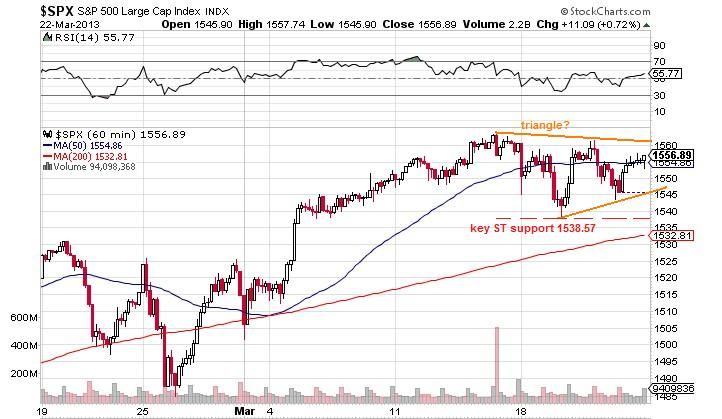
S&P500(SPX) - Some topping action could be triggered soon if this week closes below 1538.57. Otherwise, further consolidation above that level in the form of a triangle could produce yet another higher-high above 1563.62.


----------------------------------------------------------------------------------------------------------------------------------

If you would like to receive daily email updates from me regarding movements and possible trades in multiple markets, you can sign up for my QG3 market signal service for only $20.00 a month, that's a little less than a $1 per market active day.
QG3 Market Signal Service

Good Hunting this week,
Quad G