Sunday, June 30, 2013

MMM Weekend Update 6-30-13

Gold and Silver, - A ST and possible MT bottom was formed last week as expected. Here are the clues that suggested a turn up was very close:


Silver also added to the chorus with it's Triangle/thrust bottoming action:


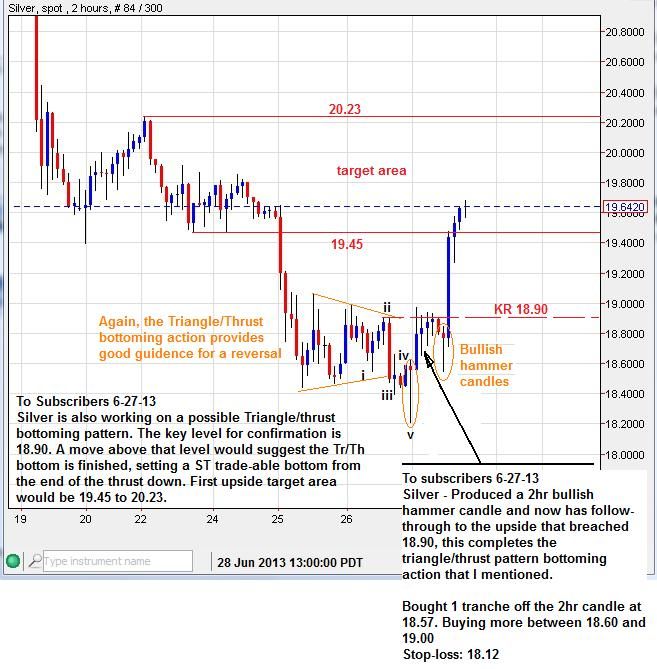
On the near term horizon with successful follow-through this coming week, The attitude of the next wave up is key in determining how the MT may continue to unfold.

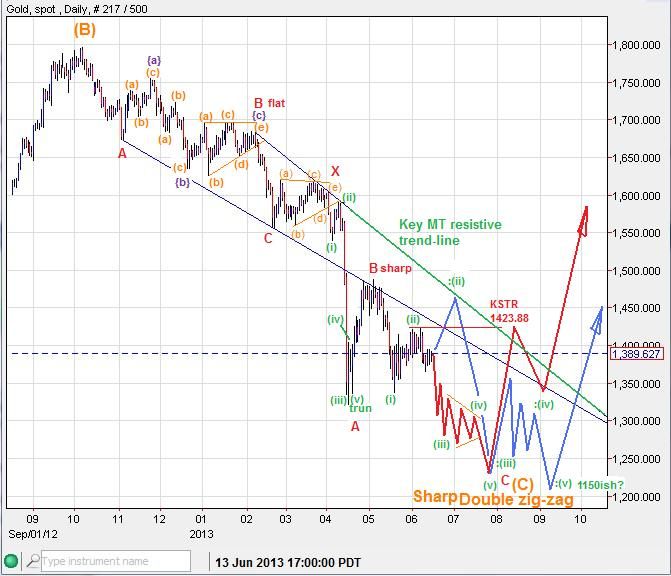
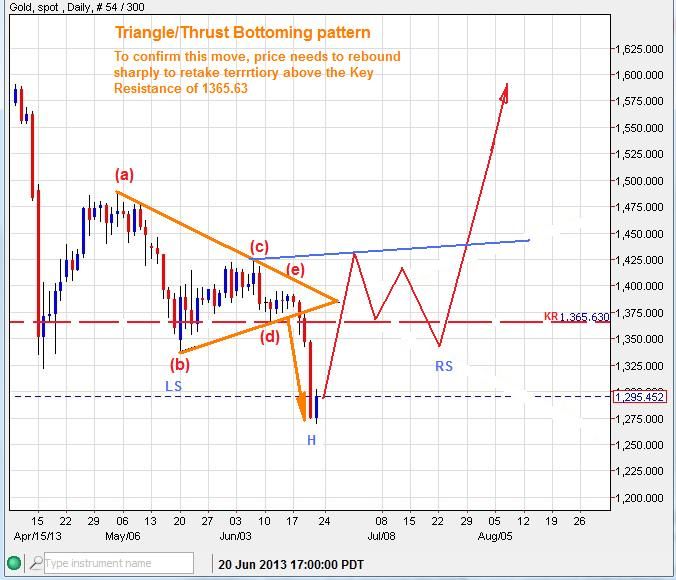
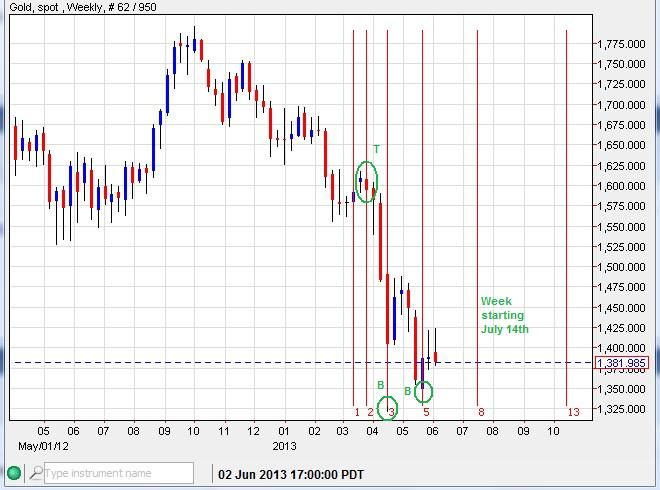
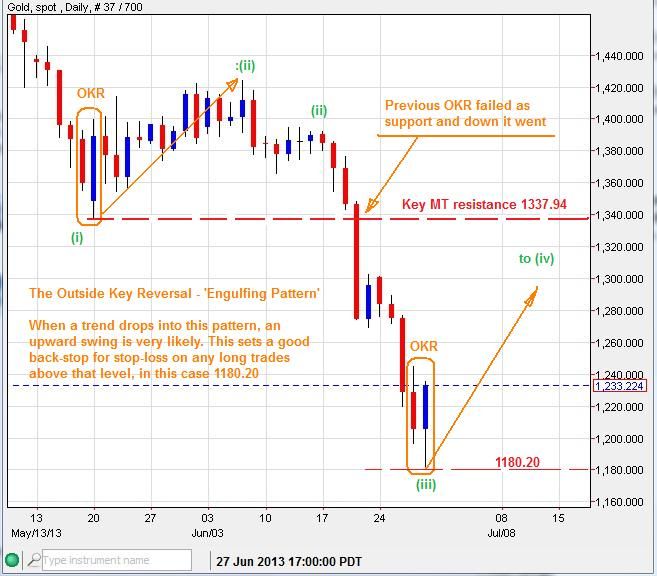
A quick 5 wave impulse up that confirms the larger triangle/thrust (Tr/Th) count needs to breach the MT down trend-line (green) and 1337.94 as a 'point of recognition', then take out the top of the previous wave (e) 1394.88. A subsequent back-test and higher-low could be seen in late July before another thrust up.


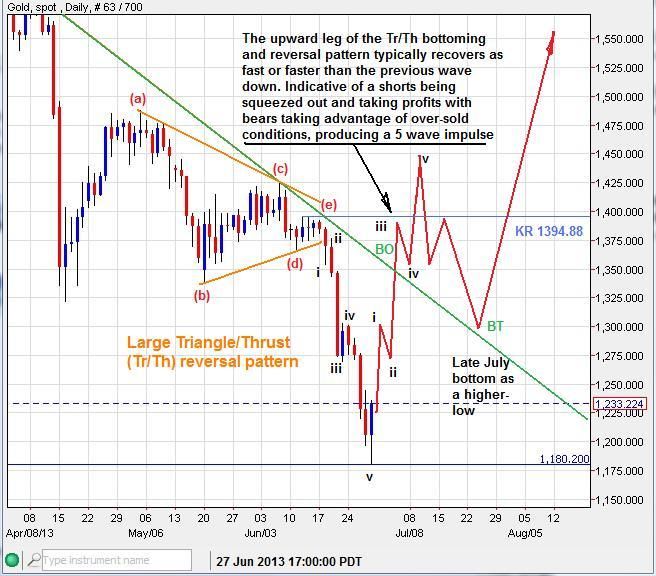
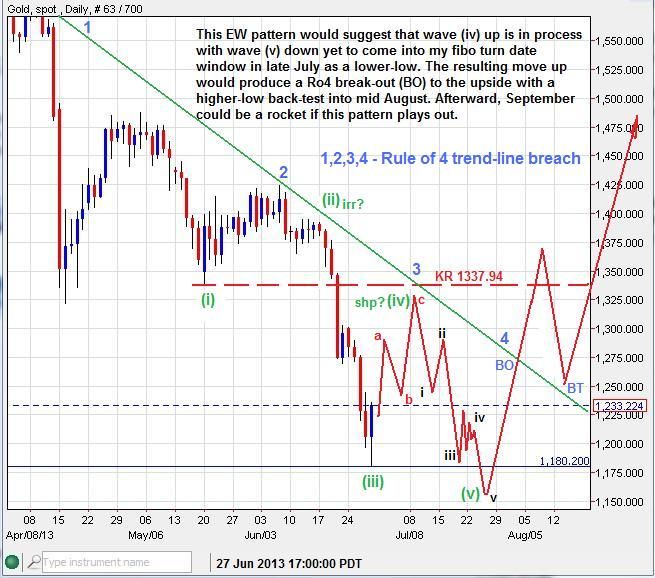
The alternative suggests that 3 corrective waves up(red-abc) that stays below 1337.94 will foster yet another 5 wave impulse down to a lower-low in late July. The resulting move up may produce a Ro4 breach to the upside and a higher-low back-test in mid August. This could be the final low to finish the MT count down from 1795ish.


The daily OKR on Friday is a good start for a multi-day run while above MT key support at 1180.20


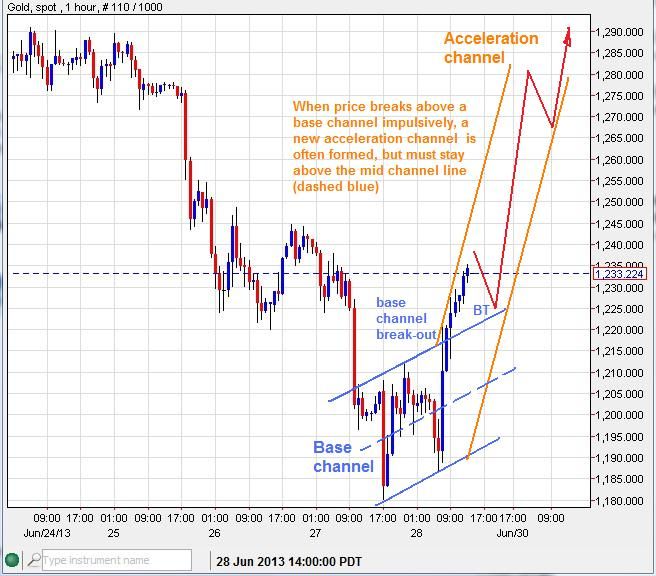
On the 1hr chart, a base channel break-out is evident, which suggest that an acceleration channel is in progress while above 1212 and the mid-channel (blue dashed).


----------------------------------------------------------------------------------------------------------------------------------------

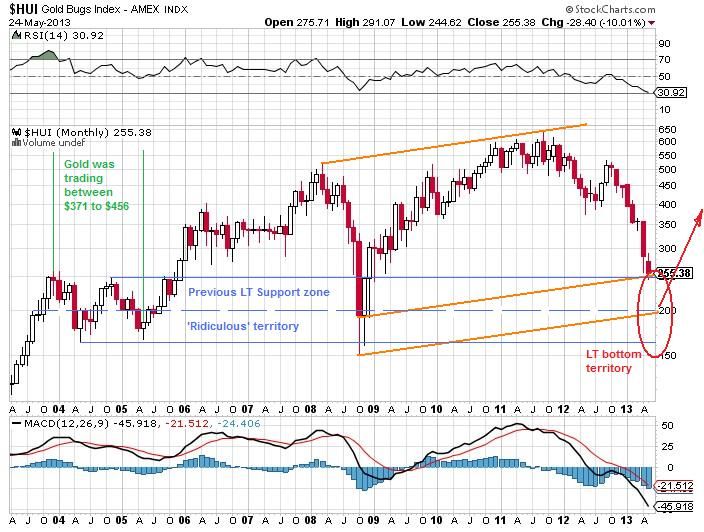
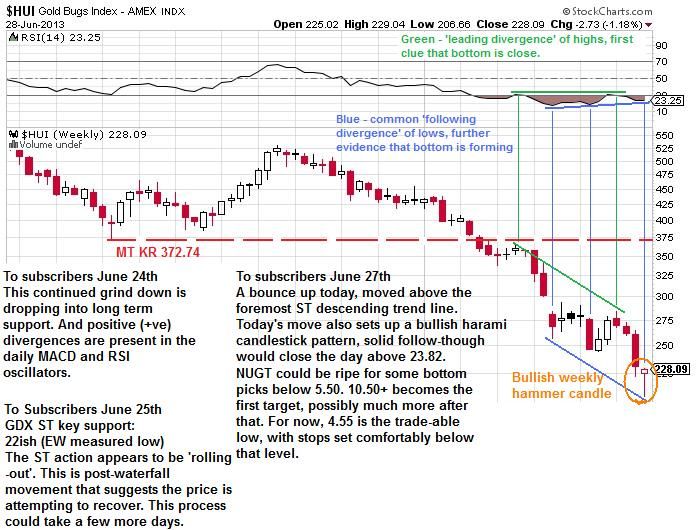
HUI mining index - I've been eying a reversal in this market also. With GDX hitting my target of 22ish as part of a 'roll-out' recovery pattern, everything came together nicely for a bottom and trend change.

Here is the previous chart defining the support area:


Updated:


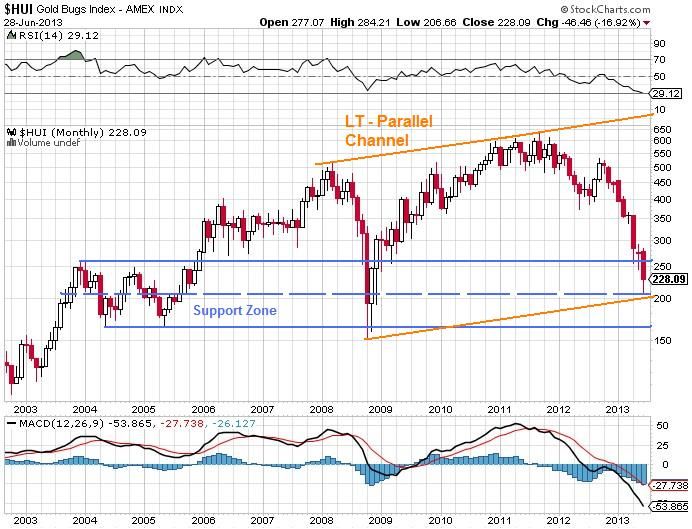
The weekly chart was showing some positive divergences in the RSI, which was confirmed with last week's bullish hammer candle.


--------------------------------------------------------------------------------------------------------------------------------------

If you are interested in receiving my daily email updates on the PM, Forex and other markets, you may subscribe here:


All the best to you,
Quad G


Sunday, June 23, 2013

MMM Weekend Update 6-23-13

Gold - Last week's drop in gold, Euro and GBP was well anticipated, even before Ben Bernanke opened hit mouth on June 19th. Here's how:

I posted this chart last weekend, showing the EW potential for another thrust down:


Here is an update to the count, and how it may play out in the weeks ahead while the price remains below key resistance #1 (1365.63):


Here is what my subscribers were being informed of last week before and after the drop:


My count is but one of two that I am currently paying attention to. Another elliottician (HoldemPlayer from the Kitco Forums) who I respect as an excellent Elliot Wave counter, has another count that is also a viable possibility.


Speaking for myself and not HP, I think his count could be complete or very close to completion. If true, the Triangle/Thrust bottoming pattern would be confirmed with an impulsive move higher very soon up above key resistance at 1365.63. Then a possible bullish iHnS may form through July.


We are in the 21-22 month cycle bottom area between now and July. I fully expect to see a counter rally out of this cycle, possibly to back test 1500-1666 in gold and silver could back-test 26ish.

---------------------------------------------------------------------------------------------------------------------------------------

Eur/USD - The top in this market had many clues that a top was forming with subsequent drop:


Here was the Long Term resistance line that the Euro was wrestling against last week:


The top was confirmed with an OKR on the weekly, the same reversal candle stick pattern has played out multiple times in the past with impulsive results.

---------------------------------------------------------------------------------------------------------------------------------------

GBP/USD - The top in this market played out a little different than the Euro, instead building an expanding ending Diagonal pattern:


This ST pattern butted right up into MT resistance at the 61.8% fibo retrace level of 1.5789


The Pound also printed a bearish OKR on the weekly chart.

Keep in mind that these OKRs in the Euro and GBP are responsible for many MT tops, However, if these tops fail they will likely fail with a vengeance, causing an impulsive short squeeze to the upside.

---------------------------------------------------------------------------------------------------------------------------------------

If you are interested in receiving my daily observations via email subscription you may sign up here with a free 15 day trial:
http://majormarketmovements.blogspot.com/p/mmm-market-signal.html

All the best to you,
Quad G

Sunday, June 16, 2013

MMM Weekend Update 6-16-13 Long Term Gold EW Count

Gold - Long Term Update. Reverting back to some old counts that were working, I have extrapolated and filled in data for the months in between then and now. In the following interpretation, I am taking into consideration how a 'worst case scenario' may play out. 'Worst Case' meaning a correction the eats up much more time AND price. Understand that there are multiple EW counts that are feasible, obeying all the rules. Take my Long Term (LT) and Mid-Term counts depicted below with a grain of salt. For now, Short Term Key Resistance is 1423.88 which means the current ST count would need an adjustment if that level is breached anytime soon. The colon(:) and Blue lines designate alternate counts.

Here is the old EW LT count from 2009:


Update for 2013:


Zoomed in:


MT view of (C)orange leg down, counted as a sharp double-zig-zag which is alternate to wave (A) which was counted as a flat correction:


The Mid-Term in a nut shell: We should be seeing some bottoming action take place between now and no later than September, seasonal bullishness should be evident by that time. An ending diagonal pattern, choppy and down into the the summer months would be an obvious sign of a market that was set to rally in the later half of the year. That rally should easily back-test April's break-down from 1520 to 1540, and could even go the distance to hit the center of the previous wave (B)orange congestion (resistance zone) between 1660 and 1700. How the price tangles with the the major multi-year 'Thick Black Line', will be the key determinant whether further upside will be realized (green breach) or not (red rejection down).

For LT stackers, a long, drawn out, deeper bottom would be very welcome.

------------------------------------------------------------------------------------------------------------------------------------------

If you are interested in receiving my daily email updates covering multiple markets using various analytical tools such as Elliot Wave Theory, Candlesticks and the QG3, sign-up here:
http://majormarketmovements.blogspot.com/p/mmm-market-signal.html

All the best to you this trading week,
Quad G


Sunday, June 9, 2013

MMM Weekend Update 6-9-13

Gold - The current ST and MT probabilities up or down look mixed at this time. For now the key pivot point is 1423.88, bullish above, bearish below.

I have done some recent time cycle and work and found some interesting measures.

The 21-22 month cycle has accounted for a few peak to peak spans. That same cycle is about to be hit again in June/July, this time as a potential peak to trough cycle.


June/July is a wide area of time. After sweeping for weekly time Fibos, the week starting July 14th and possibly 21st was hit with a few sweeps:


There is also a Full Moon on July 22nd. As we approach that July 14th and 21st weekly turn date window, I may be able to hone down the turn to a specific 3 day window after we get a little closer.


-------------------------------------------------------------------------------------------

Yen, Nikkei and SPX - Was the May 22nd top in equities easy to spot? I think so, here is how:

First, I posted this Ending Diagonal pattern back on April 28th:


On May 22 the topping process was deemed complete:


The pattern played out as expected:


The very night right after my May 22nd report to subscribers this happened in the Nikkei:


The SPX (S&P500) also posted a warning of a top and correction on May 22nd:


Using only the Elliot Wave theory and candlesticks, a significant top in USD/JPY and equity markets were able to be spotted and acted upon.

-------------------------------------------------------------------------------------------

If you are interested is receiving my daily email updates, you may sign-up for a free 15 day trial here:
http://majormarketmovements.blogspot.com/p/mmm-market-signal.html

All the best to you,
Quad G

Sunday, June 2, 2013

MMM Weekend Update 6-2-13

AUD/USD - The Aussie Dollar has had near perfect correlation to the Dow, Crude and Gold for several years now. This correlation has been near a ratio of 1:1 up until recently, when divergent disconnects have started to show.

The Australian Dollar (red) and Gold (blue) have paired up nicely, sometimes switching lead roles with each other. Currently Gold has lead the way down, with the Aussie lagging behind but catching up quickly:


The Aussie/Crude (WTI) has also enjoyed close company, except the recent plunge in AUD (red) has not yet been reflected in the price of Crude (blue) which has drawn flat in recent weeks:


The largest AUD (red) divergence is with the Dow (blue). The stock market has continued skyward, while the Aussie has collapsed:


I suspect that one of these markets in particular is lying, showing a strong face but weak in the knees (The Dow). Perhaps the tremendous Yen intervention by the BoJ has caused the currency markets to temporarily disconnect from their old paradigms. Either way, something is amiss and will likely see a correction soon. I think the Aussie is like a canary in a coal mine, it's either going to choke on the fumes of toxic monetary intervention or has some how died of natural causes (which I highly doubt). The Australian economy is a chief exporter of raw materials and energy to the Eastern and Western economies. Generally a fall in the value of AUD, signals that export demand is shrinking, AUD denominated raw materials and energy ceases to be bid up, reducing demand for the Aussie, thus it's value. Most likely an indication of yet another global economic slow down.
We'll see. Crude Oil is the fence sitter, a leap into bull or bear territory in the weeks ahead, breaking out of it's current consolidation, should make the forth coming trend obvious as to it's next MT direction.

---------------------------------------------------------------------------------------------------------------------------------------

BDI - Baltic Dry Index. Has been a bellwether of global economic activity, From the top in 2007, the index has been looking for a major bottom along with the global economy. The current triangle/thrust pattern and choppy movement above a mid-channel line suggests that the BDI may have at least one more shot down to finalize a bottom in the months ahead, likely unwinding any of the last long side speculation. A Rule of 4 (Ro4) breach above the descending channel (green) should confirm a bottom.


--------------------------------------------------------------------------------------------------------------------------------------

30 Year Bond - The 'Long' bond has had a very consistent 30 year peak-to-trough cycle well into the 1800s. The last trough in price (peak in yield)was in 1981, here it is 32 years later and a peak is due (low in yield). I suspect that major FED involvement (quantitative easing) has caused this 30 year cycle to extend to some degree. However, I doubt that the FED will be able to hold off this cycle much longer. Those that have paid attention to my blog know that I have been hunting for a major top in the Bond market for a few years now. The most recent activity has been giving clues that another potential major top is in place. The action could be that of a stealthy roll-over, with a wash-down soon to be realized, but must keep under 150.00.


As global credit markets continue to be hit by the profligate financial maneuverings of central banks and nations, the US long bond will either be the last life boat in the credit market or go down with the ship. Time is not on it's side according to the 30 year cycle.


Good Hunting Folks,

Quad G

If you would care to receive my daily email updates on market conditions, you may sign up for a free 15 day trial here:
http://majormarketmovements.blogspot.com/p/mmm-market-signal.html