Showing posts with label Alternation. Show all posts

Sunday, August 25, 2013

MMM Weekend Update 8-25-13

Gold - Several weeks ago in June I posted this LT chart with a Mega-Bear scenario looking for an end to wave (C) orange in the 1150 to 1280 zone. With price challenging the 1400, it looks like wave (C) is finished and now the price is working up into wave (X) orange toward the very key 'Thick Black Line', which is currently above at about 1691ish and falling. If this is a wave (X) advance it should be a sharp 3 wave correction upward.


Now some of you have been wondering if there is a Mega-Bull best case scenario. Of course there is, but the 'Thick Black Line' will need to be defeated first as the green arrow depicts. Here is the Best Case scenario that I can fathom once the TBL is trounced: A 5 wave impulsive advance to 1800+ for wave {1} will need to be realized. Followed by a couple sharp, but relatively small wave 2 corrections. Then comes the point of recognition, probably in the 2500 to 3500 zone, the price would just go steadily upward day after day, 1-3% at a time, with no looking back.


Here is what the wave structure looks like in log scale, you'll notice that the current correction is either a bullish under-throw or just the start of a more drawn out correction. Until the TBL is defeated I favor further correction (red projection)at this time, eventually dropping down to the previous wave 3-4 zone and possibly the LT 61.8% fibo retrace (889ish):


I do not recommend that you base ANY long term investing decisions base on these long term scenarios. If you are a long term investor in precious metals the best plan is to continue averaging in purchases over time. Betting the farm on a EW projection is typically not the best course of action. MT and ST paper trading is different, you have greater flexibility and can maneuver an account with greater dexterity capitalizing on swings up and down with the advantage of using stops. You can't place a stop-loss on a 1oz American Gold Eagle in your hand, though you can employ hedging using a paper trading account.

Currently PoG is coming up to test several lines of potential resistance:
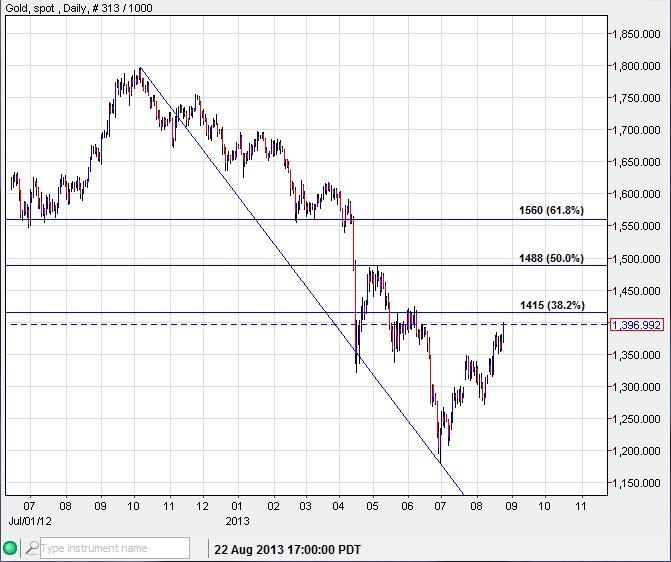


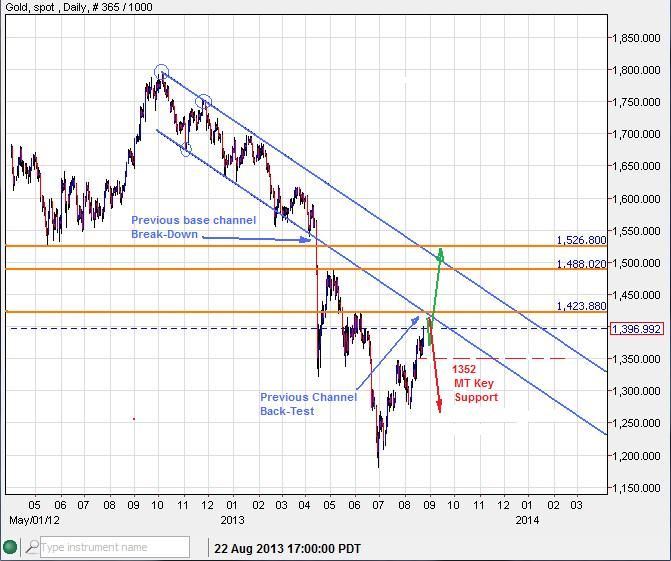
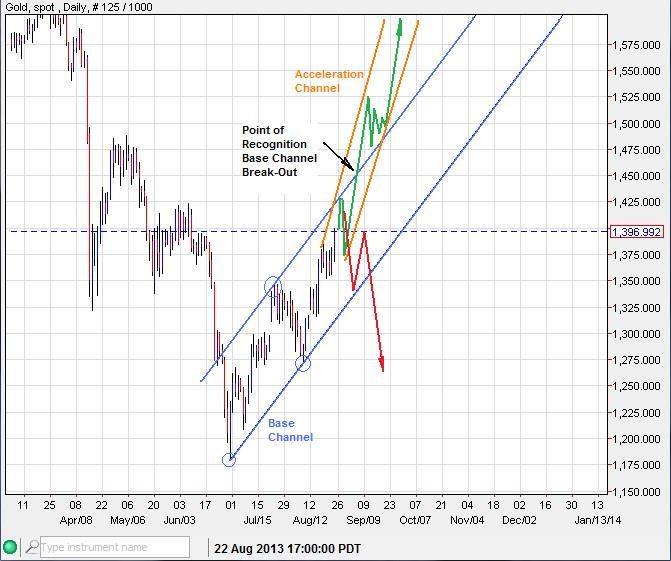
Gold is still inside its base channel. This means the the current 3 legged advance up from 1180.20 could be just a corrective wave. What would set this upward wave structure apart as an impulsive rise would be to have the price move above its base channel and form a new acceleration channel (orange), no doubt generating a point of recognition. The Key MT support level at this time is 1352ish.


-----------------------------------------------------------------------------------------------------------------------------

Silver - Is much further ahead than gold, having already broken its base channel (blue), headlong up into its acceleration channel (orange):
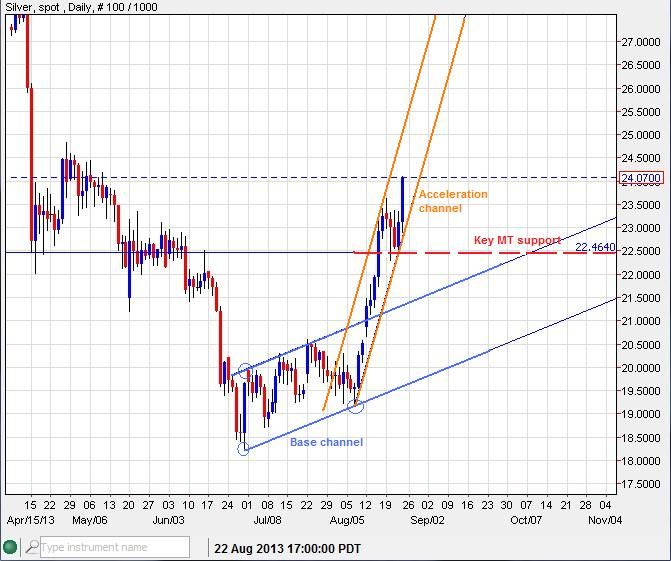


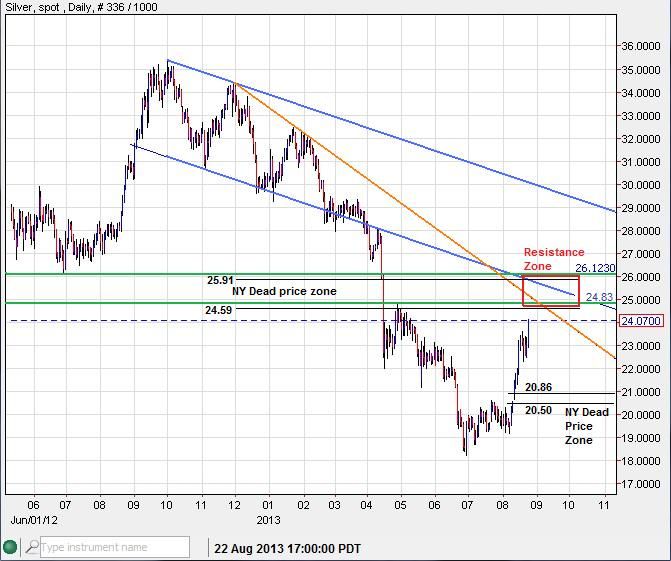
Silver is also about to knock on a MT fibo retrace level of 38.2% (24.77ish), as well as test some other resistive trend lines which form a resistance zone. This would be the place to watch for daily topping candles such as an inverted hammer, OKR or bearish Harami. Further ascent this week may also give the New York trading hours another crack at the 24.59 to 25.91 Dead zone, which has not traded in the NY time frame. Keep in mind that this rapid climb has left behind a NY Dead zone below at 20.50ish to 20.86. The market often despises a vacuum.



----------------------------------------------------------------------------------------------------------------------------

If your paper trading could use a technical boost, consider signing up for the Major Market Movement subscription service where you will receive my daily updates that cover multiple technical modes including the QG3 trend following indicator, Elliot Wave, candlesticks, trend-lines and patterns. Also, I will soon be launching (early September) a new fully featured website with chart libraries, forum and frequent blog updates.

Sign up here:
http://majormarketmovements.blogspot.com/p/mmm-market-signal.html

Good Hunting,
Quad G


Sunday, August 11, 2013

MMM Weekend update 8-11-13

Gold - The New Moon turn date window appears to be a success with a strong bounce up. The dip was stingy however, only giving a low of 1272ish before reversing. Last week's bounce produces a swing low and key support for any more upside at 1272ish.

Gold has completed a break-out and back-test and is now ready to roam higher while above 1272ish:


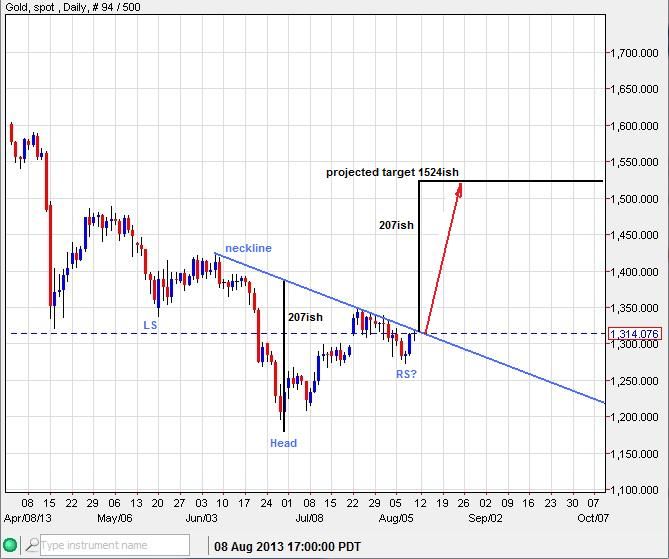
There is a skewed neckline of a bullish iHnS pattern, which could project a target up to 1524ish if a neckline breach occurs this week.


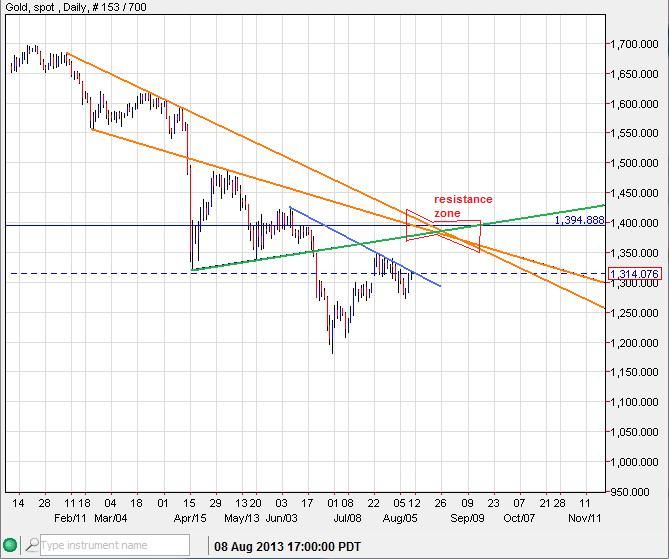
However, any upside advance may have to tangle with a series of resistances above:


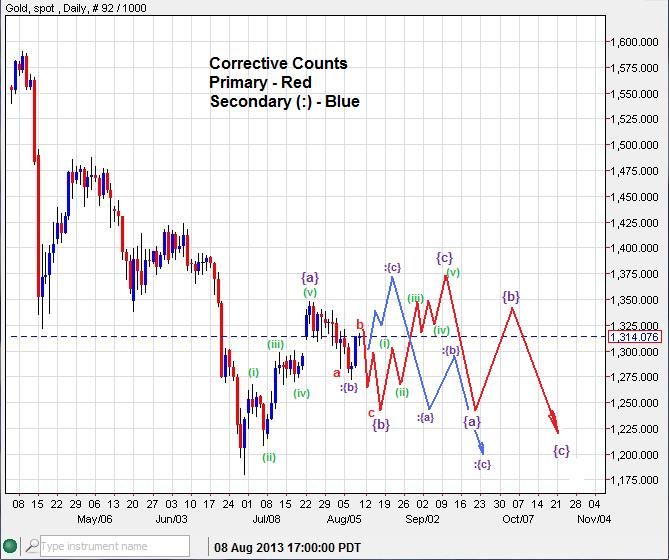
The EW impulse counts may look something like this in the days ahead:


If the resistance zone above is going to be respected, then a corrective EW count is more likely, as more sideways base forming plays out:


In a nutshell, there is more upside to be had in this market in the days ahead while the price remains above 1272. A violation of that level would suggest this market is still in a sideways/down corrective phase.


---------------------------------------------------------------------------------------------------------------------

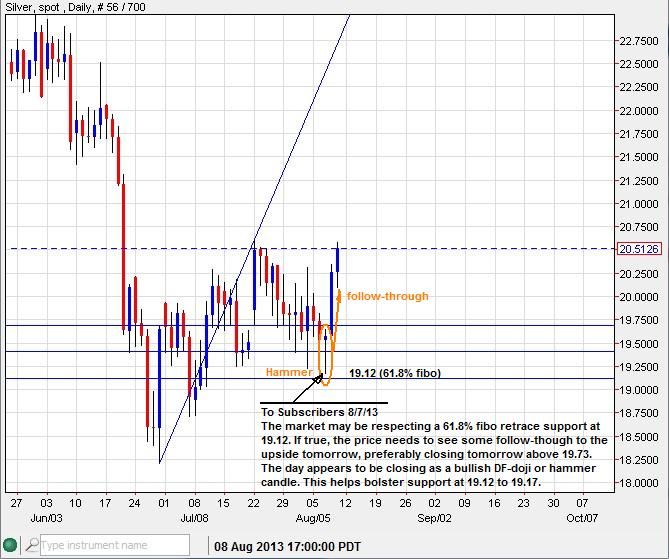
Silver - So far performing much more bullish than gold. The New Moon turn date window and a 61.8% fibo level at 19.12 provides the impetus for last week's tear to the upside after roundly defeating a MT trend-line resistance above:


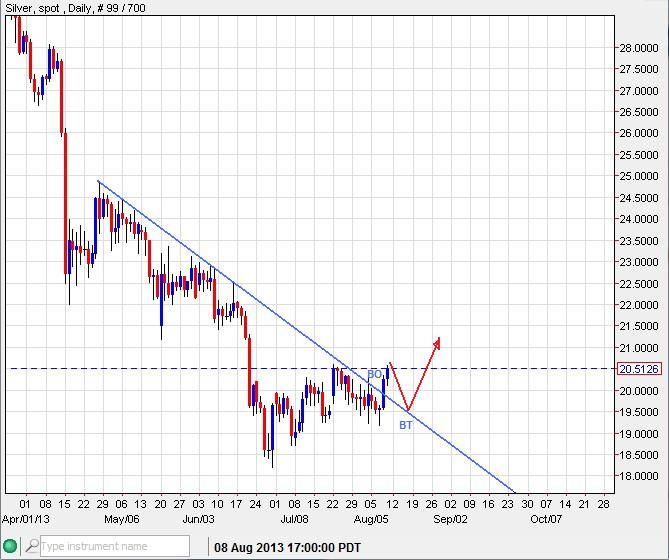
I would not be surprised to see last week's The Break-Out (BO) receiving a Back-Test (BT) this week or next, the sooner the better.


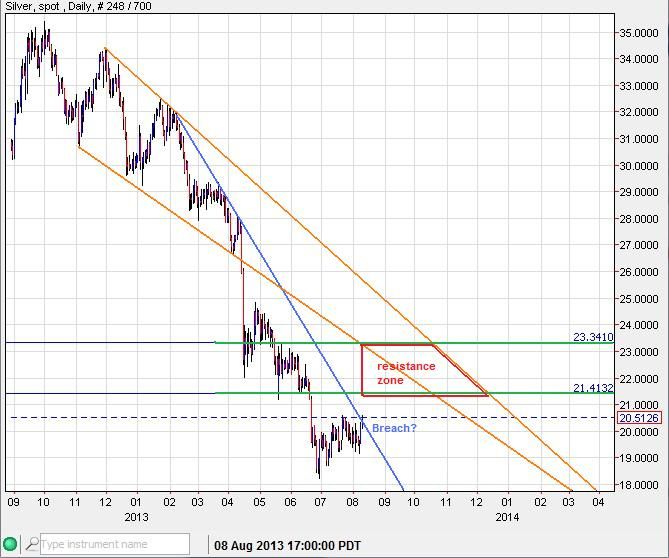
Any upside run will likely find some hurdles above between 21.40isn and 23ish:


An update of my silver MT count suggests that there is still more sideways irregular flat wave (4) correction to take place before a final 5th wave decent. This bearish count would be in jeopardy with an incursion above 23.30ish.


----------------------------------------------------------------------------------------------------------------------

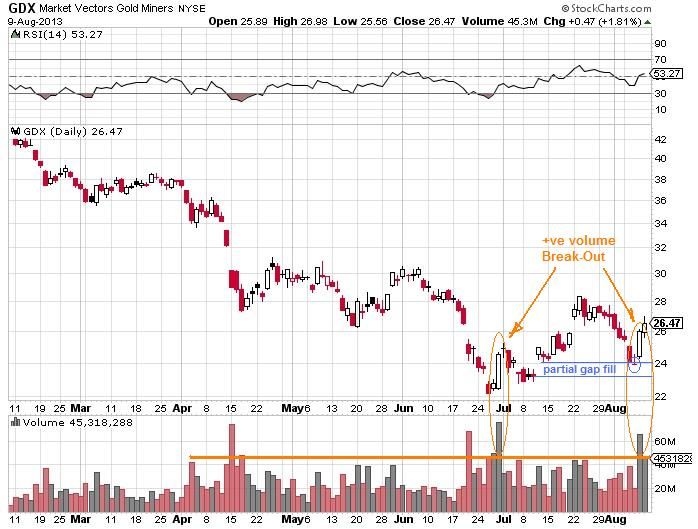
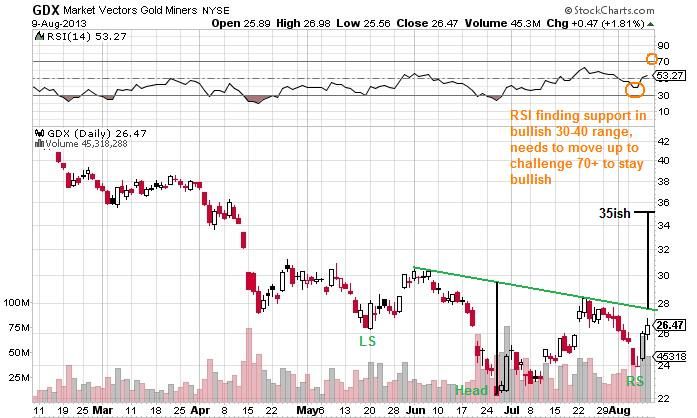
GDX (PM mining ETF) - Is also looking bullish going into next week. Last week's low partially filled a previous gap before heading higher with another volume break-out:


GDX also sports a bullish iHnS pattern, if the neckline is breached next week, the price projection points to 35ish in the ST:


The week ended with a bullish hammer candle printed. This sets key support at 23.89:


--------------------------------------------------------------------------------------------------------------------

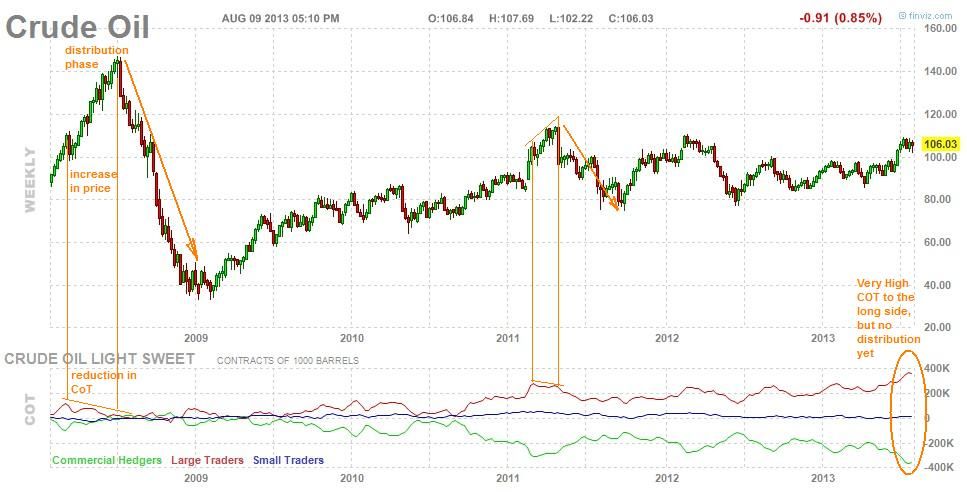
Crude (WTI) - The CoT (commitment of traders)shows great sums of long side volume. This will certainly weigh on any further price increases. However, the near term rise has yet to see any signs of distribution like other past rallies have. This would suggest more upside is possible in the ST.


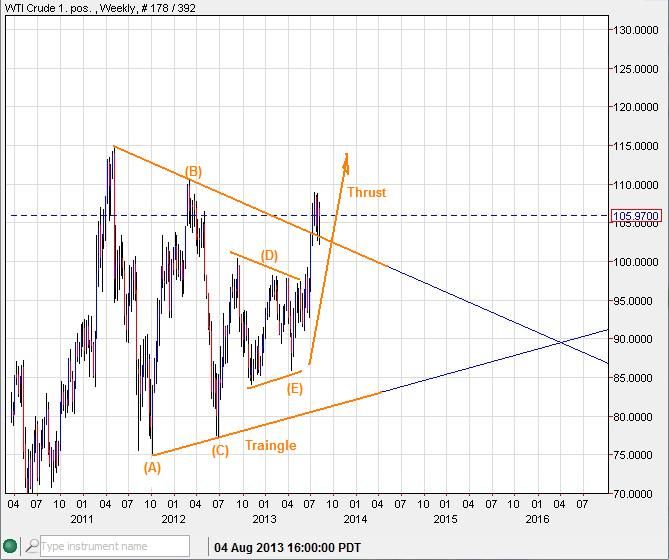
MT EW count, suggests a triangle/thrust is in the works:


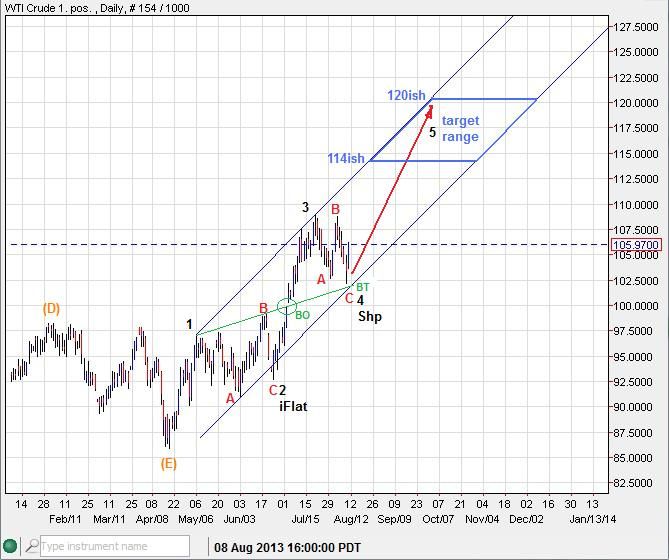
ST EW count points to a 5th wave rise off a sharp 4th wave back-test, 102.21 is now key support:


--------------------------------------------------------------------------------------------------------------------

USD - The USDollar ended last week at a critical MT trend-line support as a 4th test. The Rule of 4 (Ro4) suggests that anytime a support or resistance is tested a 4th time it has a greater probability of being broken. If true, for USD, a significant top could be in place with a MT downside move to be realized.


-------------------------------------------------------------------------------------------------------------------

If you are interested in subscribing to my daily email market updates you can do so here:
http://majormarketmovements.blogspot.com/p/mmm-market-signal.html

Quad G

Sunday, August 4, 2013

MMM Weekend update 8-4-13

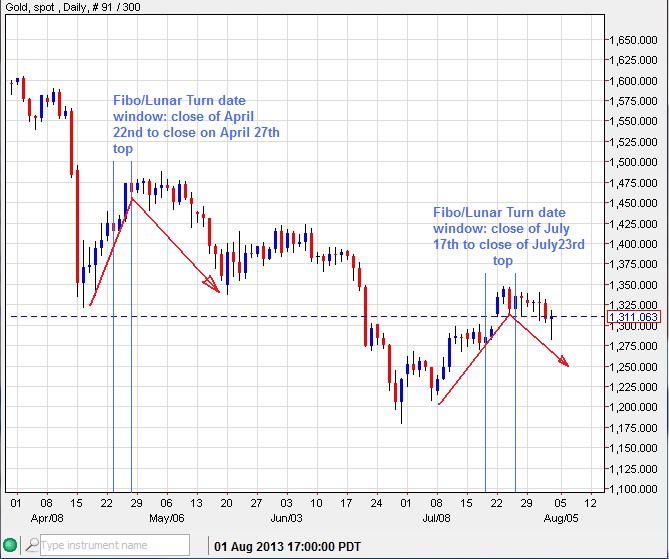
Gold - The Fibo/Lunar turn date window that I have outlined in previous weeks, which spanned July 17th to July 23rd saw a rise up into that window. Recent downward action has revealed a top being placed in that turn date window. The resulting move down is now heading into a New Moon turn window this week that spans the close on Aug 5th to the close on Aug 8th.

Fibo/lunar turn date windows and their results:


Here is the Previous ST chart showing the lunar turn date progression so far:


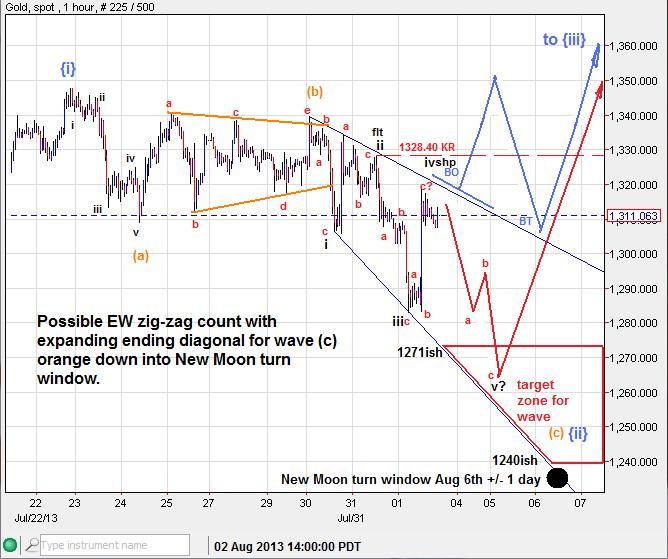
This is a ST EW update:


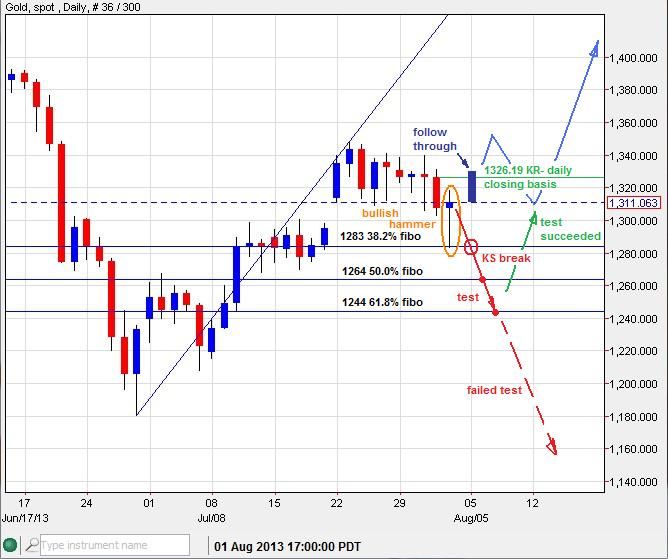
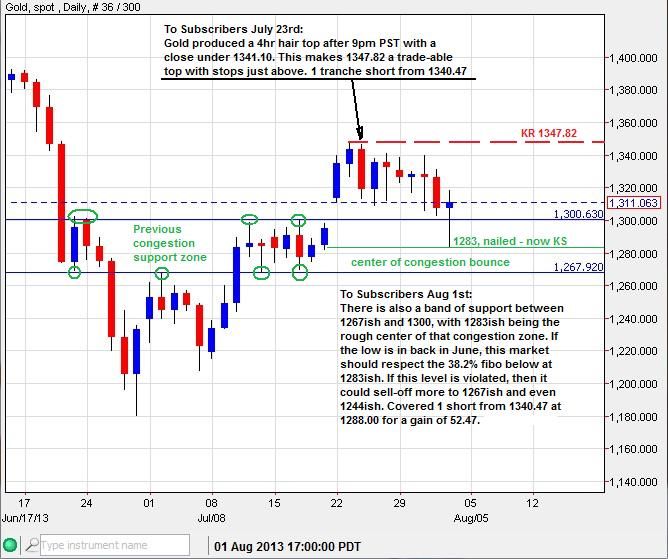
The 38.2% fibo retrace level at 1283 was key support for last week:


My subscribers were keyed in on this important 38.2% fibo level as well outlining the previous congestion support zone which was nailed just before the bounce last Friday, which provided a nice $50+ ST pay day on a short play:


In a nutshell - While Gold is below 1328.40 on an intra-day basis, the ST bias is still down for the next few days. The downside target range is 1271ish to 1240ish. 1240ish is also a key spot for percentage pickers, as a customary bullish pullback of 8% would be realized at 1239ish and a 5% risk off the bottom (1180.20) points to 1239ish. If 1240ish is broken as support, then further downside momentum could be fostered, eventually leading gold down to test 1180 and lower. However, an intra-day breach and daily close above 1326.19 should provide the follow-through necessary to allow a jump up test key resistance at 1347 and eventually break-out into a wave {iii} advance to the upside. Many downward trends into August have seen significant bottoms born in this key seasonal time frame.


-------------------------------------------------------------------------------------------------------------------------------------

Silver - Based on recent action, it looks to me that Silver is also prepping to confirm a bottom or make one more final low. Either way, the action looks MT bullish with any dips or lower-low buys likely being rewarded into the rest of the year.

A MT trend-line that has posed resistance for many weeks now has had it's first intra-day breach on Friday. This action weakens that trend-line as resistance. A daily close above that trend-line this week would trump it all together. No doubt many shorts that have depended on that line for guidance may cover their positions with a solid breach.


Friday's intra-day low could have tested a neckline of a bearish HnS pattern. If this neckline is broken next week, the projected initial target is 17.86ish. A breach of the top of the Head would have the opposite effect, Possibly spurring on a rise toward 21.96ish for starters.


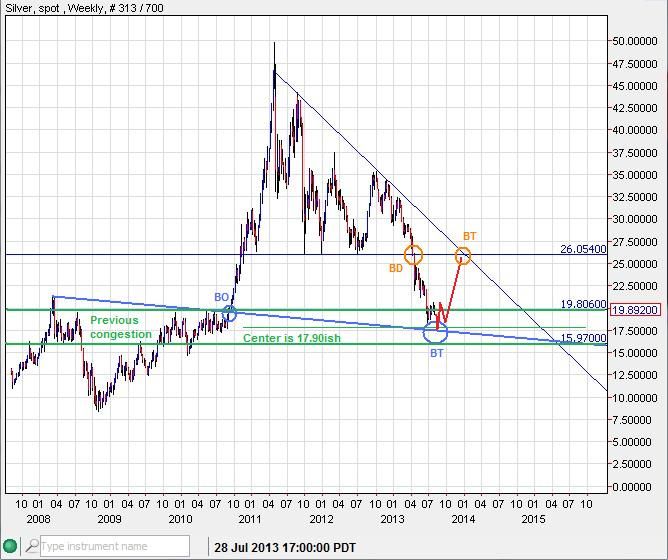
In my opinion another sell-off to sub 18 would be welcome. As I look at the LT picture I see the MT downward trend coming to rest inside a LT congestion zone between 16 and 19.80, the center of which is about 17.90. This is prime territory for a recovery bounce up to back-test (BT) the previous break-down (BD) at 26 in the weeks and months ahead.


------------------------------------------------------------------------------------------------------------------------------------

USD - The USDollar long term count is finally getting an update.

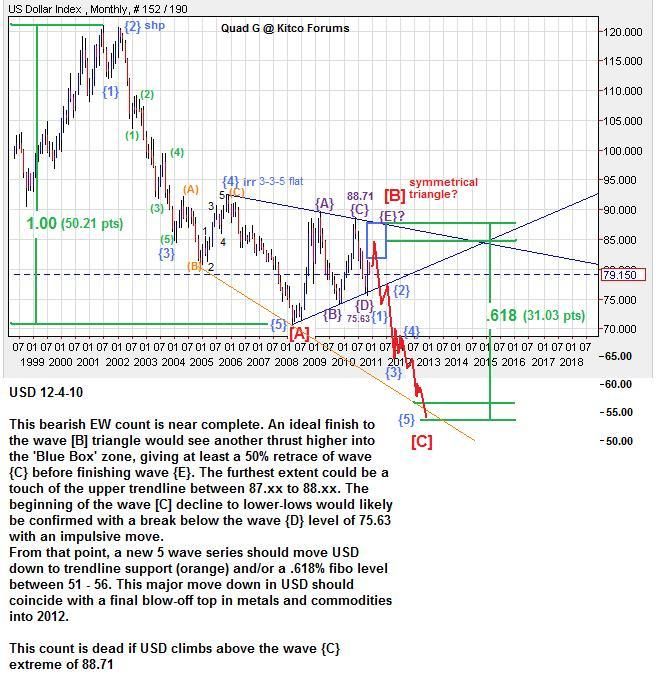
Here is the old count from December 2010:


Wave {C} could be cooked as the 27-28 monthly cycle comes to a close. This could lead (at a minimum) to wave {D} down to test at LT trend-line below (currently at 74ish and rising). However, a breach of the foremost upper trend-line (currently above at 86ish and falling) could create a Rule of 4 break-out run to the upside, targeting 93 to 100 initially.


------------------------------------------------------------------------------------------------------------------------------------

If you are interested in receiving my daily email updates, you can try my subscription service for free for 15days.
Sign-up here: http://majormarketmovements.blogspot.com/p/mmm-market-signal.html


Good Hunting this week, could be very exciting,
Quad G


Sunday, July 28, 2013

MMM Weekend Update 7-28-13

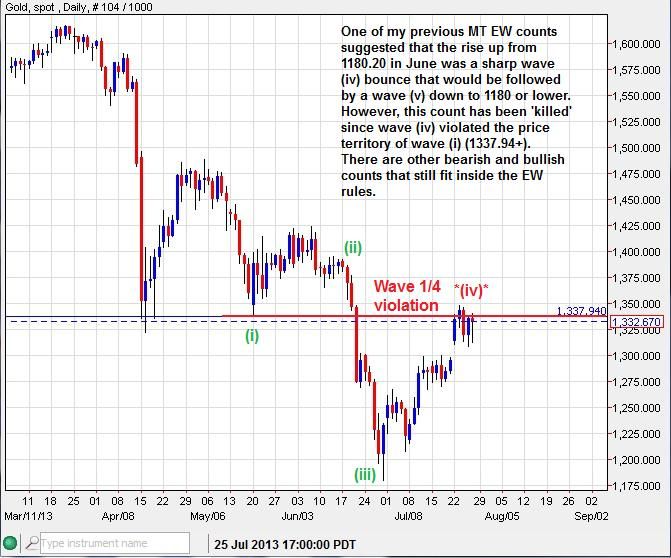
Gold - The previous MT EW count that suggested the current rise off of 1180.20 may have been a sharp wave (iv) green advance has been killed with a wave 1/4 violation above key resistance of 1337.94+ which is the price territory of wave (i). This changes the EW count in favor of some other more bullish counts. There is still another bearish EW count that could account for a dive to below 1180.20, but the price would need to sink below 1240ish before that probability increased.


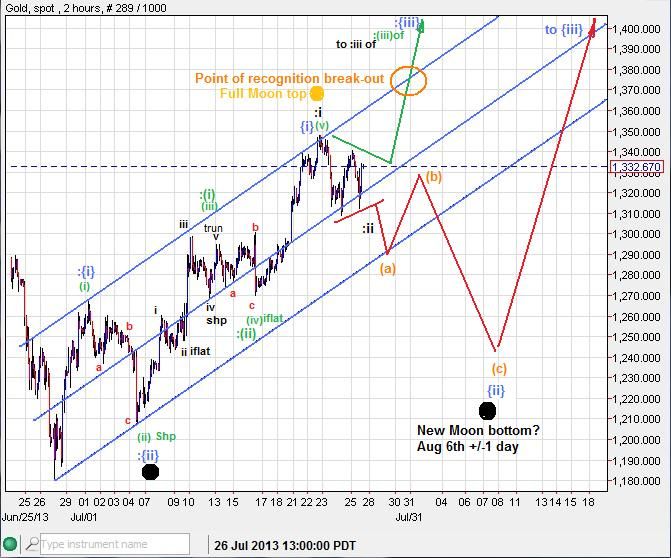
Here is an EW ST update:
The primary count suggests that the Full-moon top will hold and a 3 wave pull-back toward the next new moon could be seen over the next several trading days. The alternative (:colon) is far more bullish, but has some hurdles to jump over before coming into favor.


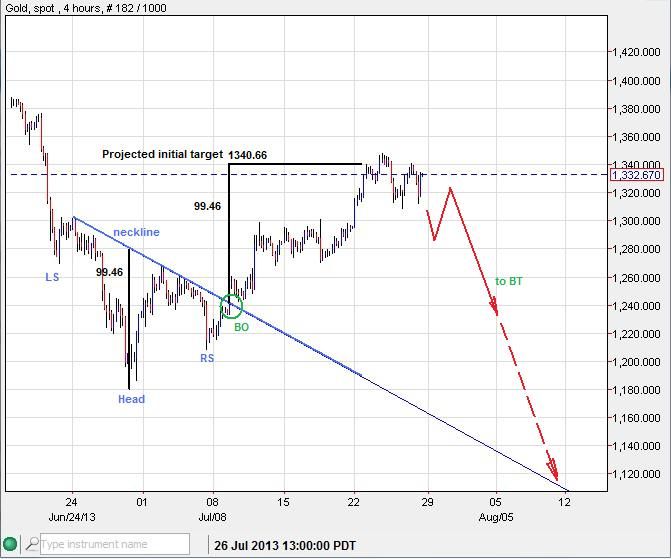
An iHnS pattern, highly 'skewed,' measured for a rough top fairly well. If the top holds, the Break-out of the neckline and even the neckline itself could get a back-test soon.


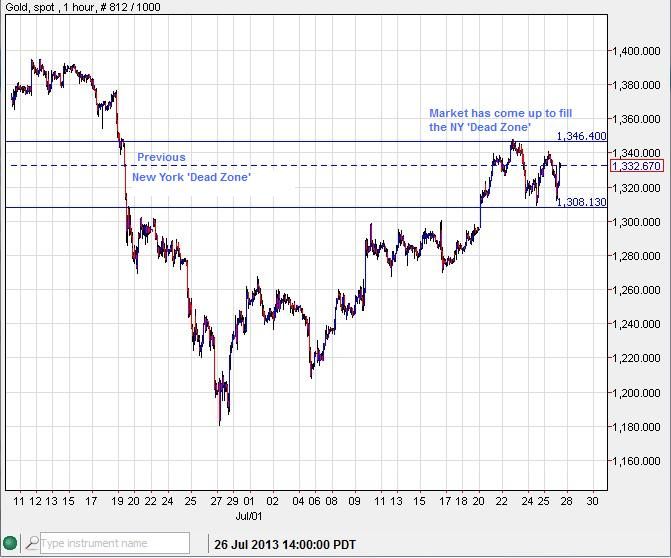
The New York market is the top dog of all the markets around the world. Seldom does a price move extend beyond NYs attention for very long. I typically gauge the NY market to be between the hours of 8am to 5pm EST. This is the span of time that the NY marketeers holds their chance to influence the gold market for the daily session. When the price moves through territory that NY has not had a chance to weigh in on, the tendency is for the market to eventually correct back into that price territory that I dub the NY 'dead space' during the NY time frame. NY doesn't like to be kept 'out of the loop'. So when you see an over night move run into new price territory, either up or down, know that the probabilities favor a return to that price territory later on during the NY hours.

Here is an example:


As you can see the over-night market made a big splash one day, leaving a void or Dead Zone that eventually was filled during NY hours. It looks as though NY has been comfortable with its new range now for a few days.

I recently spotted for my subscribers a ST top in Gold's price at 1347ish after observing a 4hr time scale 'hairy top':


---------------------------------------------------------------------------------------------------------------------------------
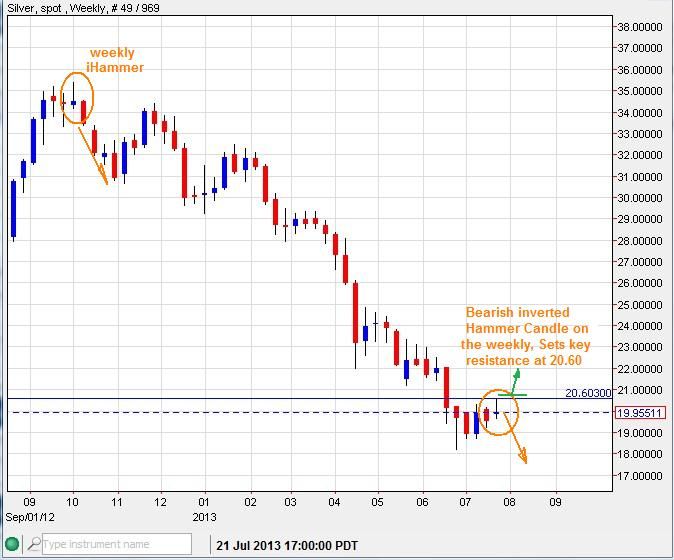
Silver - Not looking as hot as gold or GDX, leaving the whole PM complex in a quandary going into next week. The weekly closed as a bearish inverted hammer candle, setting key resistance at 20.60:


Weekly candles can often be responsible for moves that last at least a couple weeks, this would suggest that further selling is likely while below 20.60. If 20.60 is breached then another short squeeze could be realized.

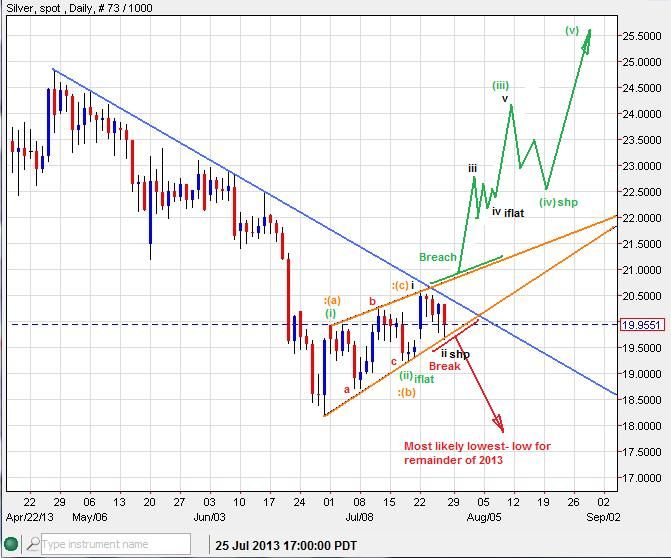
The Silver EW count has a bullish and bearish option, both with their own unique set of qualifiers.


---------------------------------------------------------------------------------------------------------------------------------

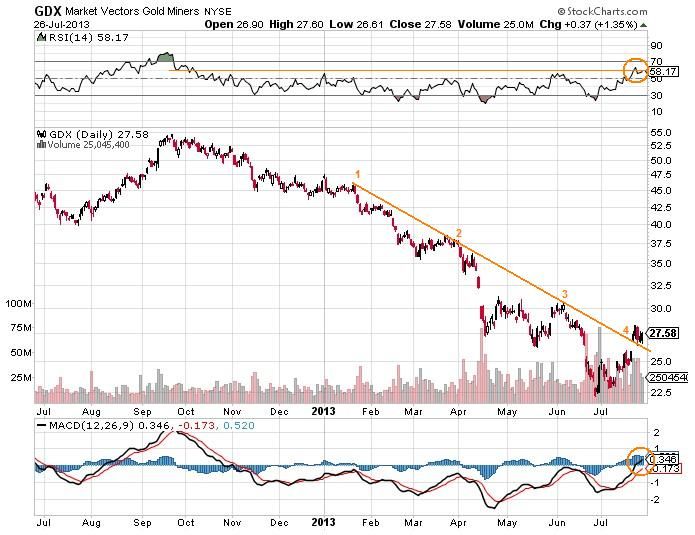
GDX - The miners have produced a Rule of 4 (Ro4) breach to the upside, with price currently riding above the break-out line. The oscillators RSI and MACD have also moved above some key levels. The MACD has moved above its zero line for the first time in months. And the RSI has moved above its 60 line. This all suggests that this market is in recovery. Even if this market was to fall again to a lower-low, I see it as another gift of a buying opportunity for the next MT bull run.


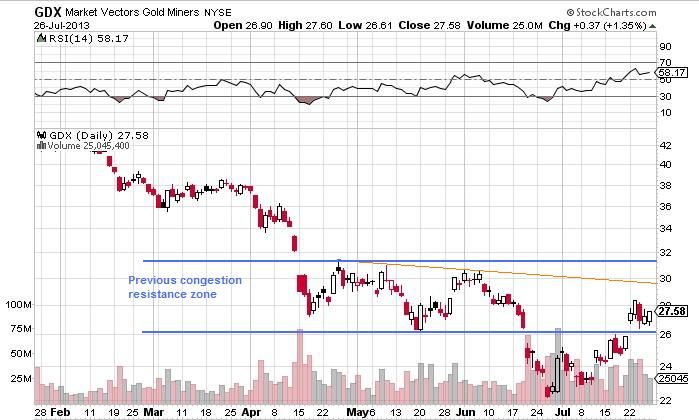
For now, in the ST, GDX is tangling with the resistance posed by the previous congestion zone.


----------------------------------------------------------------------------------------------------------------------------------

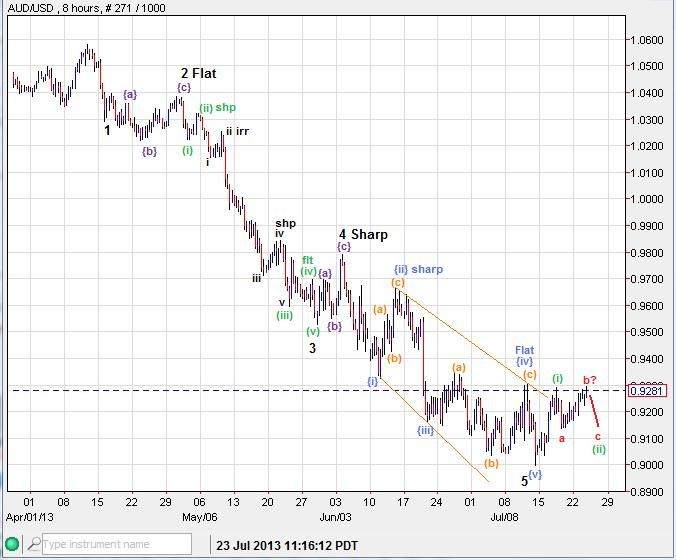
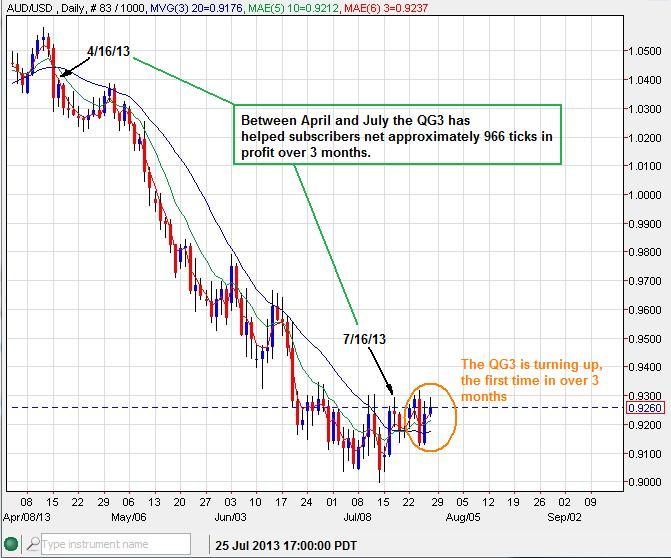
AUD/USD - Has a full count to the downside and is working on rolling out into a recovery:


The price has also performed a Break-out and Back-test, this market is poised to move upward while above .9128


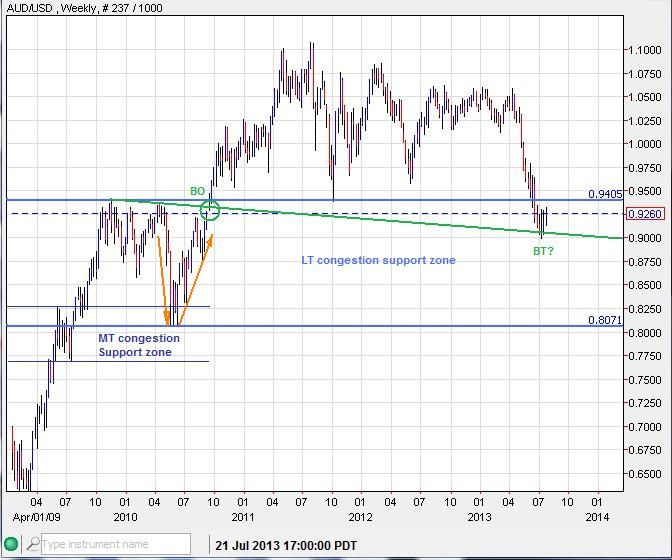
The Long term chart shows that price has come down to back-test an old break-out line inside a previous congestion support zone:


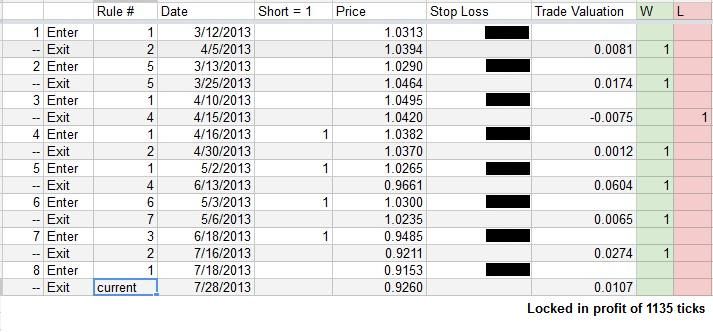
My QG3 trading method has produced some excellent results in this market since I took on the Aussie back in March. So far there has been about 1135 ticks of profit that have been locked in. One contract with an initial margin of $2,013 would have profited about $11,350 in just a few months (minus roll-over and broker fees).


Much of which was due to the QG3 signaling subscribers to get in on the short side of this 'major market movement', keeping them in for most of the way down:


The QG3 trading method has now signaled to get prepared for the possibly of a long side advance.

If you are a trader and would like to receive my daily market updates, you may sign up here:
http://majormarketmovements.blogspot.com/p/mmm-market-signal.html


All the best to you this week,
Quad G


Sunday, July 7, 2013

MMM Weekend Update 7-7-13

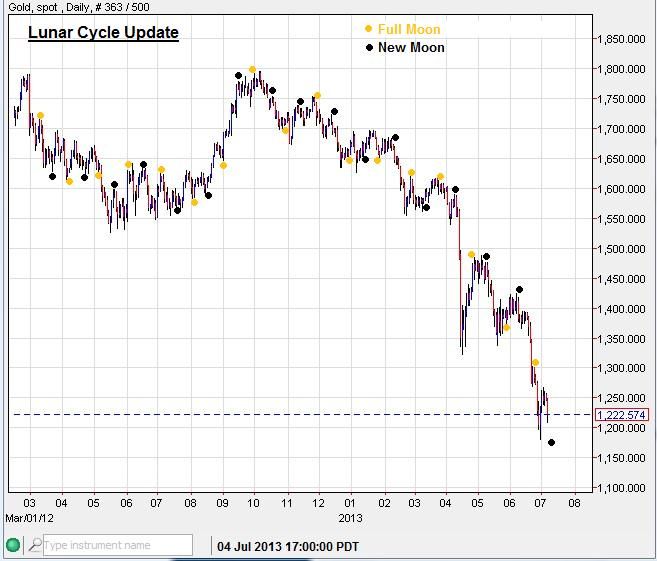
Gold - The moon cycle can often have a ST effect upon the markets. Gold in particular, as you will see, has been under a 'dark moon' for many months now. Since September 2012, The greater majority of new moons have marked ST tops in gold. The current iteration that is centered on July 8th (+/- 1 day) has a trend that is moving down into it. If a turn is realized early this week with a rise that moves up above 1267ish, the new moon has successfully marked a low.


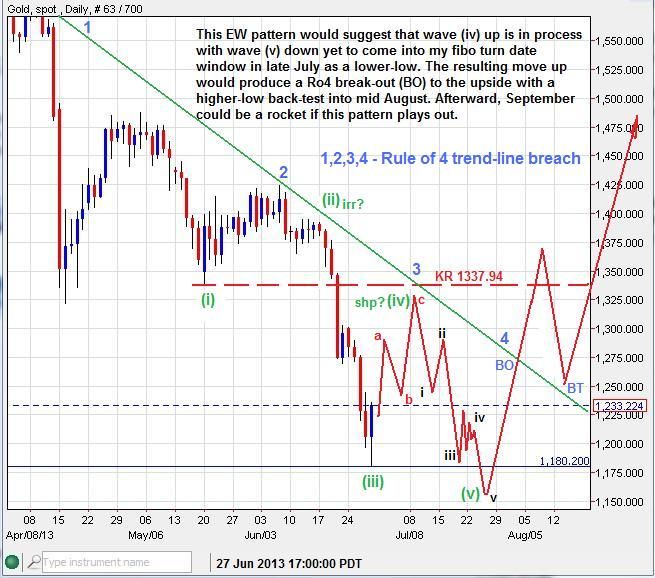
Last week I was looking for an ABC move to the upside, with more time being spent on wave b down than expected, the wave c of (iv)green top may come later this month if 1180.20 holds as key support.

Previous chart:


Update:


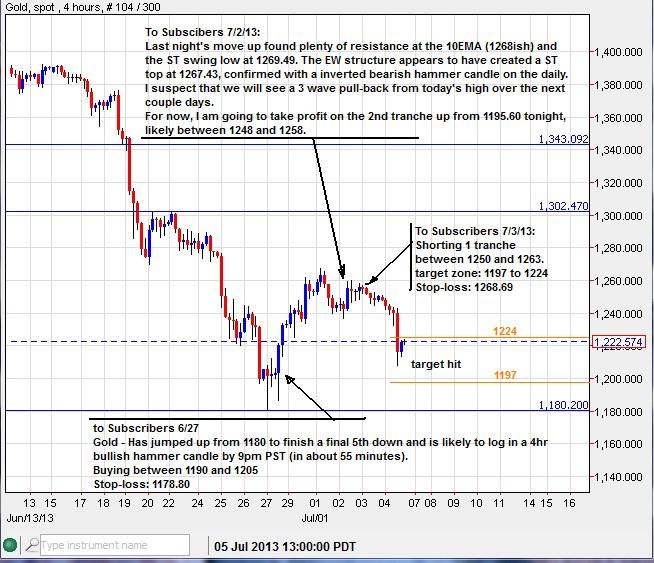
These anticipated ST moves have been good for trading, approx $80+ in profits over 6 days.


------------------------------------------------------------------------------------------------------------------------------------------

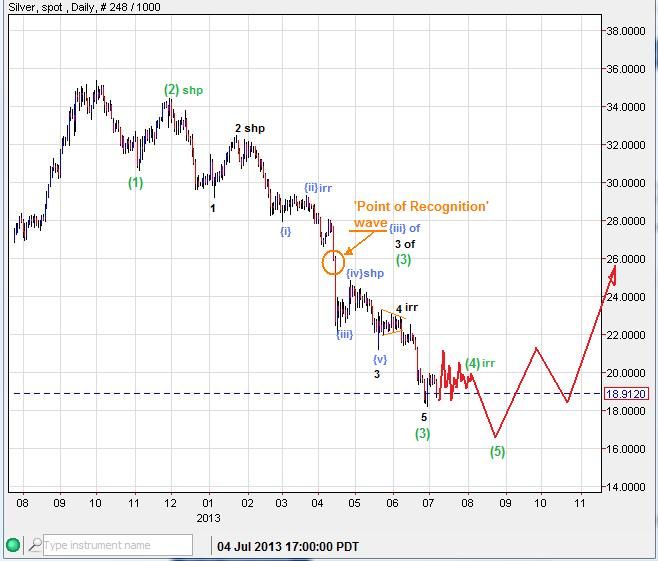
Silver - My MT EW count suggests that Silver is working on an irregular, possibly a triangle, 4th wave correction. Afterward a final 5th down could finish the impulse down from October 2012. After a bottom is placed, I would expect at a minimum, a 3 legged move up to back-test the 3rd of a 3rd 'point of recognition' break-down.


-----------------------------------------------------------------------------------------------------------------------------------------

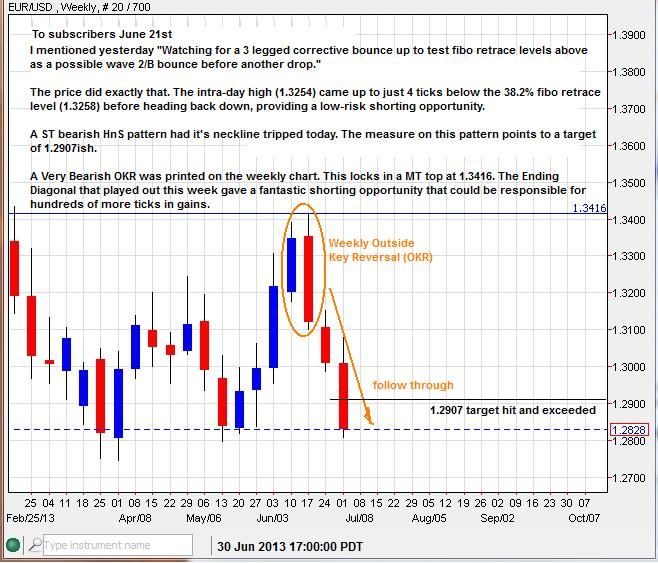
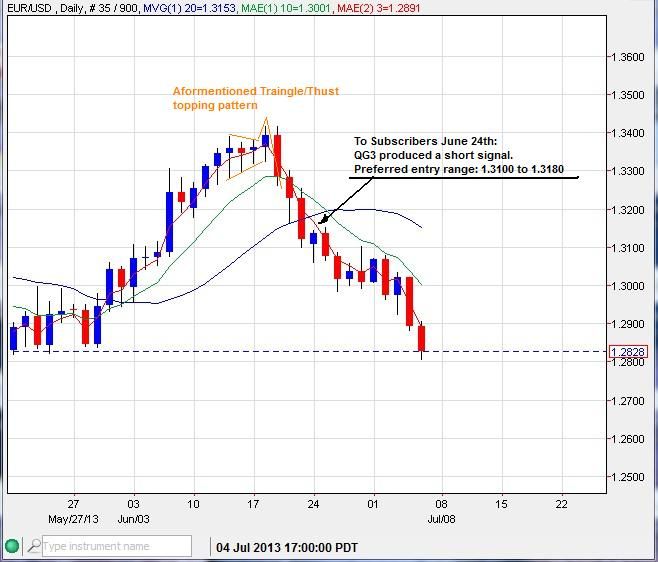
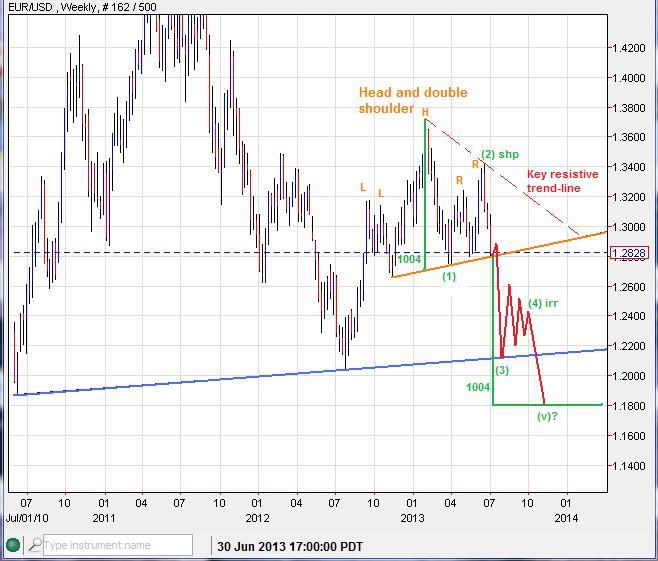
EUR-USD - This market has been in a well anticipated bearish mode since the previously identified triangle/thrust topping action with weekly OKR follow-though to the downside.


The QG3 MT swing trade signal also turned bearish, providing a Short signal.


The neckline of a bearish Head and double shoulder pattern was tested last week, a break of which should calculated as a projected target of 1.1800ish. Subscribers are well positioned to take advantage of such a bearish outcome.


---------------------------------------------------------------------------------------------------------------------------------------

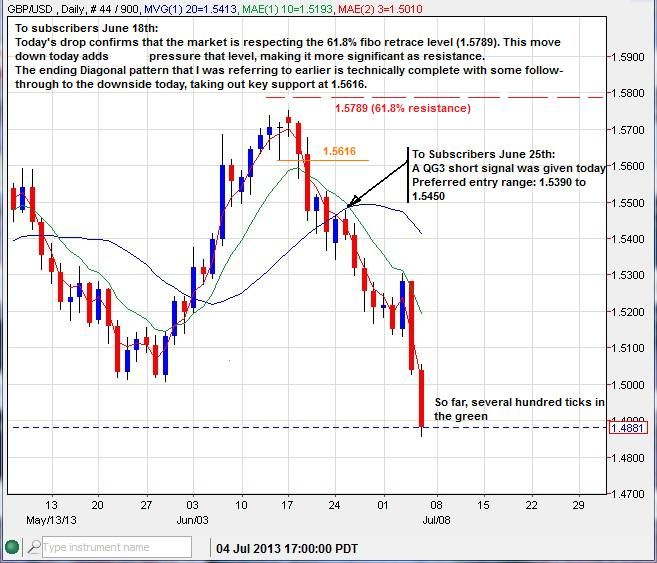
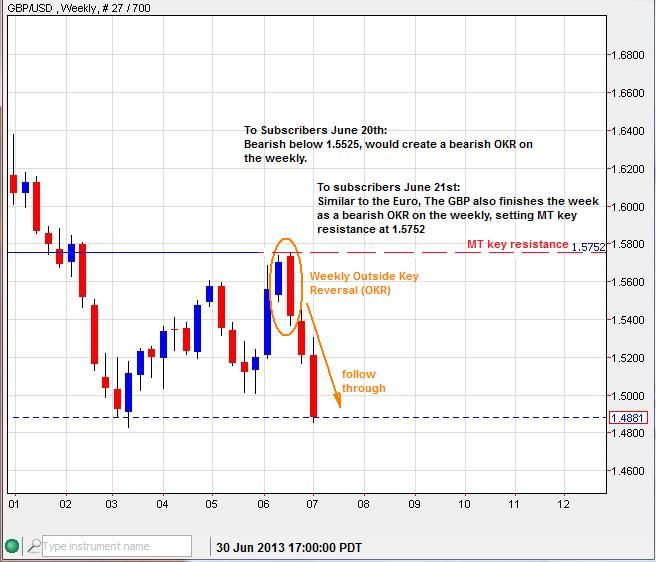
GBP-USD - The Pound is being pounded, as expected. Elliot wave, Candlesticks and QG3 all lent a helping hand in positioning subscribers on the short side of this market. Several hundred ticks in the green now.


--------------------------------------------------------------------------------------------------------------------------------------

If you are a trader and would like to learn how to take advantage of the signals that provide the greatest probabilities for successful trading, consider signing up for a 15 day free trail to my email newsletter and upcoming new website forum and chart library.
Subscribe here: http://majormarketmovements.blogspot.com/p/mmm-market-signal.html

I will also be posting my quarterly QG3 results later today. Since December 2012 the QG3 model portfolio is up 210%

Have a great week,
Quad G