Mornin' all,
Just a quick update:
Dow - Took out stops above 11,370, the bearish pattern is busted. 'Recapitalization' and 'nationalization' are the new buzz words to replace 'bailout' for the Euro banking industry. So I guess everything is fine now, move along, nothing to see here. The short squeeze has produced a gap up this AM above 11,100. That gap may be filled at some point, if they fill it quickly and close the day in the red, then it might be a reversal (hang man candle). The Dow is now in a position to possibly produce a bullish iHnS in the next few days, with the right shoulder down needed. The right shoulder cannot move below 10,404 or that bullish potential may die. Daneric's count appears to be the correct one at this time.
USD - Now testing critical support at 77.50ish. It too may produce a bearish HnS in response to the stock market's new found momentum.
Gold - In a range bound triangle between 1597 and 1678, not sure how this is going to play out, USD looking bearish, so a pop through 1678, calcs suggest a target of about 1760 to 1775. But a drop though 1597, points to an initial target of about 1510ish.
Silver - Not behaving as expected. I suspected that it would be going up handily with the stock market, but it still remains at a lower high. Key support for silver is about 28.50ish, a drop through that level invites a move down to the $25 range.
Bonds - Added some TBT. I think some of the new found 'liquidity' in the Euro zone could be coming from the sale of US treasuries. Add to that the risk-on appetite for stocks.
Unfortunately the charting will have to wait.
All the best,
QG
...
Monday, October 10, 2011
Sunday, October 9, 2011
Grains - Update 10/9/11
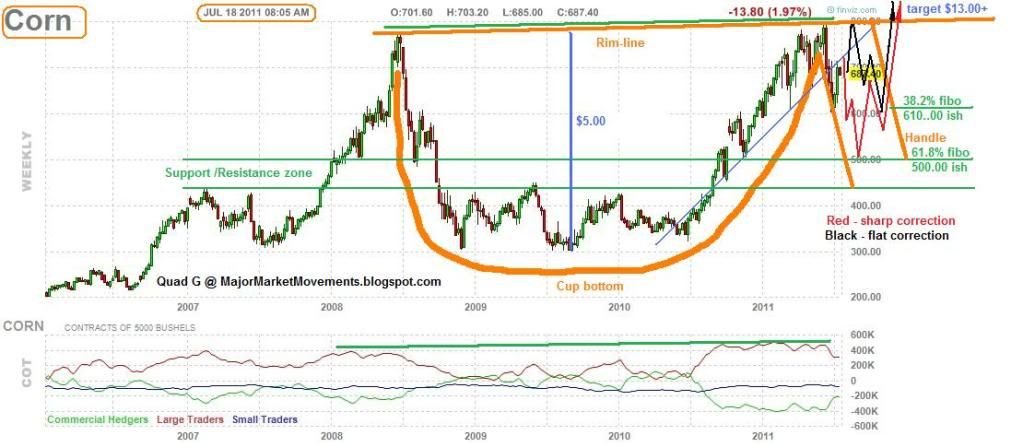
Corn - Here is the previous chart from July suggesting a handle was forming on a cup, but I didn't know what type of correction was forming or how deep, just that further weakness was likely:
(click on charts for full view)

Here is the Update:

The end of wave C red of 4 black may be finished soon near the 50% to 61.8% retrace level just above the multi-year S/R zone. If however, Corn continues to slide below the S/R zone, then this CnH pattern is likely dead.
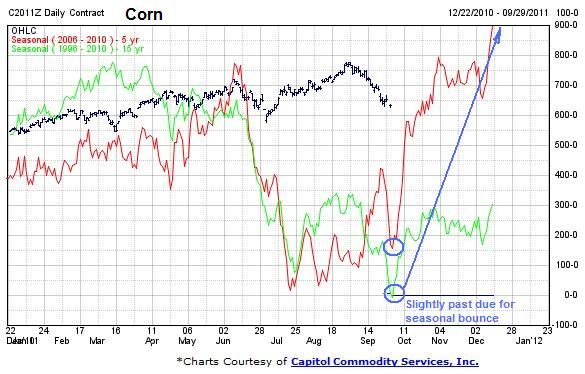
The seasonals suggest that a low is close and a bit over due:

Soybeans - The recent thrust higher failed at the mid-fork of the previous up channel (green), failures at the mid-fork often suggests that the channel is likely to be broken, and it did:

A S/R zone is present between 1050 and 1100, as well as a multi-year uptrend line (black). This should lend plenty of support for at least a bounce up to back test the previous channel at a minimum. If however the black trend-line breaks (blue projection) then capitulation has likely set in and a larger C wave down to the 600s is possible.
The seasonals, like corn, suggest that a bounce is possible soon, if a bit over due:

Wheat - I think the conclusion of a wave 2 black correction could be seen soon. The pattern looks like a possible 3-3-5 expanded flat. It should conclude soon above the lower-green channel line, 61.8% fibo retrace level and the support/resistance area (orange):

If this level provides support, then a bounce back up to the mid-700s to 800 seems probable, possibly the right neck of a bullish iHnS. The COT levels are entering an oversold area. If however, the price of wheat falls below the lower-green channel line (blue projection), then the 400 level is likely to be tested along with further downside if the previous green channel becomes resistance instead of support.
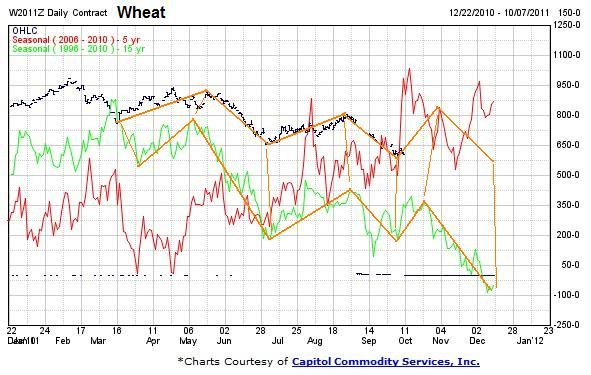
The seasonal chart suggests a minor up swing is possible soon into November, but further weakness expected into the end of the year:

Also note the pale blue areas of each chart. The bracket shows where the worst of the 2008 Stock Market (SM) dump occurred. Notice how the grains barely moved in comparison. The pale blue circle was near the end of the SM decline in March 2009, yet the grains put in higher-lows.
...
(click on charts for full view)
Here is the Update:
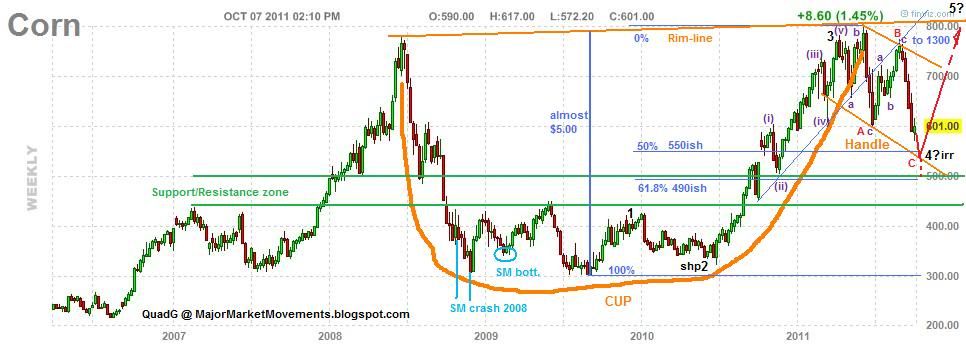
The end of wave C red of 4 black may be finished soon near the 50% to 61.8% retrace level just above the multi-year S/R zone. If however, Corn continues to slide below the S/R zone, then this CnH pattern is likely dead.
The seasonals suggest that a low is close and a bit over due:
Soybeans - The recent thrust higher failed at the mid-fork of the previous up channel (green), failures at the mid-fork often suggests that the channel is likely to be broken, and it did:
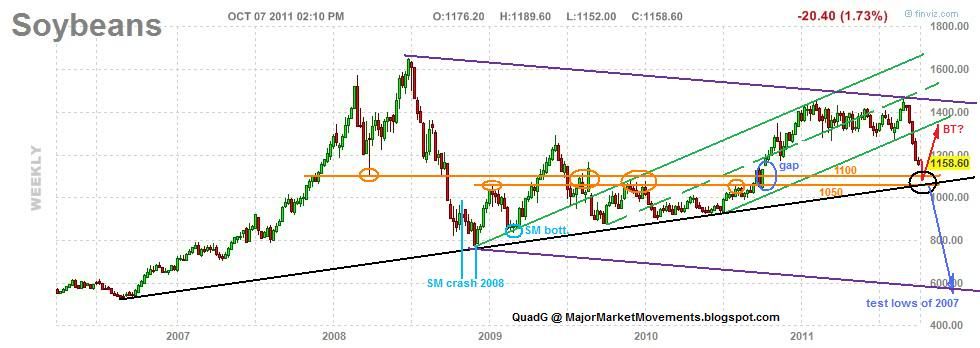
A S/R zone is present between 1050 and 1100, as well as a multi-year uptrend line (black). This should lend plenty of support for at least a bounce up to back test the previous channel at a minimum. If however the black trend-line breaks (blue projection) then capitulation has likely set in and a larger C wave down to the 600s is possible.
The seasonals, like corn, suggest that a bounce is possible soon, if a bit over due:

Wheat - I think the conclusion of a wave 2 black correction could be seen soon. The pattern looks like a possible 3-3-5 expanded flat. It should conclude soon above the lower-green channel line, 61.8% fibo retrace level and the support/resistance area (orange):
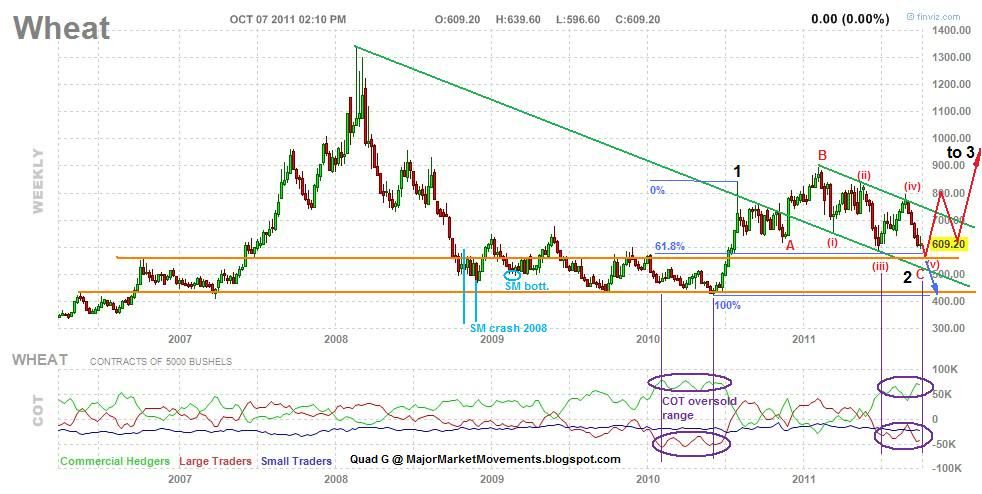
If this level provides support, then a bounce back up to the mid-700s to 800 seems probable, possibly the right neck of a bullish iHnS. The COT levels are entering an oversold area. If however, the price of wheat falls below the lower-green channel line (blue projection), then the 400 level is likely to be tested along with further downside if the previous green channel becomes resistance instead of support.
The seasonal chart suggests a minor up swing is possible soon into November, but further weakness expected into the end of the year:
Also note the pale blue areas of each chart. The bracket shows where the worst of the 2008 Stock Market (SM) dump occurred. Notice how the grains barely moved in comparison. The pale blue circle was near the end of the SM decline in March 2009, yet the grains put in higher-lows.
...


Wednesday, October 5, 2011
Morning Coffee with Quad G - 10/5/11
Mornin' all,
Dow - Here is the 2008 analog that I have been tracking for the past few weeks:

Notice the similarities to the current movements in 2011:

And then zoom out to the larger picture:

Wave 3 black down could be a doozy. This bearish pattern will be killed if the Dow breached 11,370.
Now you might be wondering why I didn't start tracking the analog from the 2007 top. Let me explain: The drop from Oct 2007 to March 2009 was a large wave (1). The rebound up to 12,751 in July was larger wave (2). Now I think large wave (3) down has started, but since wave 3s are most often much stronger in conviction than wave 1s, I suspect that this wave (3) down is going to start off looking like the worst part of the previous wave (1).
Gold - Currently looking bearish after a failure to move above critical resistance and the 10EMA. A small 5 wave impulse down is likely to lock in a ST top at 1678. I expect 2 more legs down to complete a 5 wave series that should retest and possibly exceed the low at 1532. But this low could finish the bearish pattern since 1912, possibly providing a major bottom.
Silver - Still looks ST bearish while below 31.50 and the 10EMA (currently 31.75). A retest of the lows at 26 looks likely while below those levels. But it's very possible that this is a major low.
USD - Making odd EW patterns, so I always fall back on the 3/10/20 ribbon. The trend still remains bullish while daily closes remain above the 10EMA (currently 78.45) and intra-day remains above 77.50. Sinking below those levels suggests the uptrend is jeopardy.
Good Hunting.
...
Dow - Here is the 2008 analog that I have been tracking for the past few weeks:
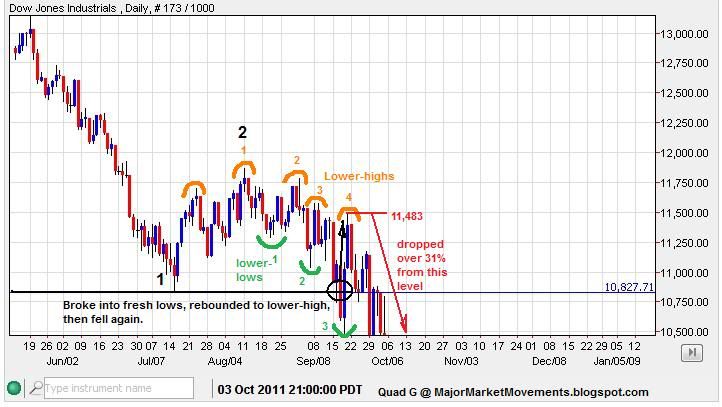
Notice the similarities to the current movements in 2011:
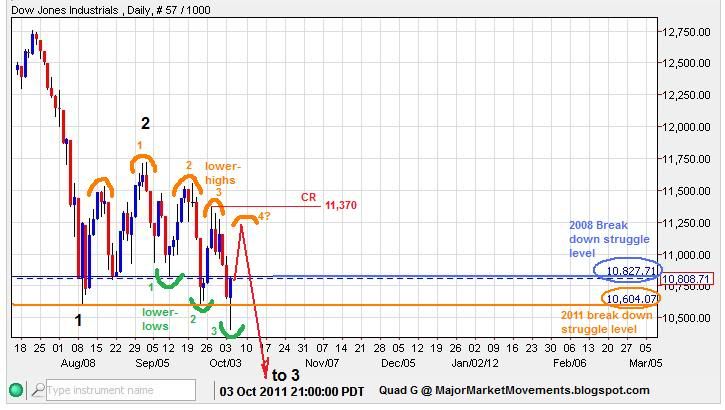
And then zoom out to the larger picture:
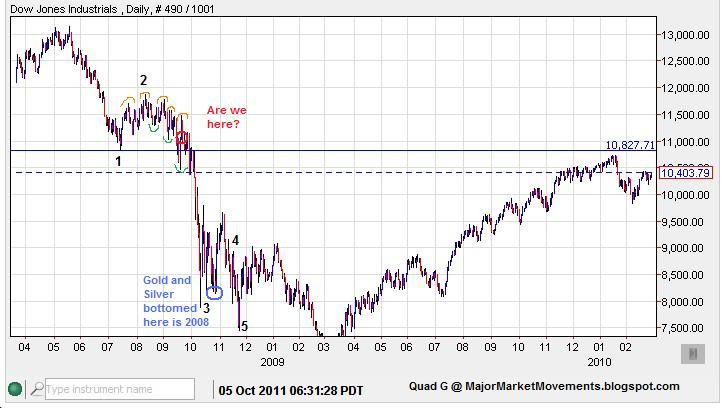
Wave 3 black down could be a doozy. This bearish pattern will be killed if the Dow breached 11,370.
Now you might be wondering why I didn't start tracking the analog from the 2007 top. Let me explain: The drop from Oct 2007 to March 2009 was a large wave (1). The rebound up to 12,751 in July was larger wave (2). Now I think large wave (3) down has started, but since wave 3s are most often much stronger in conviction than wave 1s, I suspect that this wave (3) down is going to start off looking like the worst part of the previous wave (1).
Gold - Currently looking bearish after a failure to move above critical resistance and the 10EMA. A small 5 wave impulse down is likely to lock in a ST top at 1678. I expect 2 more legs down to complete a 5 wave series that should retest and possibly exceed the low at 1532. But this low could finish the bearish pattern since 1912, possibly providing a major bottom.
Silver - Still looks ST bearish while below 31.50 and the 10EMA (currently 31.75). A retest of the lows at 26 looks likely while below those levels. But it's very possible that this is a major low.
USD - Making odd EW patterns, so I always fall back on the 3/10/20 ribbon. The trend still remains bullish while daily closes remain above the 10EMA (currently 78.45) and intra-day remains above 77.50. Sinking below those levels suggests the uptrend is jeopardy.
Good Hunting.
...
Tuesday, October 4, 2011
Trade School - Dow and the 78.6% fibo retrace 10/4/11
The most common Fibonacci retrace levels are the 38.2%, 50.0% and 61.8%, these levels have stopped and started trends for decades. But also of significant importance are the 23.6% and 78.6% retrace levels. For today's discussion we'll focus on the little known 78.6% level. The Dow is being used for this particular demonstration, but the same concept can be applied to any market.

In the past couple weeks the Dow has provided 2 very low-risk entries to initiate short positions. Notice that I have them both counted as 2nd waves, the 78.6% fibo can often be reached during a 2nd wave.
Trade #1 - Since a 2nd wave is not allowed to retrace 100% of wave 1, the top of wave 1 becomes the stop loss level. In this case the stop loss level is 11,716 as the origination of wave {i} blue down. Eying the 78.6% retrace level of wave {i}, a double top is formed right at that level, providing a less that 2% risk for a Dow short position. With a potential 20%+ drop according to my wave count, That provides an approximate Risk/Reward/Ratio of about 1:10, which is well worth my attention.
Trade #2 - Was another 'gimme'. Wave (ii) green also retraced and stalled right at the 78.6% fibo of wave (i) green. This provided a second low risk entry on a short position of just over 2%.
Now with stops set between 11,150 and 11,370 I have two short positions with good odds of greater downside loaded with minimal risk. At worst these trades could be stopped out for a small gain and break-even.
Many traders will often wait to enter a position after some kind of confirmation or strong move. I actually discourage that thinking because the risk can be greater. In my way of thinking, it's better to top pick or bottom pick starting with a partial position, then chase a trend that has already started. When the bus has left the station, chasing it can have greater risks. What if the bus suddenly stops and reverses while you are trying to get on? you could soon see your position under the bus. No, a better place to gage risk is at the designated bus stops, when price action is calmer and more organized. Trade management is risk management, in any market the ONLY thing you can positively control is the amount of risk one is willing to take......the ONLY thing. You have 0% control over price action, but you have 100% control over risk, therefore it's best to find and act on the conditions that provide the least amount of risk.
...
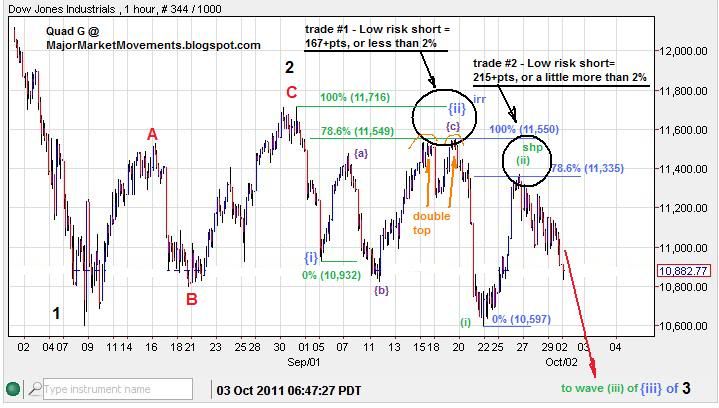
In the past couple weeks the Dow has provided 2 very low-risk entries to initiate short positions. Notice that I have them both counted as 2nd waves, the 78.6% fibo can often be reached during a 2nd wave.
Trade #1 - Since a 2nd wave is not allowed to retrace 100% of wave 1, the top of wave 1 becomes the stop loss level. In this case the stop loss level is 11,716 as the origination of wave {i} blue down. Eying the 78.6% retrace level of wave {i}, a double top is formed right at that level, providing a less that 2% risk for a Dow short position. With a potential 20%+ drop according to my wave count, That provides an approximate Risk/Reward/Ratio of about 1:10, which is well worth my attention.
Trade #2 - Was another 'gimme'. Wave (ii) green also retraced and stalled right at the 78.6% fibo of wave (i) green. This provided a second low risk entry on a short position of just over 2%.
Now with stops set between 11,150 and 11,370 I have two short positions with good odds of greater downside loaded with minimal risk. At worst these trades could be stopped out for a small gain and break-even.
Many traders will often wait to enter a position after some kind of confirmation or strong move. I actually discourage that thinking because the risk can be greater. In my way of thinking, it's better to top pick or bottom pick starting with a partial position, then chase a trend that has already started. When the bus has left the station, chasing it can have greater risks. What if the bus suddenly stops and reverses while you are trying to get on? you could soon see your position under the bus. No, a better place to gage risk is at the designated bus stops, when price action is calmer and more organized. Trade management is risk management, in any market the ONLY thing you can positively control is the amount of risk one is willing to take......the ONLY thing. You have 0% control over price action, but you have 100% control over risk, therefore it's best to find and act on the conditions that provide the least amount of risk.
...
Morning Coffee with Quad G - 10/4/11
Mornin' all,
Gold - Currently struggling with the 10EMA, which is the first sign that a recovery is possible soon. The 3/10/20 still maintains it's bearish alignment, so bottom picks are generally small, exploratory positions.

A daily close above the 10EMA may be able to pull the 3EMA above, causing the alignment to become neutral, which may open up a shot to test the 20DMA (currently at 1739ish. However, looking ahead at potential candle patterns, a daily close below 1628.80 would signal an Outside Key Reversal(OKR) inviting more selling with a potential ST top at 1678ish.
The ST EW pattern is starting to remind me of the Bullish barrier triangle that was formed in late August. Still early to tell, but staying above 1582 in a choppy sideways action will encourage this concept.
Dow - Plenty of bearish sign lately:

'Hairy' tops and closing under the 20DMA has helped maintain a bearish alignment of the 3/10/20 ribbon. I see a gap down this morning after breaking into fresh multi-week lows. The Bollinger bands are starting to expand as the lower band is 'pushed'.
I mentioned the 78.6% Fibonacci retrace level on some ST rallies recently. I will post a separate Trade School article depicting their importance.
Bernanke is going to speak at 7AM (PST). This would be a fine time to announce a surprise to gin up the markets.
We,ll see....
Good Hunting
...
Gold - Currently struggling with the 10EMA, which is the first sign that a recovery is possible soon. The 3/10/20 still maintains it's bearish alignment, so bottom picks are generally small, exploratory positions.
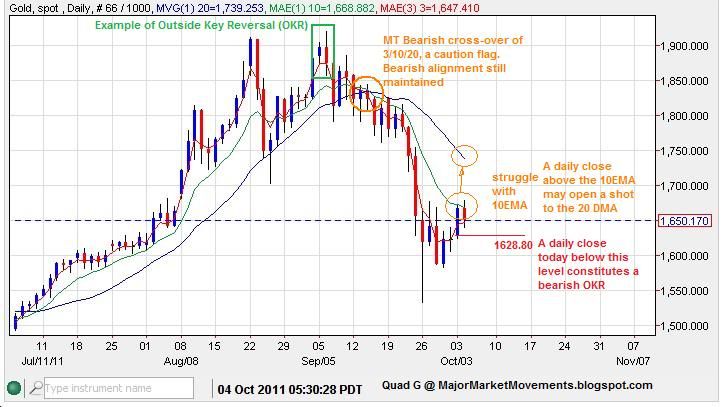
A daily close above the 10EMA may be able to pull the 3EMA above, causing the alignment to become neutral, which may open up a shot to test the 20DMA (currently at 1739ish. However, looking ahead at potential candle patterns, a daily close below 1628.80 would signal an Outside Key Reversal(OKR) inviting more selling with a potential ST top at 1678ish.
The ST EW pattern is starting to remind me of the Bullish barrier triangle that was formed in late August. Still early to tell, but staying above 1582 in a choppy sideways action will encourage this concept.
Dow - Plenty of bearish sign lately:
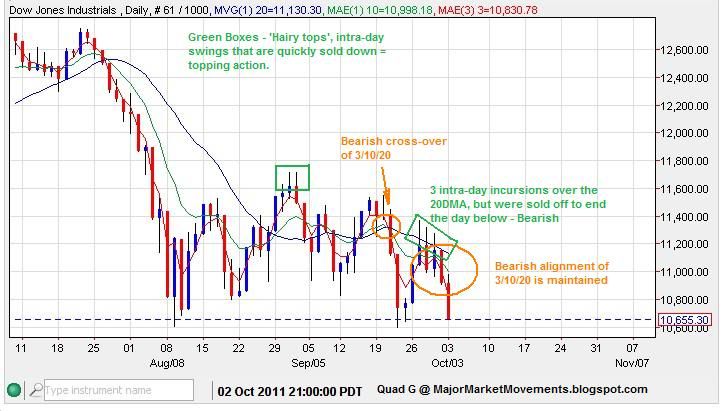
'Hairy' tops and closing under the 20DMA has helped maintain a bearish alignment of the 3/10/20 ribbon. I see a gap down this morning after breaking into fresh multi-week lows. The Bollinger bands are starting to expand as the lower band is 'pushed'.
I mentioned the 78.6% Fibonacci retrace level on some ST rallies recently. I will post a separate Trade School article depicting their importance.
Bernanke is going to speak at 7AM (PST). This would be a fine time to announce a surprise to gin up the markets.
We,ll see....
Good Hunting
...
Monday, October 3, 2011
MMM Weekly Round Table Discussion 10/3/11 to 10/9/11
This month is going to be very busy and erratic for me. There may be days and even whole weeks that I will not be able to post at all.
I am able to respond to questions and comments on the road thanks to the smart phone. But I do not always have access to a laptop or desk top to view charts on the Netdania platform, so some details will not be available to me and producing charts will be difficult at times
...
I am able to respond to questions and comments on the road thanks to the smart phone. But I do not always have access to a laptop or desk top to view charts on the Netdania platform, so some details will not be available to me and producing charts will be difficult at times
...
Sunday, October 2, 2011
HUI - Why Alternation Matters 10/2/11
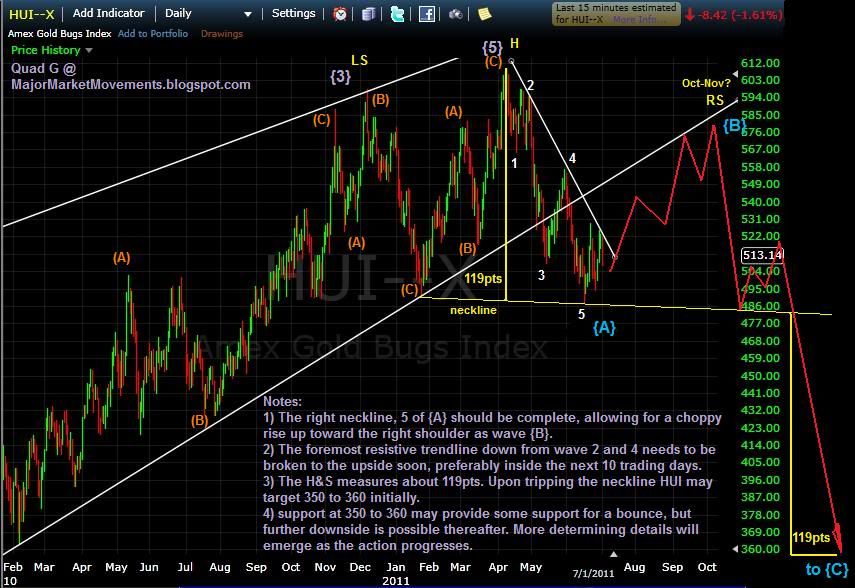
Back in early July I presented this chart of HUI:

I was counting on a final 5th wave and the start of impulsing to the downside (5 waves down into wave {A}blue). What I failed to consider is that wave {4} was likely an expanded flat to alternate with the sharp wave {2} as depicted in this chart:

I also didn't consider that wave (C) orange of wave {3} blue could have been an ending diagonal with a very short lived and excitable 3rd wave.
Another HnS pattern could be setting up again, possibly with two sets of shoulders, with a Right Shoulder #1 (RS1) likely to fill the large gap down (blue box). The right neckline likely to be completed soon in October.
Here is what the pattern would look like zoomed out to incorporate the 2000 bottom:

This larger view also requires us to consider that a very larger ABC structure could be complete here. Wave [C] red now equals wave [A] (about 490pts a piece) a common EW relationship. Wave [A] was a well organized impulse to the upside, but wave [C] has so far produced a very choppy move to the upside with many overlaps, a quality of ending diagonals. I suspect that a right shoulder bounce should arrive soon, but needs to stay above that neckline (green) on a weekly closing basis. If that neckline does not give support (blue projection) then a right shoulder could be denied and a test of the previous area of price congestion may come much sooner than later.
This HnS idea is killed if price moves above the head near 640ish.
One more thought to throw into the mix, that of the expanded triangle count:

Expanding triangles are rare, but the current pattern is very close to producing one. Wave (C) would need a reinterpretation, and wave (E) should stay above the neckline as a 3 wave move. This would allow for another 3 wave move up as a final 5th above 640.
From a fundamental stand point, if crude continues it's MT trend to the downside (target 60 next, then 33 to 45 eventually), but gold finds a significant bottom this month. The profitability of miners will gain as fuel costs would likely shrink considerably. Those miners with little or no debt and large dividends will likely survive the best under another stock market sell-off. Some juniors with pristine balance sheets, good management and proven reserves may become take over targets by some seniors if their stock prices are dumped into an attractive buy zone.
Good Hunting.
...
I was counting on a final 5th wave and the start of impulsing to the downside (5 waves down into wave {A}blue). What I failed to consider is that wave {4} was likely an expanded flat to alternate with the sharp wave {2} as depicted in this chart:
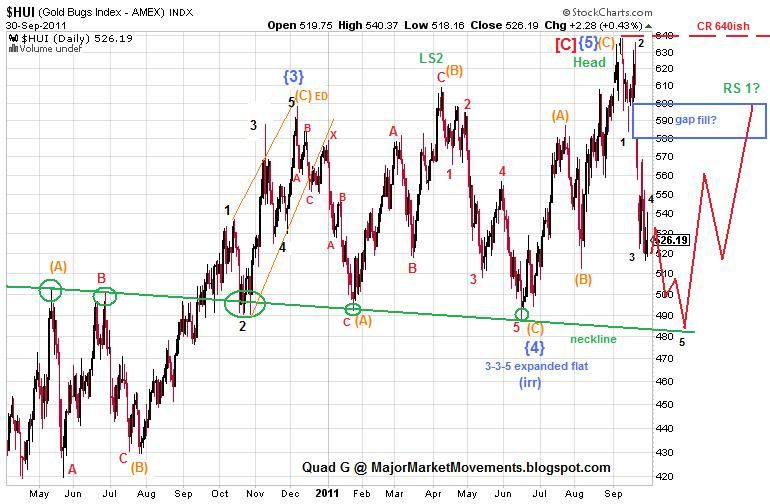
I also didn't consider that wave (C) orange of wave {3} blue could have been an ending diagonal with a very short lived and excitable 3rd wave.
Another HnS pattern could be setting up again, possibly with two sets of shoulders, with a Right Shoulder #1 (RS1) likely to fill the large gap down (blue box). The right neckline likely to be completed soon in October.
Here is what the pattern would look like zoomed out to incorporate the 2000 bottom:

This larger view also requires us to consider that a very larger ABC structure could be complete here. Wave [C] red now equals wave [A] (about 490pts a piece) a common EW relationship. Wave [A] was a well organized impulse to the upside, but wave [C] has so far produced a very choppy move to the upside with many overlaps, a quality of ending diagonals. I suspect that a right shoulder bounce should arrive soon, but needs to stay above that neckline (green) on a weekly closing basis. If that neckline does not give support (blue projection) then a right shoulder could be denied and a test of the previous area of price congestion may come much sooner than later.
This HnS idea is killed if price moves above the head near 640ish.
One more thought to throw into the mix, that of the expanded triangle count:

Expanding triangles are rare, but the current pattern is very close to producing one. Wave (C) would need a reinterpretation, and wave (E) should stay above the neckline as a 3 wave move. This would allow for another 3 wave move up as a final 5th above 640.
From a fundamental stand point, if crude continues it's MT trend to the downside (target 60 next, then 33 to 45 eventually), but gold finds a significant bottom this month. The profitability of miners will gain as fuel costs would likely shrink considerably. Those miners with little or no debt and large dividends will likely survive the best under another stock market sell-off. Some juniors with pristine balance sheets, good management and proven reserves may become take over targets by some seniors if their stock prices are dumped into an attractive buy zone.
Good Hunting.
...
Subscribe to:
Posts (Atom)