Monday, July 11, 2011

SPX ST - A Critical Crossroads

Last Thursday 7/7/11, I depicted the case for a right shoulder of a very bearish S&P500 using the SPY chart:


Though Friday's action was impulsive to the downside, it was non-committal as a follow through day, not closing under the gap.

However, Monday opens with some potential commitment to the downside. Currently the move down from Thursday's high has only posted 3 waves:

(click on chart for full view)
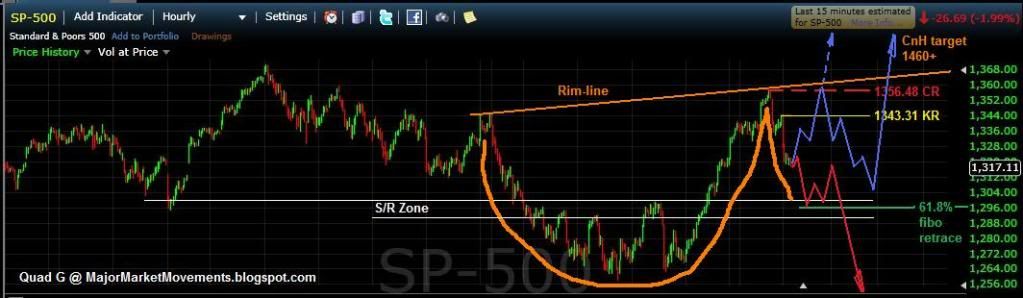

Strong patterns are present for both the Bull and Bear case. A break-out from either of these positions will likely cause many stops to trip producing strong moves in either direction.

The Bear Case - Currently underway, price action in the short term would need to stay below Key Resistance (KR) at 1343.31 and then see at least one more leg down in the next day or two. A five wave impulse down for wave (i) may end at a prominent Support/Resistance zone between 1292 and 1300, with the 61.8% fibo retrace in between at 1296. Bears would then want to see a lazy 3 wave bounce into wave (ii), preferable staying under the KR (1343.31). Any moves above the Critical Resistance (CR) at 1356.48 would kill the bearish potential in favor of the Bull case. After a wave (ii) bounce, Wave (iii) down should easily take out the neckline of the Head and shoulder pattern, triggering a possible slide to the HnS target of 1146ish.

The Bull Case - Any further weakness in the market needs to maintain a choppy consolidation pattern of overlapping 3 wave structures, preferably keeping above the S/R zone. Such a pattern could be a handle of a bullish CnH pattern. Bulls would want to see the rim-line challenged and then eventually broken after the handle is complete. Tripping the rim-line, produces a calculated target of about 1460ish.

In these types of circumstances - neutral cross roads, with strong break-out potentials, a good trading strategy is using a straddle. A typical straddle position uses equal weights of opposing instruments, for example: $10,000 of SSO (200% the SPX) and $10,000 of SDS (200% inverse the SPX). Then when the Bull or Bear case loses as defined, then end the losing position and keep the winner.

I also did a time fibo measurement from the current top of 1370.58:
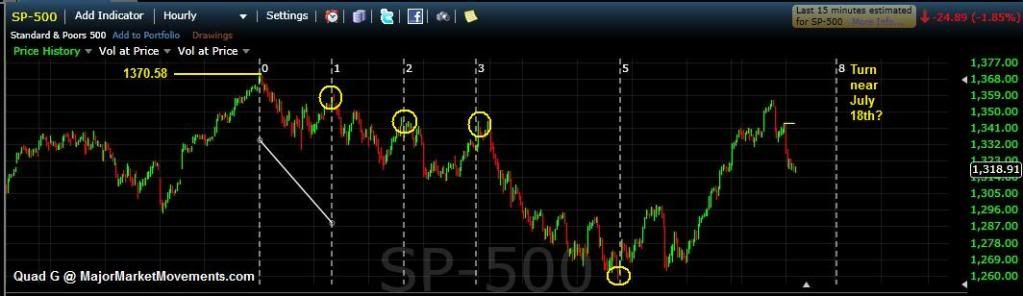

The fibo time sequences #1,2,3 and 5 have all produced a turn. I would look for #8 to also present at turn around July 18th (Monday). A Full Moon is also present the Friday before on July 15th (end of this week). This could mark the end of this neutral area and the start of the break-out. A Fibo turn date typically doesn't show direction, however if a trend heads into that date, the trend is likely to reverse near that time.


...

Sunday, July 10, 2011

Gold LT - Putting AU in AUgust

As the amazing month of August is only 3 weeks away, I sat down to take a look at what this August 2011 may have in store for the Gold market.

I discovered a few interesting Facts:
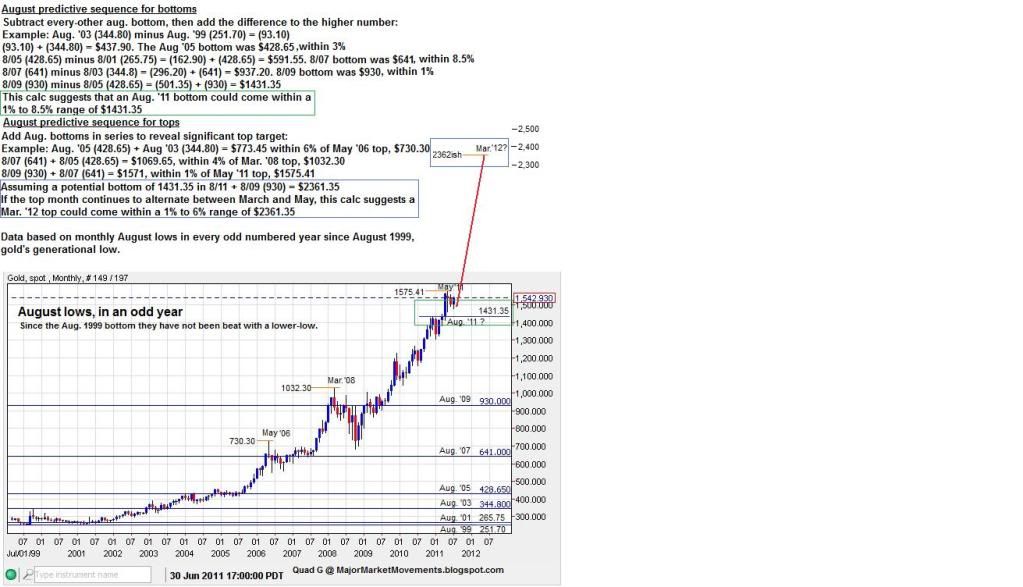
1) This Gold market Bull rally began with a final low in August 1999, at a paltry price of $251.70.
2) If a wise investor with great foresight bought gold at the August lows in every odd numbered year since 1999, that investor would have never seen any of those investments back track one penny.
3) Everyone of those August lows in an odd year have seen impulsive runs into new all time highs inside just a few months thereafter.

Now that is pretty interesting in and of itself. Especially since this August 2011 is another odd August.

But that wasn't enough for me, I had to mess with the numbers. Taking the price levels of every low in August in an odd year and making a few simple calculations created an amazing sequence! leaving us with a projection into 2012.

Here is what it looks like:


Some of these calcs were off by as much as 8.5% and some were within 1%.
Heck, If I could target a trade within 10% of a significant top or bottom I'd be happy.

Significant tops have been placed in May '06, March '08, May '11. Alternating months, will March be the next topping month? The August low in 1979 also launched more impulsive moves toward the 1980 final high posted in January. Perhaps today's market is gearing for a major run toward the Winter quarter 2012, erupting from lows this August?

Projecting forward, continuing the calculated logic of this pattern, it's easy to see that a Gold price near 2362 is entirely possible by March 2012. This would certainly keep with the parabolic movement that has been established since 1999. This also meets up with other work that I have done with Elliot Waves and cycles that also suggest a turn this August and a top in 2012 within the 2050 to 2450 range.

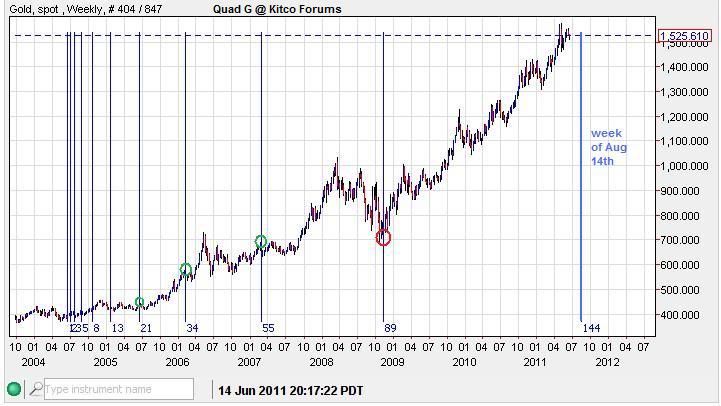
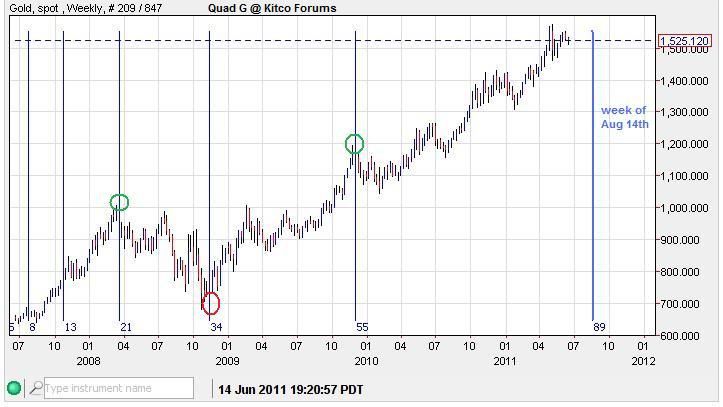
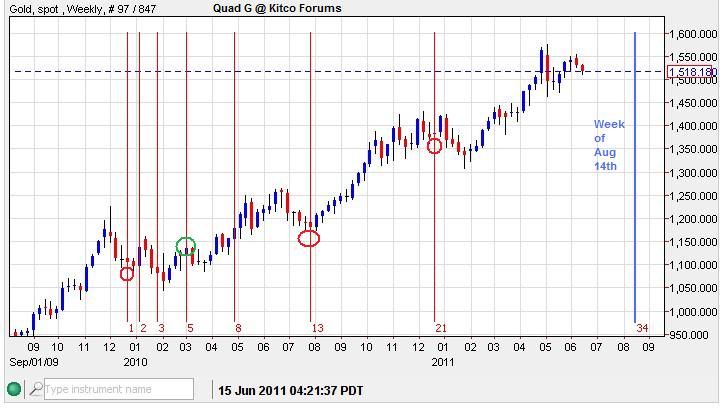
Here is another set of charts using a set of Fibonacci measurements in time:


All 4 point to this coming August, particularly the week of the 14th, as a highly likely point for a significant turn......in an odd year....2011.

This leads me to a couple of questions:
1) Will this August produce another low just before an impulsive run back into all time highs?
2) Will March 2012 see prices around 2362?
3) Is there a God in Heaven that likes Gold?

I think the answer to #1 and #2 is: Most likely
My Answer for #3 is: undoubtedly!

The universe appears for many to be chaotic, random, accidental and without purpose. However studies like the one I have presented may suggest that perhaps, if one digs a little under the surface, an intelligent design, a finger-print of God, can found.


...

Thursday, July 7, 2011

SPX - Bearish HnS pattern near completion?

The SPX is still showing a bearish H&S pattern. Today's thrust up to 1356ish reduces the risk on a short play to about 15pts, with stops above 1370 (the head) which is inside my preferred risk zone of 1-3%.

SPY may have put in an exhaustion gap today.

The volume on SPX an SPY have trickled off steadily as price has climbed. Volume is reaching down into sub-average range.

Tomorrow the NFP numbers come out before the market opens. Perhaps poor numbers will be the impetus for a turn in Stocks.

Here is technical picture of the ETF SPY, which tracks the S&P 500 (SPX):


The volume action suggests that a distribution top is very possible as more trades are selling into a moderately rising top.


...

Wednesday, July 6, 2011

Gold ST - a completed impulse awaiting a small correction

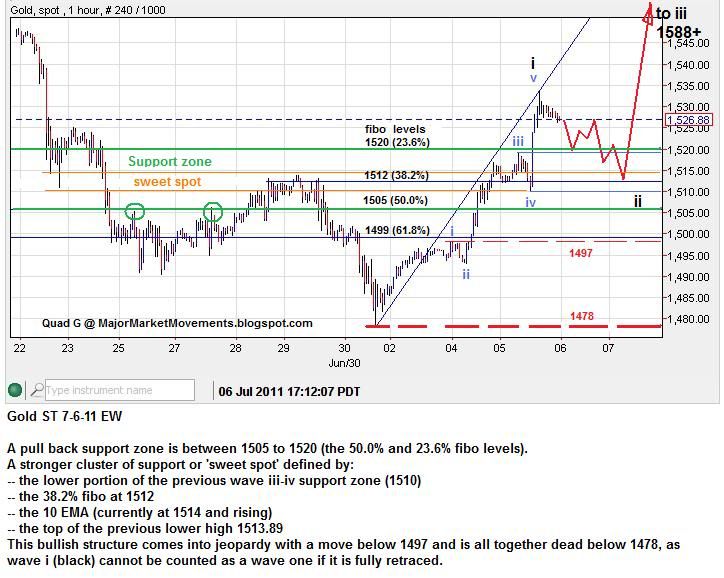
Gold advanced further today to complete a better looking impulse then the one I outlined yesterday:


With the government Non-farm Payroll numbers coming out this Friday early morning, I suspect that the markets will enter a customary pregnant pause before this important report. The ADP report tomorrow may give a peek at what could be expected on Friday.

The Short Term count above takes this potential action into account. Anticipating a slow choppy move down to a well defined support area at 1505 to 1520. An even tighter cluster of support can be seen at the 'sweet spot' Bullish impulsive behavior will often use the 10 EMA (daily chart) as support, it is currently at 1514 creeping higher.

The 1497 to 1478 area is a jeopardy zone, which is a neutral area that can often extinguish many previous bullish vibes. These zones are typically located below the 61.8% fibo retrace level and/or below the previous wave 1 (i blue)and the start of the impulse, in this case 1478. Price action in the jeopardy zone is a warning only and doesn't necessarily indicate the trend will fail. 3 wave choppy moves into the jeopardy zone are less trouble than a sharp 5 wave impulse into the zone.

Death is Death, final, irreversible. If Elliot Wave rules are violated then the count is required to change. In this case, Wave 1s (i black) is no longer considered a wave 1 impulse if it is fully retraced below it's origination point.


...

Copper - continuing into wave 5

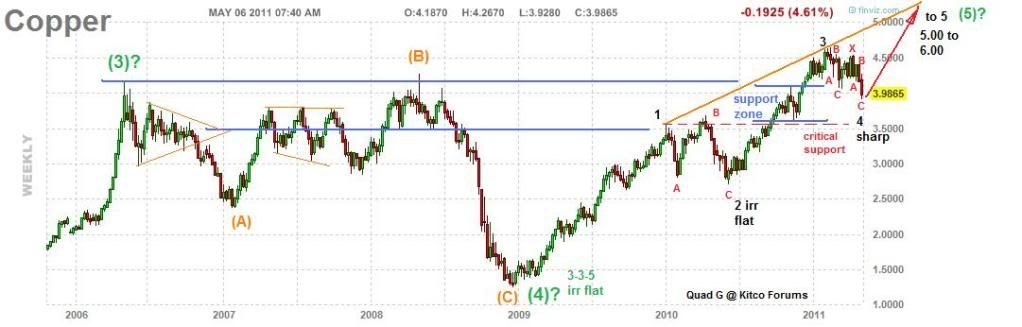
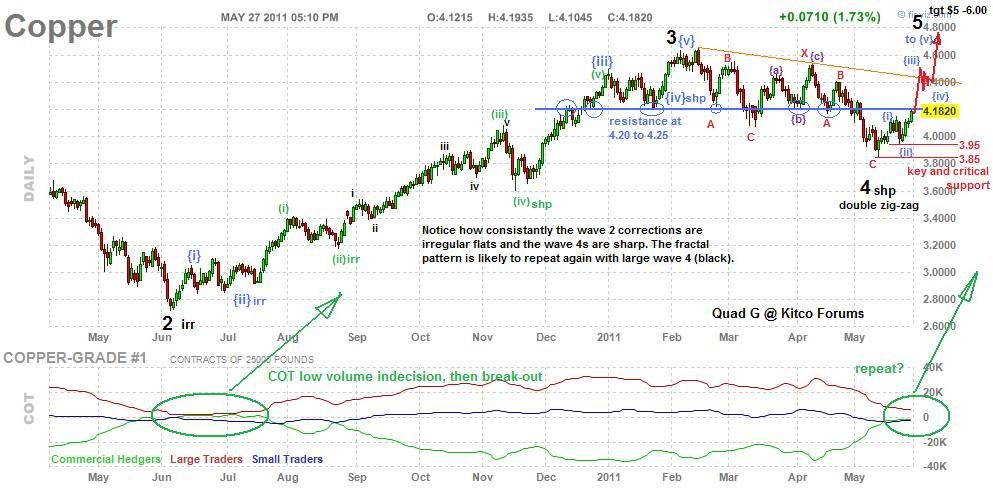
The Long Term (LT) and Medium Term (MT) picture for copper has not changed, A 5th wave higher is still expected to materialize.

Long Term chart from early May '11:


Medium Term chart from late May '11:


The sharp wave 4 correction appears to be complete as a sharp double zig-zag abc-x-abc. Now the anticipation is to see a 5 wave impulse move higher from that point.
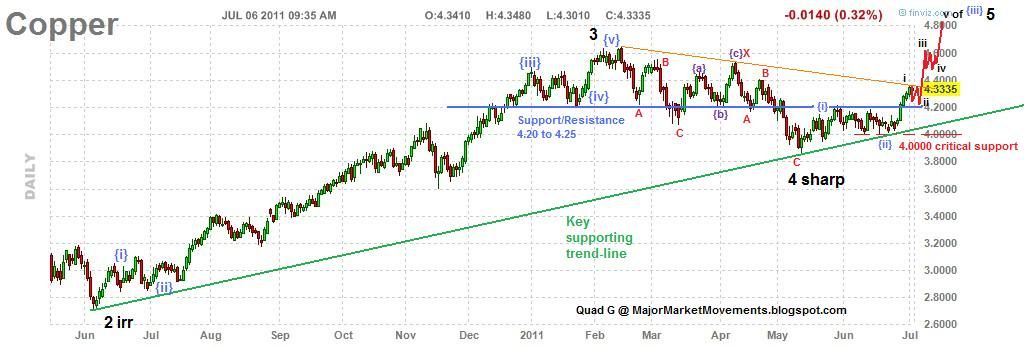
Today's Update:


So far only a 3 wave move up to challenge the key resistive orange trend-line is observed. The bullish preference would be to see a small 3 wave consolidation for wave ii of {iii} keep above the Support/Resistance(S/R) level at 4.20 to 4.25, then a thrust higher as a Point of Recognition (PoR) iii of (breach the orange trend-line to test the previous highs above 4.60.

BREAKING NEWS! The key resistive orange trend-line was just breached a few hours ago.


...

Tuesday, July 5, 2011

Silver - set to breach key resistance

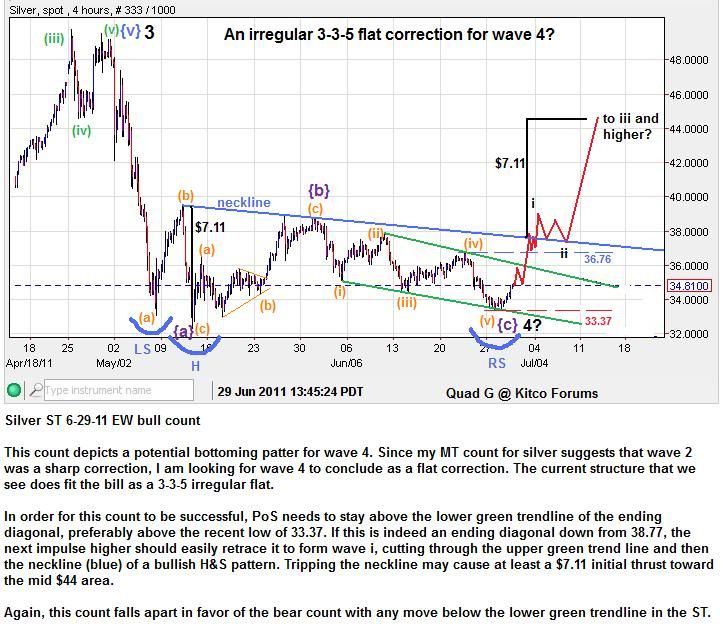
On June 29th I presented a potential bullish count. It required the Price of Silver (PoS) to remain above the lower green trend-line of a likely ending diagonal pattern, and most preferably 33.37. The bull count shown here:


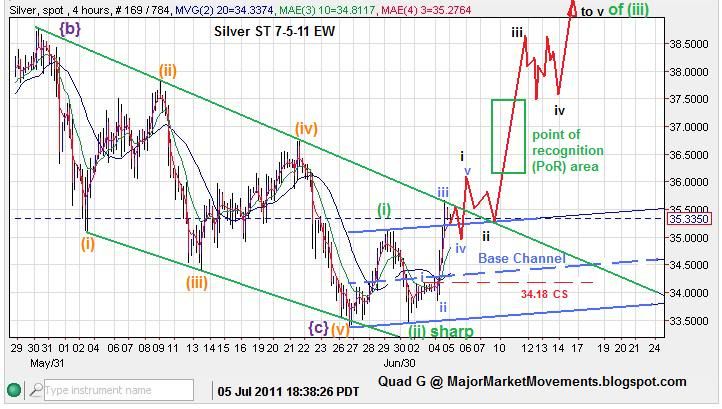
With today's bullish rally, the above bull count is near confirmed. Update Below:


As you can see, Silver has closed the day above the Blue Base Channel, this suggests that there is the potential for 3rd wave impulsive action to follow on the upside. Bulls would like to see the upper green trend-line breached soon, followed with a back test. Then proceed forward with the bulk of wave (iii).

This projection will likely be killed with any move back below Critical Support (CS) at 34.18. Which is the wave 1/4 point of overlap violation.

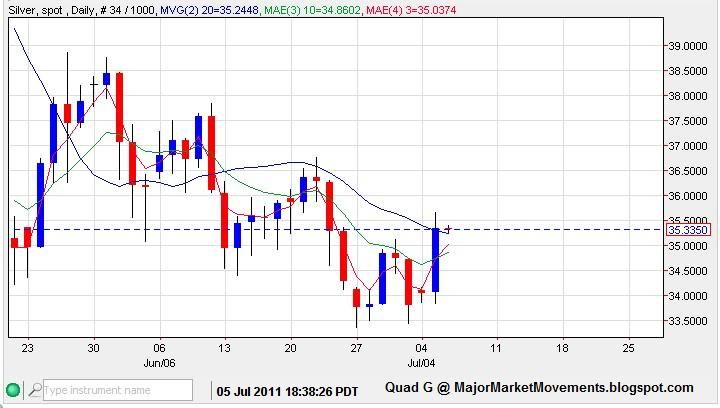
Today's action against the 3/10/20 ribbon on the daily chart was also very Bullish:


The price action closed the day above the 20dma. With subsequent daily closes above the 10 EMA (currently below at 34.85), the 3/10/20 MT bearish alignment will soon reverse.

Again, this potentially Bullish picture will likely fall apart if PoS makes a sudden turn south and takes out 34.18

Gold - Potential Bullish Inverse Head and Shoulder Pattern

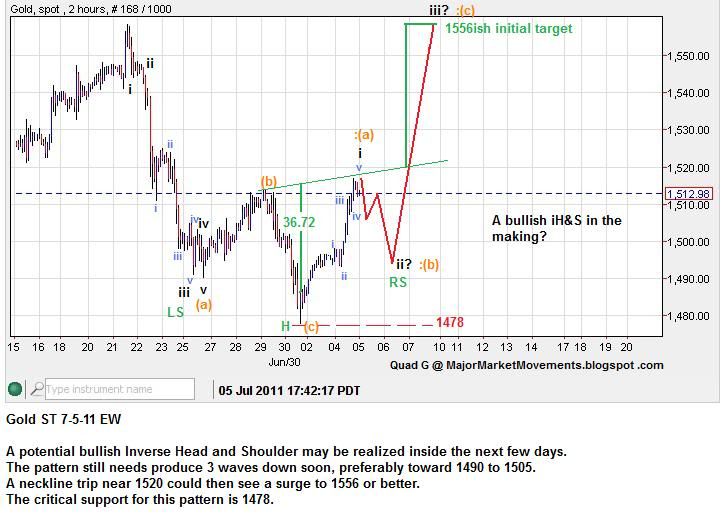
There is a potential for a bullish Inverse Head and Shoulder (iHnS) pattern that may play out on the short term. Look for a corrective 3 wave pattern down as a right shoulder. This Bullish pattern in invalidated with any move below critical support at 1478. Many long positions could be washed out with such a move below this support important support.


In addition to today's bullish move, PoG closed the day above the 10 EMA, this is the first step toward reversing a MT bearish alignment of the 3EMA/10EMA/20DMA ribbon.


...