This weekend update focuses on Gold. There are some very important technical events that need our attention.
First, let's take a look at a few Fibonacci time measurements in Gold. Recently I produced a series of weekly charts that suggested that a significant turn in Gold may be seen in the week of August 14th (Here: Putting AU in AUgust ).
Now with some recent daily action to measure off of I think I can narrow this range down to a daily time period:
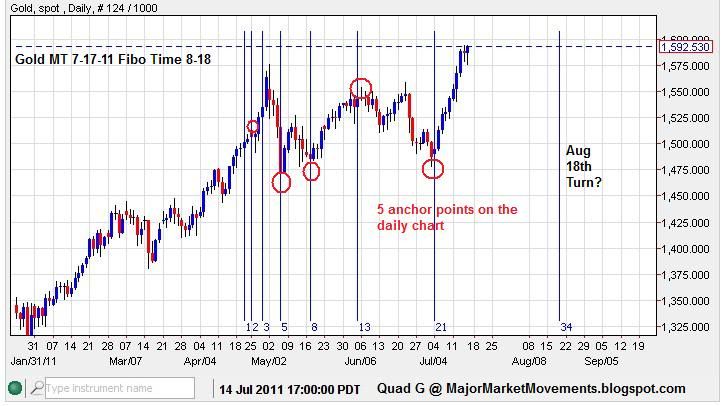
This measure suggests that a turn may be possible near August 18th (+/- 1 day), which is inside the weekly measure of Aug. 14th to Aug 20th. Since this measure has 5 anchor points the relative degree of success is fairly high. Fibo time measurements do not show direction, However, if the trend going into a Fibo time sequence is down for example, the turn is most likely to the upside. Fibo Time measurements are not 100% accurate, just like every other bit of TA. However they do increase the probabilities for success.
The trend in Gold is most certainly up into a Full Moon (July 15th) and a Fibo turn on July 18th:
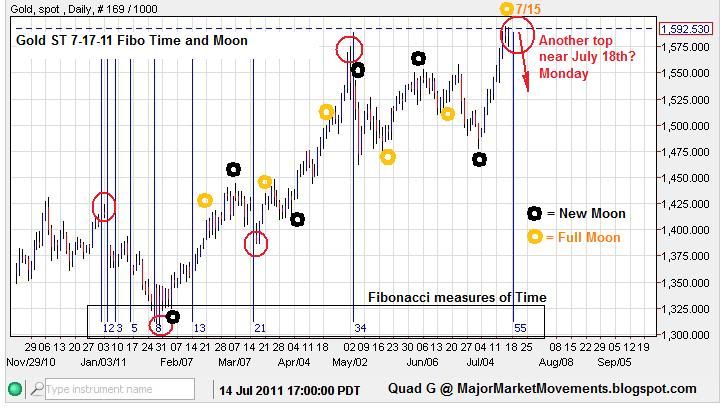
Both cycles suggest a top is either in place or soon will be. Further upside is likely to run into resistance at 1600, 1608ish and 1620ish. I would not be surprised to see this week open up with Asia taking PoG up a 1/2% incursion above 1600 (and 1.27% fibo ex-ret.)as a tease to (1608ish). Only to have the London and US market sell it down again, We'll see. The next line of resistance above 1608 is 1616 to 1620. A move above 1620 solidifies some EW counts, basically deciding between a B wave and a new Wave one impulse.
If Gold does respect this Full Moon and Fibo time measurement, I would expect a move down to test the 10 EMA and possibly 20 DMA:
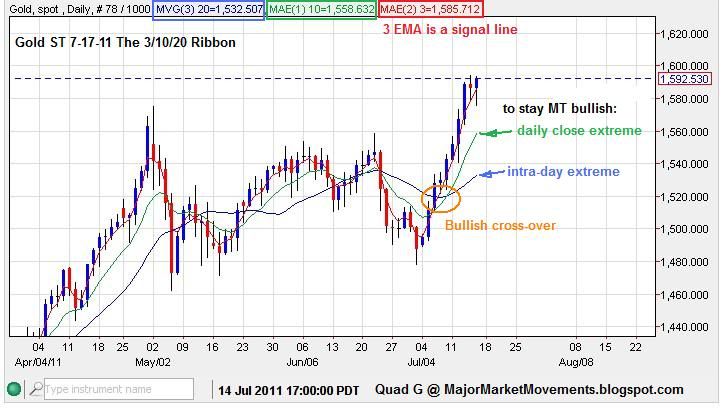
Example:
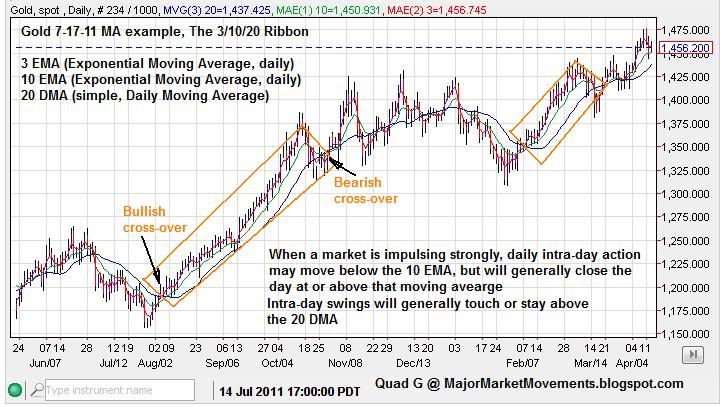
Bullish support for any retrace could be found at the 10 EMA and 20 DMA. daily closes especially need to stay above the 10 EMA. Also the 1% to 3% pull-back levels can often be reached while a trend is impulsing. If a top is in place for example at 1595, a 1% dip = 1579, 3% = 1547. The current fibo retrace levels (61.8% to 23.6% are at 1522 to 1566 respectively. These measures would obviously move up some if the trend continues higher early this week.
The other measure to pay close attention to is the previous week's open:

1542 was the previous week's open. This level becomes key for this week. If a OKR does occur, this signal is bearish. To stay bullish on this weekly chart PoG needs to close this week above 1542. But as the previous top at 1575 showed, if the following week doesn't follow through to the downside, the signal is often a dud.
With all this data, we can estimate a reasonable support zone for any dip to be inside the 1522 to 1579 zone. With firmer support between 1547 and 1558. An impulse down to the 61.8% fibo retrace level of 1522 or less this week could put this bull trend in jeopardy.
The long term support is most certainly the 150DMA:
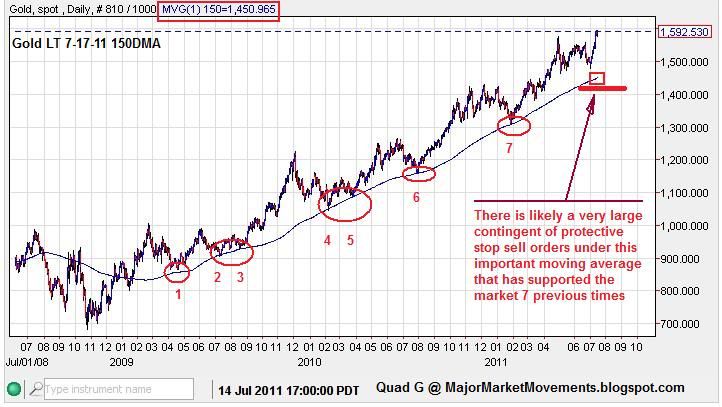
Since 2009 PoG has not had a daily close below this important Long Term support by as much as a couple dollars. A weekly close below this level would most certainly be bearish. No doubt, many protective stops for medium term and long term paper investments are below this 150 day moving average.
A brief report on Silver - As my previous report suggested, 36.85 is key EW support for continued impulsing to the upside. Critical Support is at 33.37. Please understand clearly, if 33.37 is taken out for any reason, very strong and deep downside possibilities open up. The greatest extreme that I can see being reached in a relative short period of time is $22.00. Just like the 150DMA for Gold, the 33.37 level is likely to be just as crucial.
...