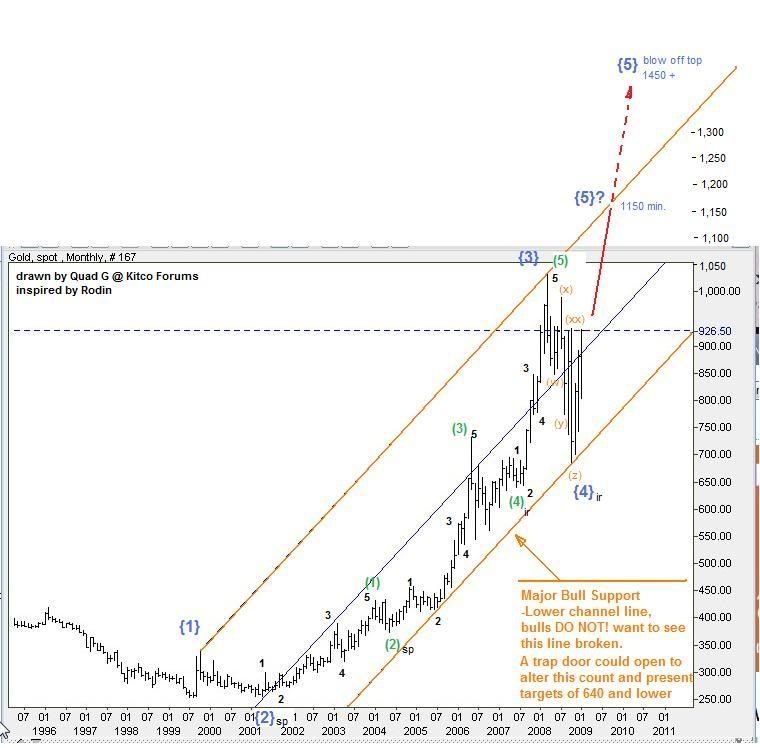
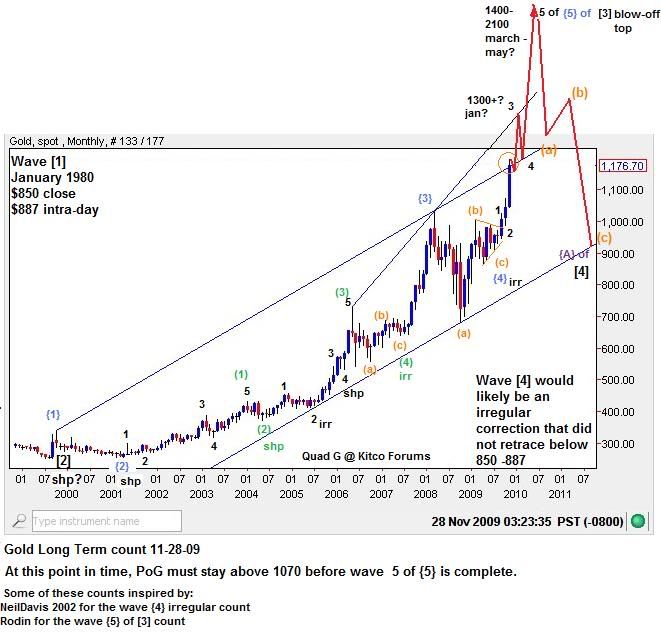
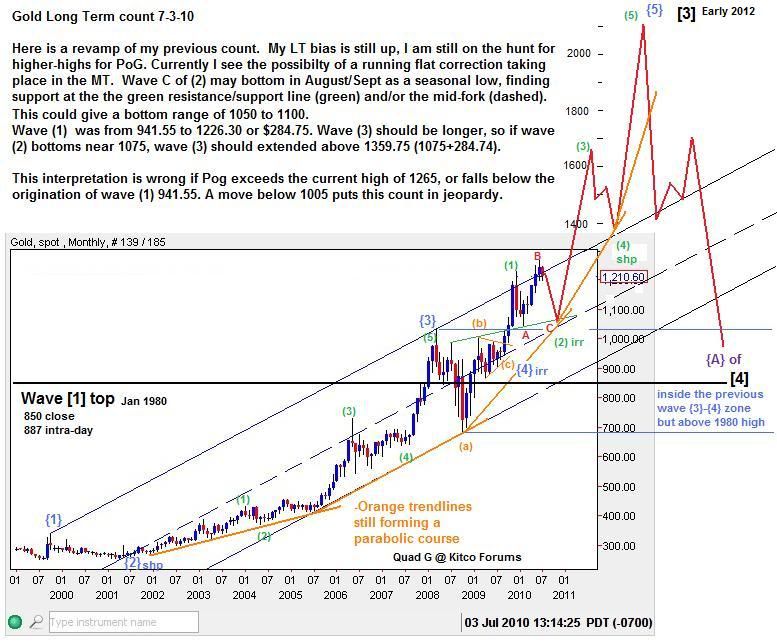
And it has since evolved over time:
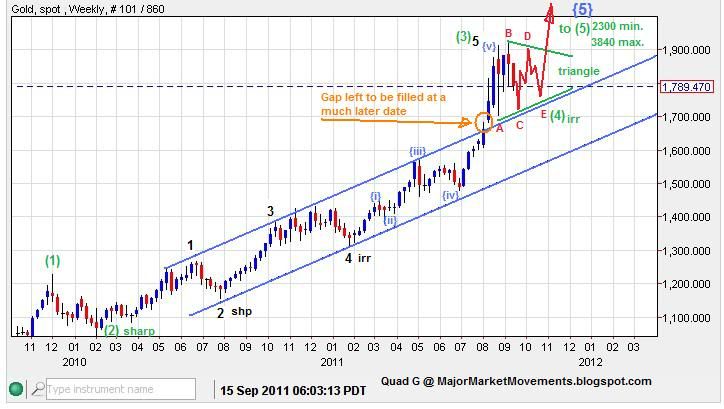
Now here is the latest LT count update:
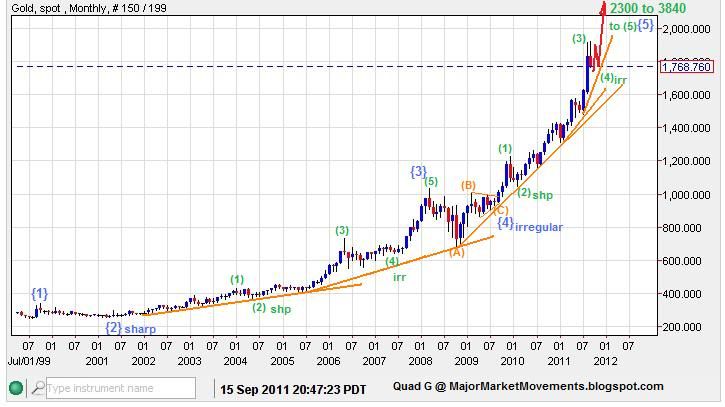
The parabolic base trend-lines (orange) continue to arc higher, approaching near vertical, which suggests the final blow-off top is near. If this triangle for green wave (4) plays out, the final 5th is likely to be seen in the final months of the year. Target Minimum 2300, target maximum 3840.
Here is a zoomed in view of the count depicting the triangle wave (4) idea:
Wave C red of that triangle is nearing completion in the 1710 to 1786 zone. The 78.6% fib retracement of wave B red (1749ish) is a good possible candidate for a bottom support:
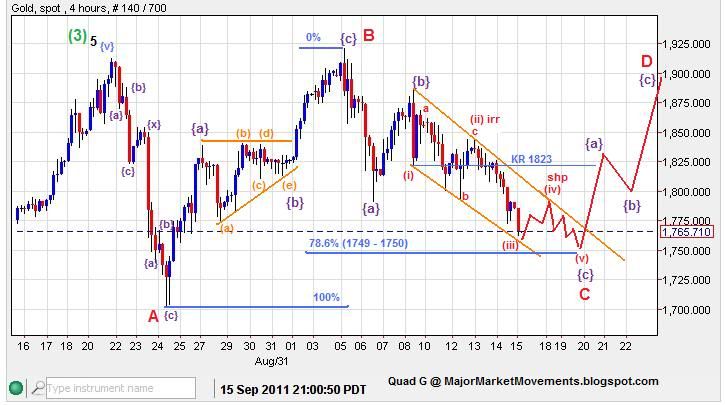
This ST chart gives an idea of what the structure might look like. Once PoG climbs back above 1823 (Key Resistance), the Wave C low should be locked in. Wave C red of the triangle count should be the lowest low before the wave (5) blow-off into 2300 to 3840.
This triangle count is dead if PoG moves below the extent of wave A red (1702). Also moving back into the previous channel (blue) would be bearish.
Please remember these are Elliot Wave counts. This is not fortune telling, it is not a crystal ball. EW gives a very dim view of what might be inside a set of parameters. If those parameters are violated then the count dies and another must be formulated that could be radically different. EW is very scientific but also artistic, it requires a bit of imagination, subjective thought and experience. EW is but one tool of many. Please DYODD when considering investments.
...