Gold - Stayed below the neckline of the iHnS that I posted last week, and then fell through key support at 1709 which I mentioned at Kitco. The break of support created a collapse in price. Though the sudden drop was scary looking, I do not yet see a reason to panic.
I need to point out a very bearish candle stick formation that reared it's ugly head on Thursday. Unfortunately I did not see it for myself until Friday:
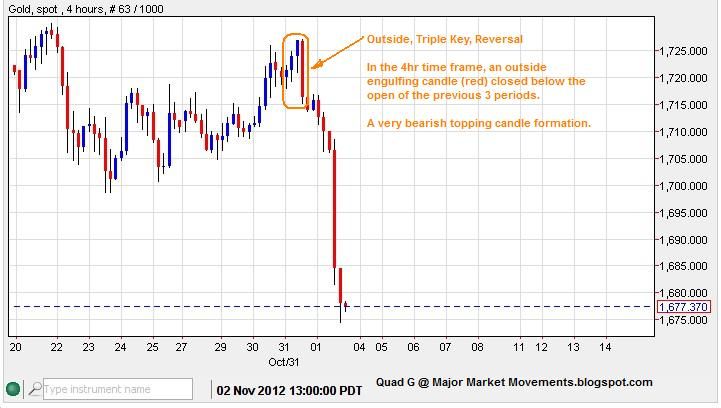
A single outside key reversal is powerful enough to indicate a turn. But a triple key reversal is even more powerful as you can clearly see.
The October 30th-31st fibo turn window did indeed create a turn, but certainly not what I had anticipated.
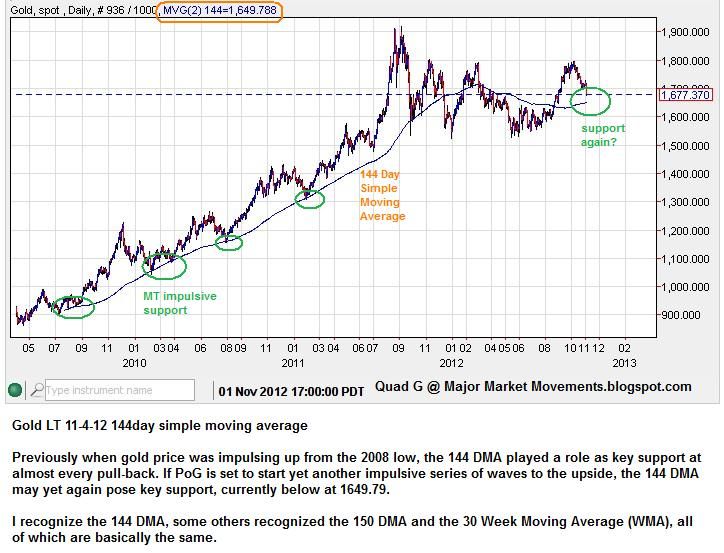
Blister reminded me of the 144 daily moving average(DMA)that has served as support many times while gold was in a MT impulsive mood. That moving average may yet again play a role if gold is indeed making a major bottom with strong upward moves again. Currently the 144DMA is below at about 1650ish:
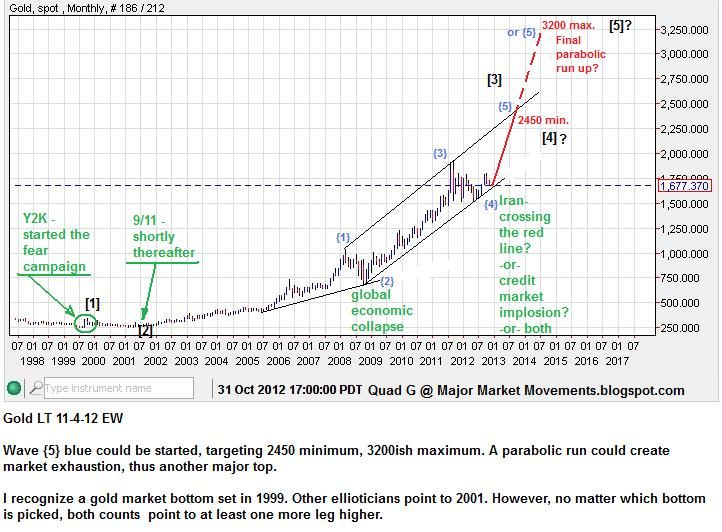
It's been a long while since I updated my long term wave count. I currently suspect that wave {4}blue is finished and wave {5}blue is about to take off. Because of the length of wave {4}blue in time, the count changes slightly, wave {5} may actually only complete larger wave [3]black in 2013. This means that after one more size-able correction for wave [4]black, one more parabolic run may occur to finish wave [5] black, possibly in 2015-2016:
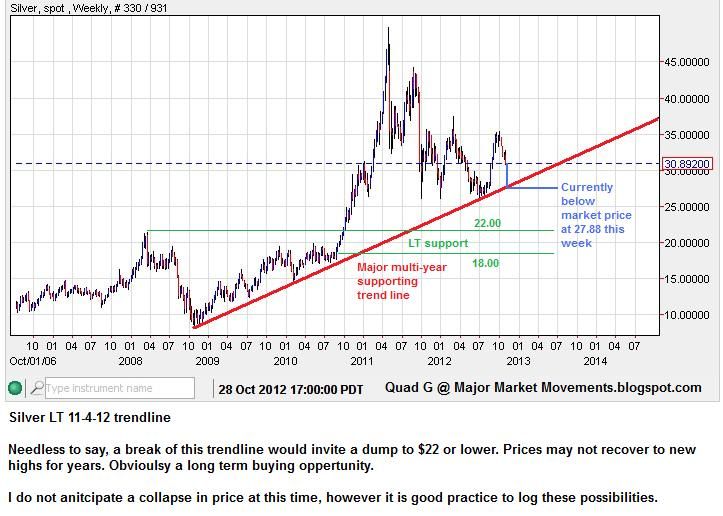
Silver - Is likely working on one more leg to the downside to finish it's handle of the CnH I outlined last week, and the completion of wave {E} of wave {4} triangle:
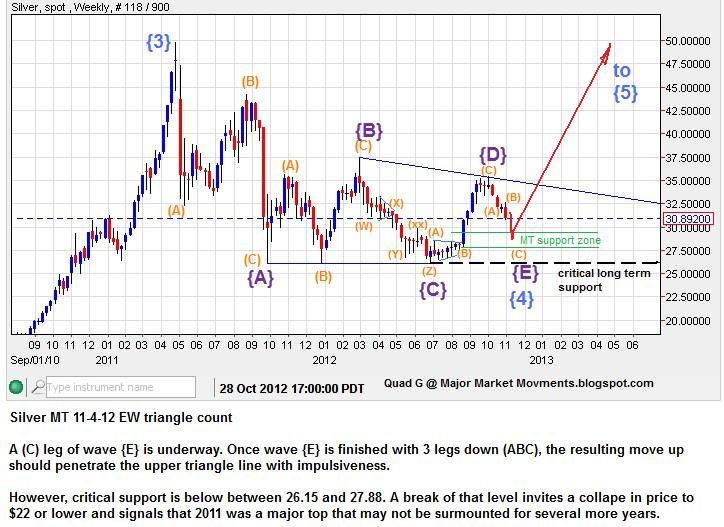
Keep in mind the long term multi-year supporting trendline (red). If this trendline fails, price could collapse down to $18-22. If this is indeed a bullish market, buyers would likely be using this major trendline as a back stop to project prices higher. If the buyers do not show up, this trendline is likely to be trampled:
Corn - An anonymous poster asked about corn prices. I think one more leg down could be seen soon, to test a major support/resistance area. My probabilities suggest that a touch of 670ish could be a 'kiss good-bye'. A weekly close below that level would suggest that buyers are not in control, leading to further selling:
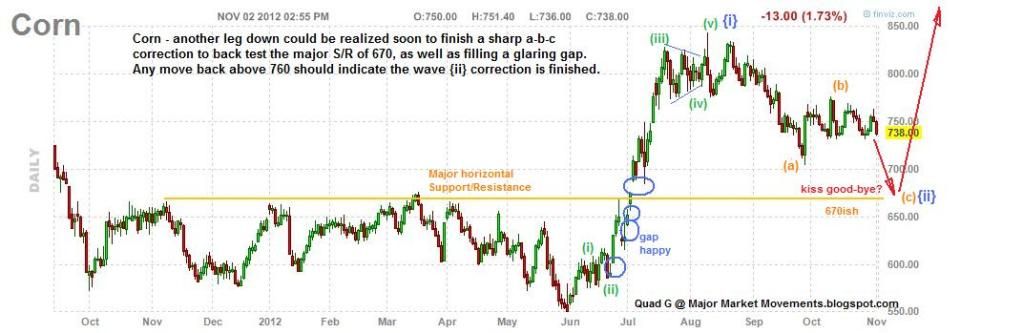
(click on chart for full view)
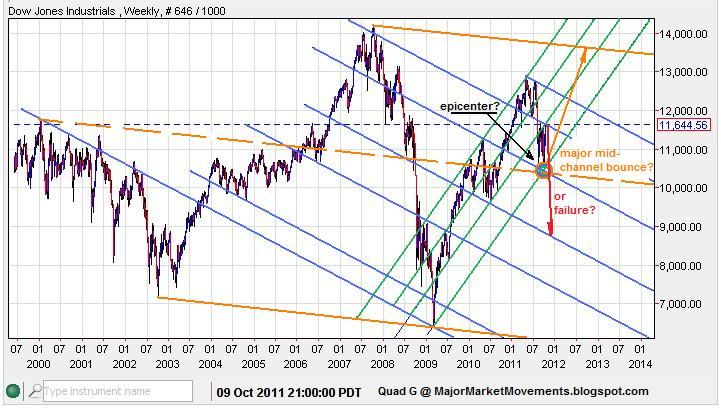
Dow - Luvtub asked for an update for the S&P500. I prefer to use the Dow at this time to depict my overall view of the stock market. The S&P movement can roughly be extrapolated. Over a year ago, I suggested that stocks were at a major cross-roads with a confluence of multiple trend-lines forming an 'epicenter'. A decisive bounce occurred back above 12,000, which led me to favor a move up to a resistance zone of 13,400 to 13,7xx to be hit in October 2012:
The updated outcome:
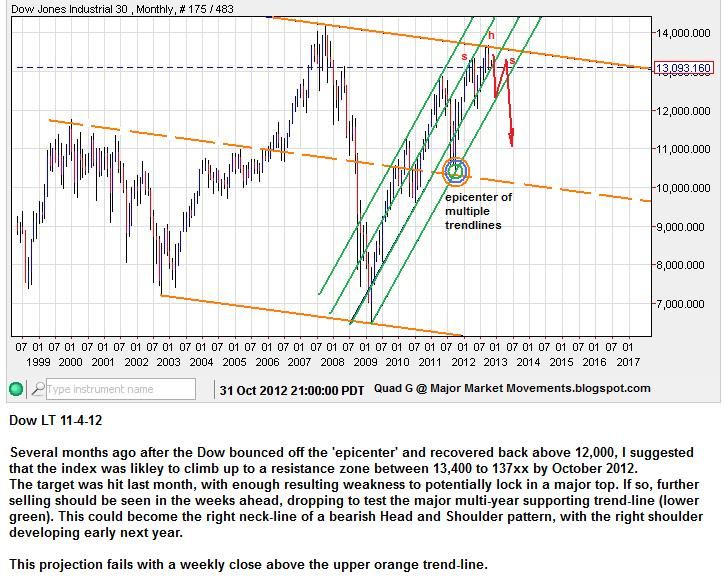
The target was hit in October as expected. Now, yet again, we face the potential for a major top in this market, but the index must remain below the upper orange trend-line.
All the best to you this week!