Sunday, November 25, 2012

MMM Weekend Update 11-25-12

Gold - Another important long term moving average that has provided major support is the 60 Week Moving Average (WMA). There has only been two times in which the 60WMA has been broken since the run up from 2001. These breaks have defined two major corrections. If price recovers and regains a foothold back above the 60WMA, then another impulse is possibly in play. The next impulse in this series is most likely to be a blow-off top 5th wave, easily 2400 with a good chance of 3200+


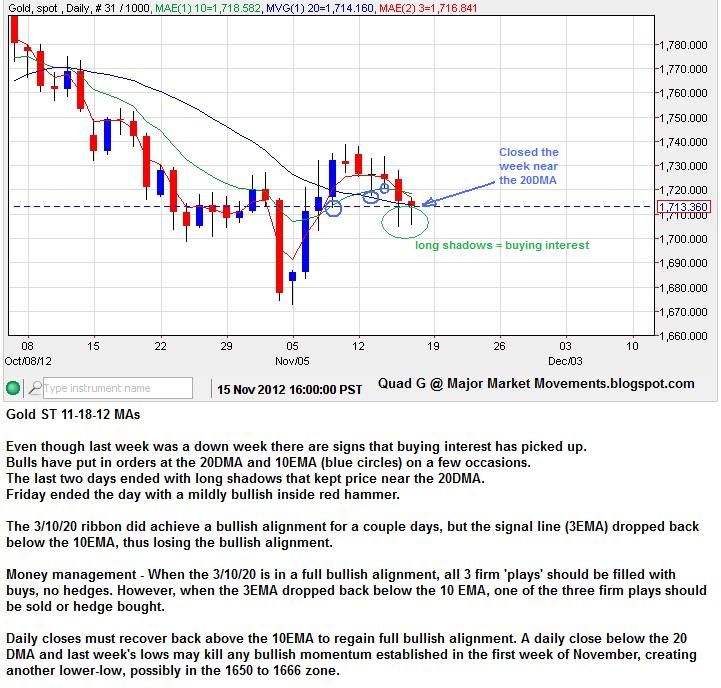
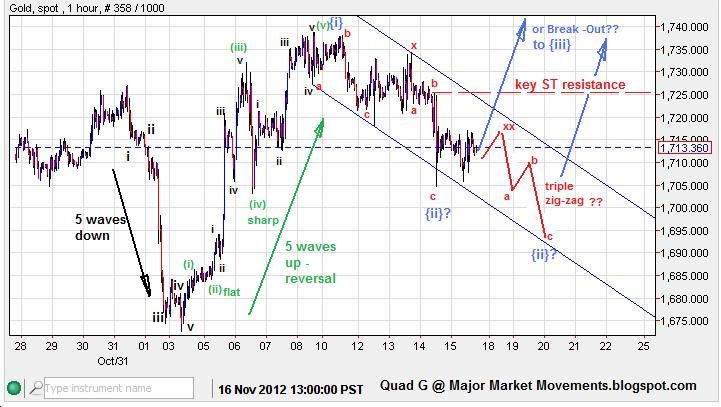
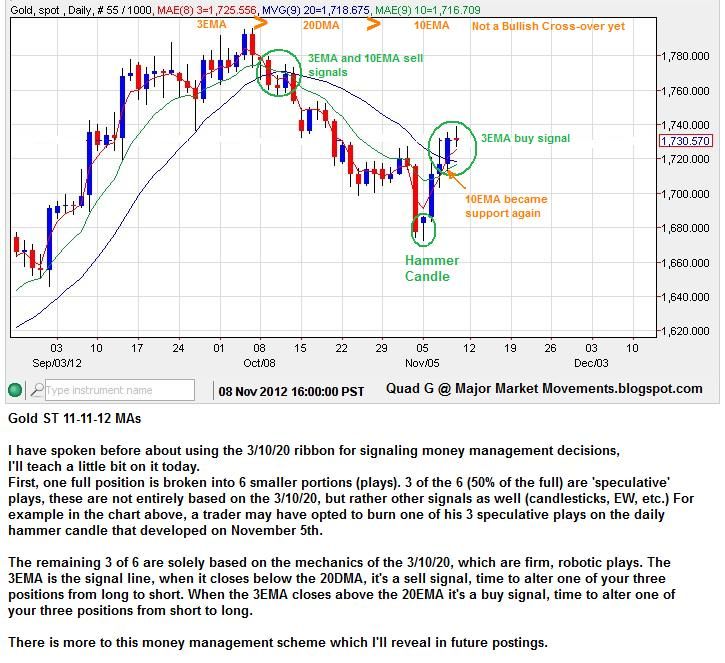
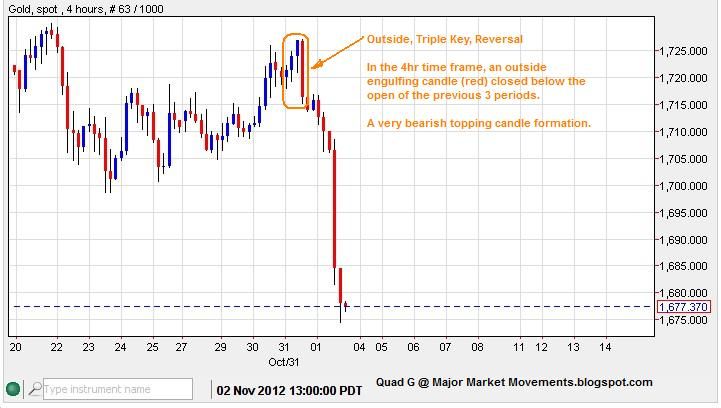
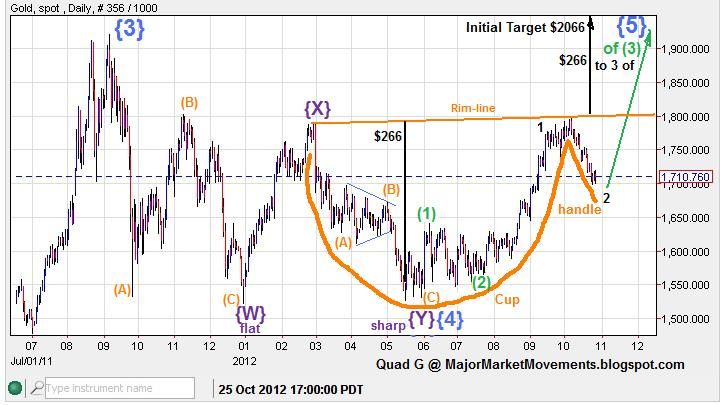
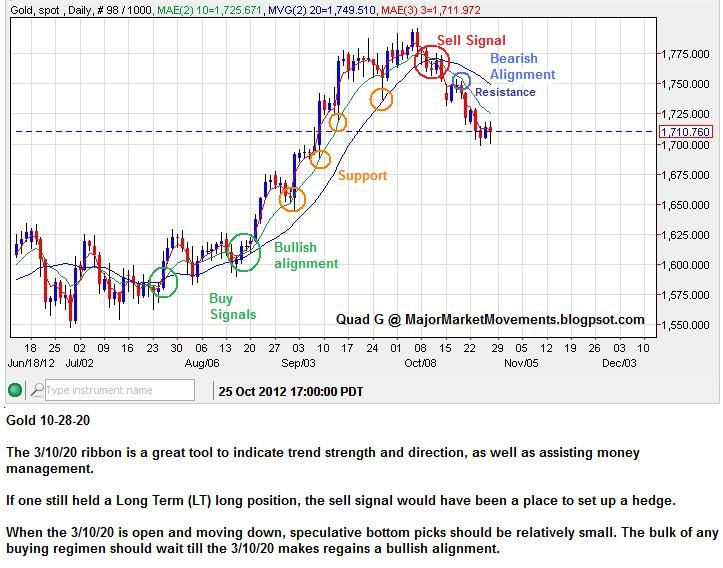
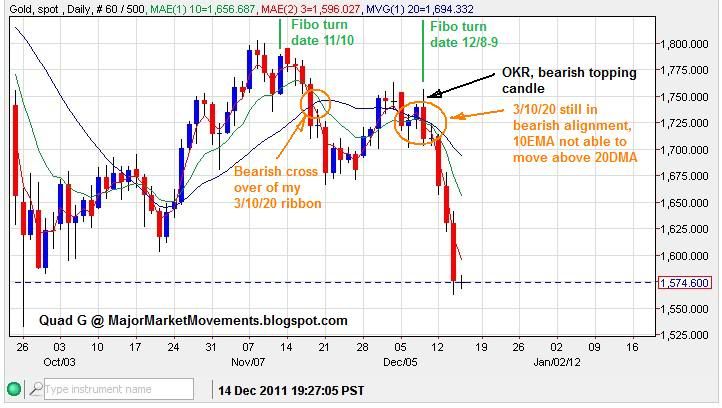
The 3/10/20 ribbon is 'Wide-Open' to the upside. As you can see the 10EMA and 20DMA have become support on a intra-day and closing basis. Continued impulsing to the upside should continue to use these MAs for support.


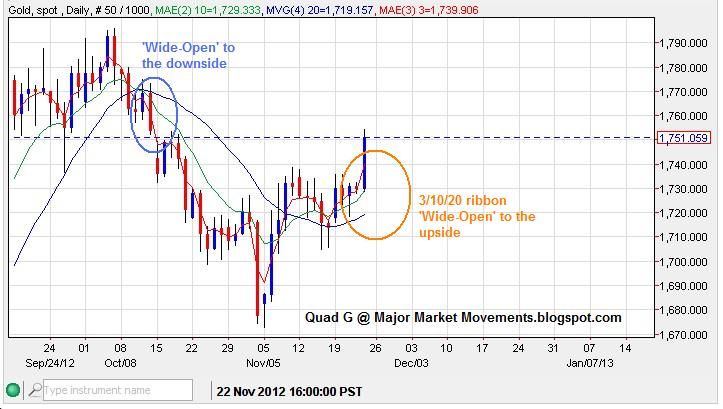
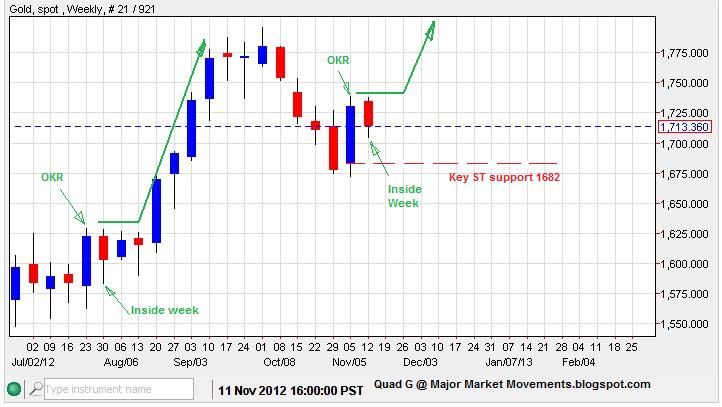
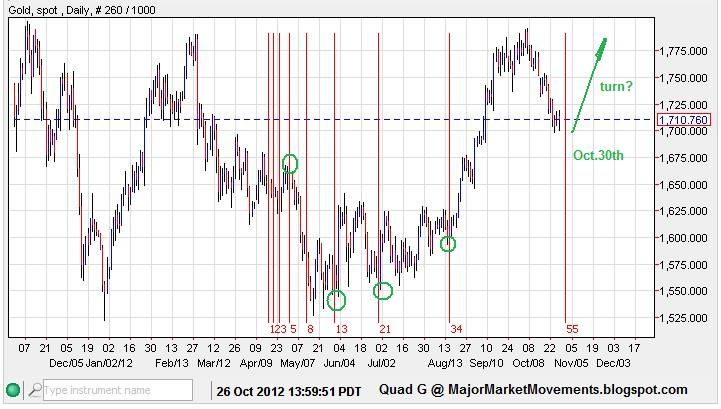
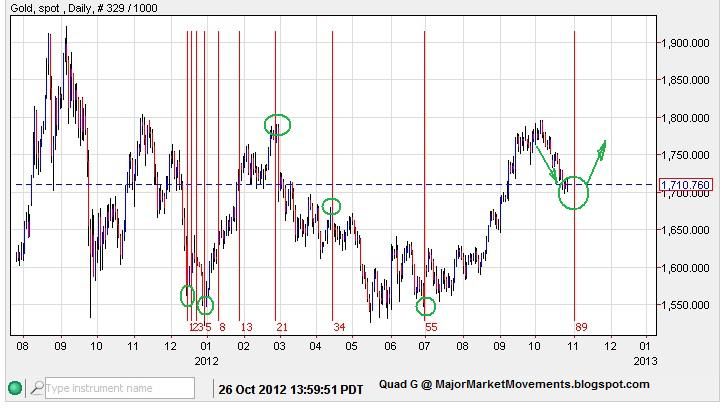
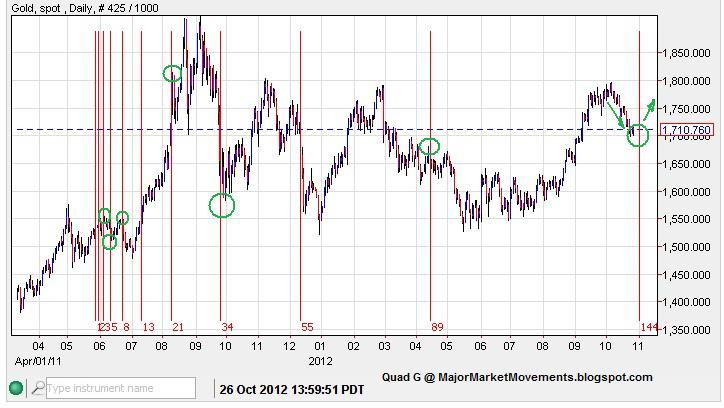
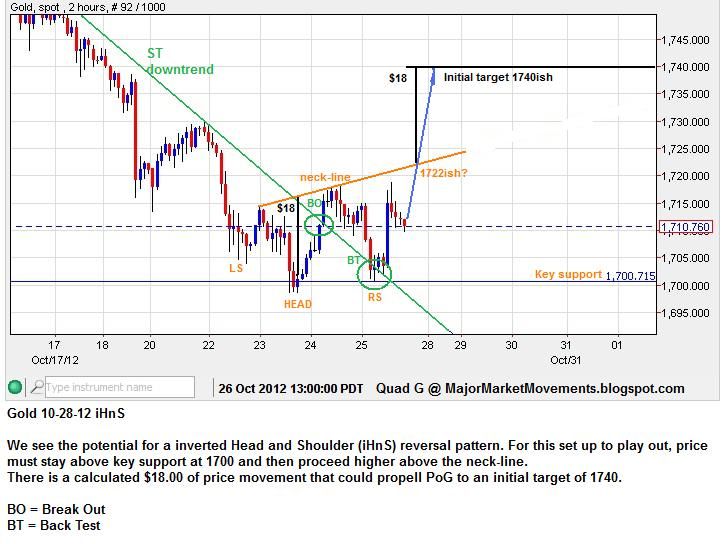
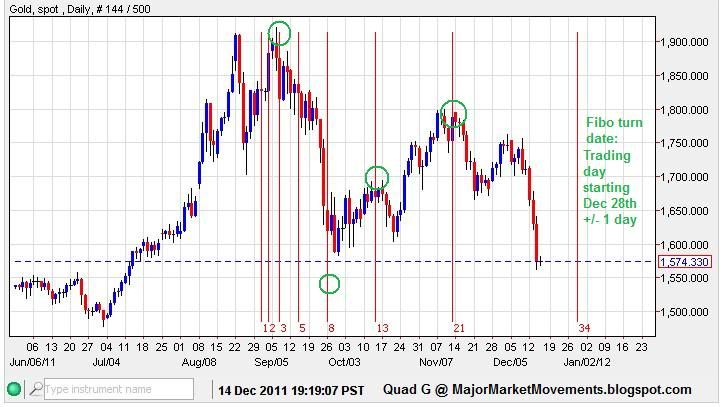
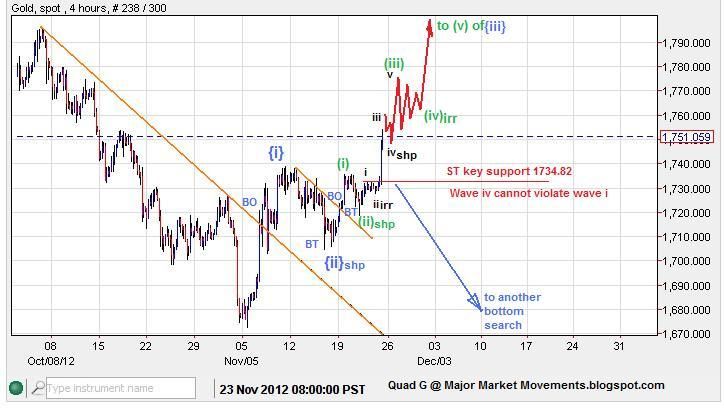
The ST Elliot Wave (EW) count suggests a 'third of a third' 'point of recognition' could be underway. Key support for such a move is 1734.80.


------------------------------------------------------------------------------------

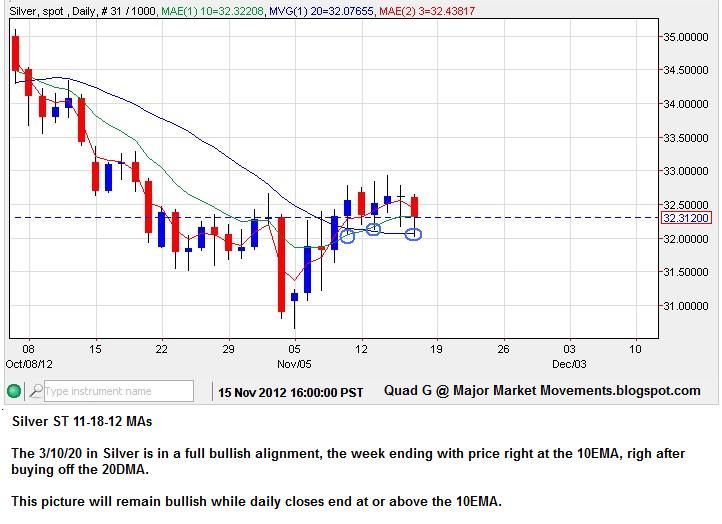
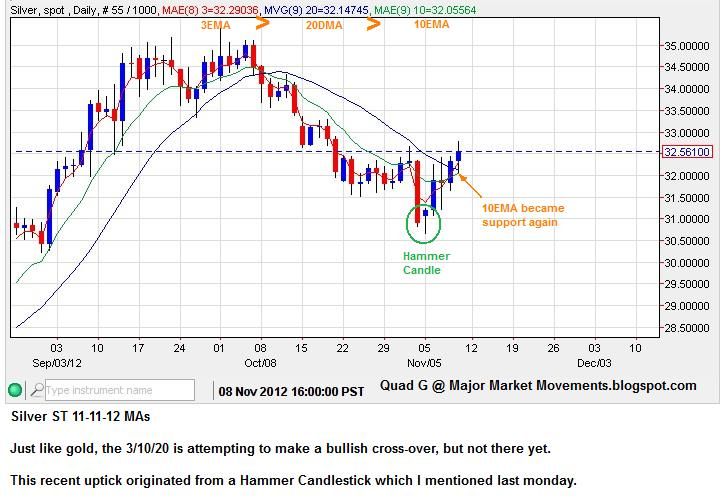
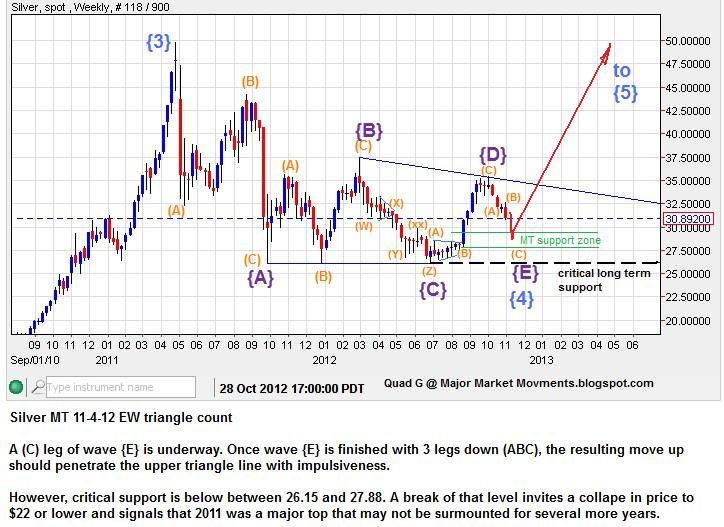
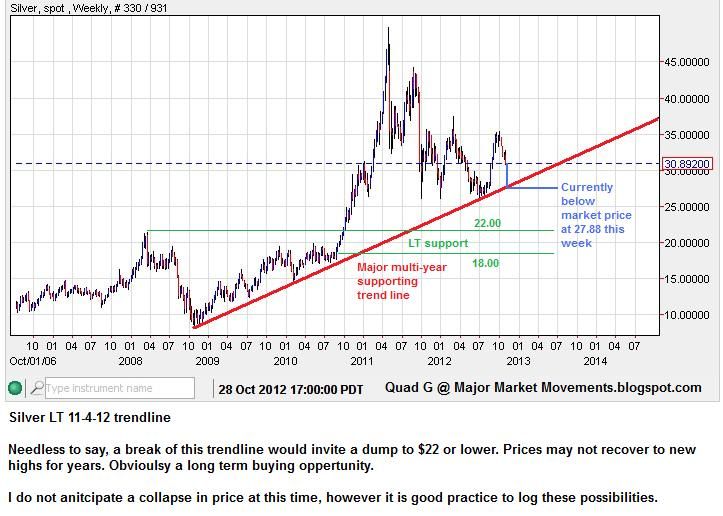
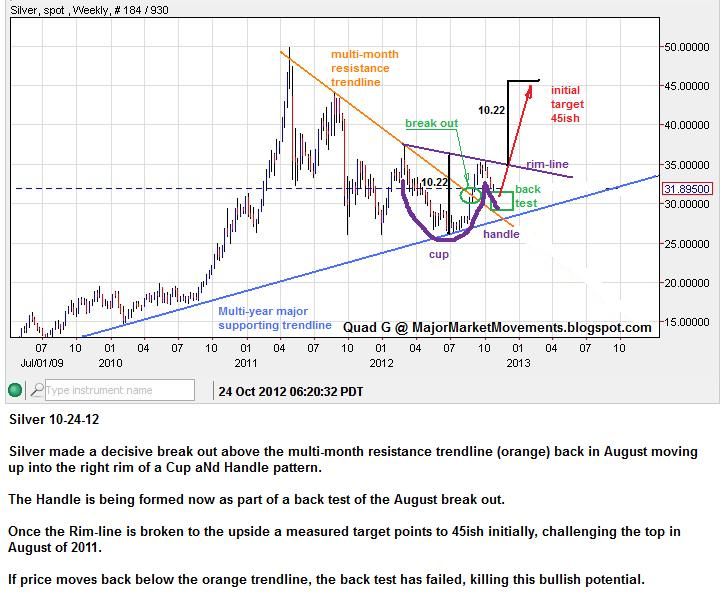
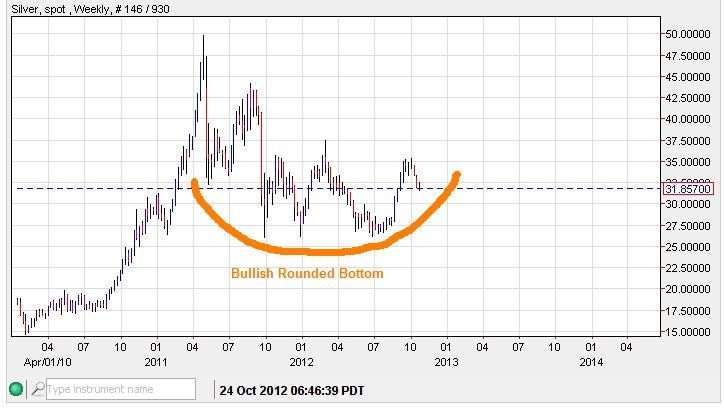
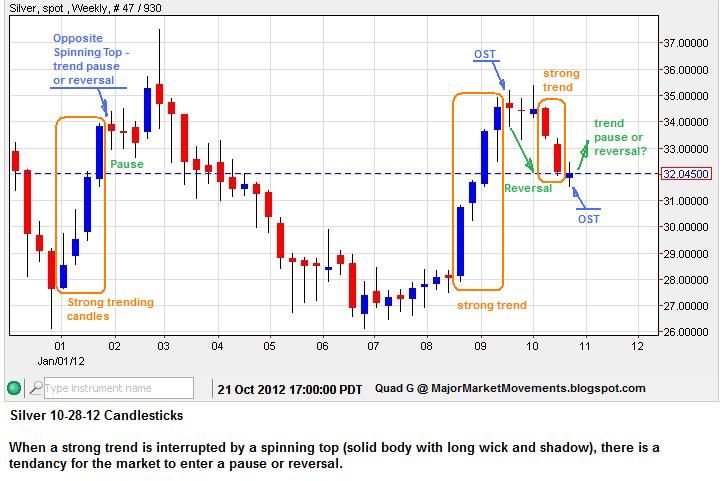
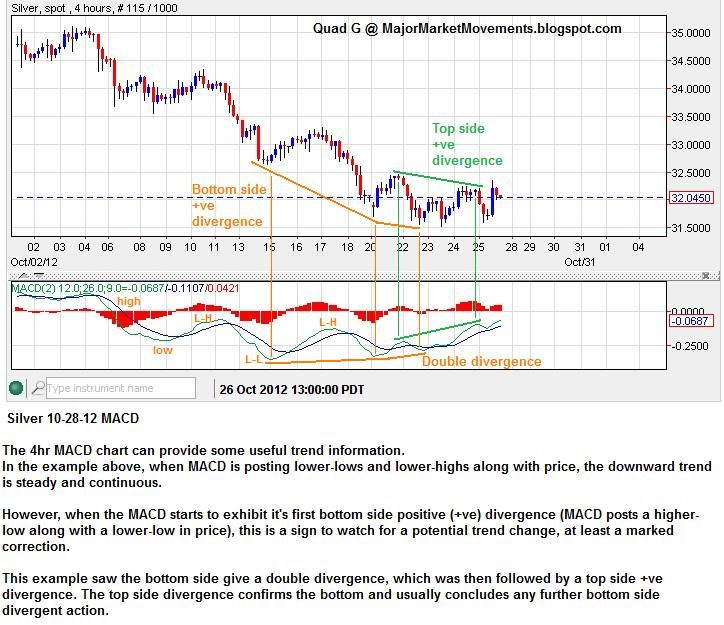
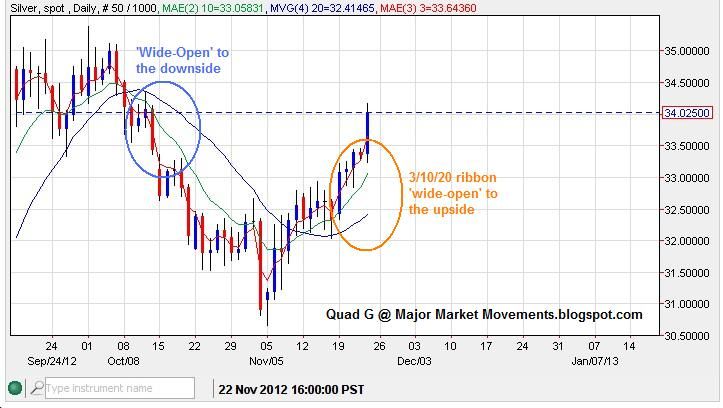
Silver - Last week I posted that if 33.00 was breached a pop up to 35+ was likely. Here is the reasoning for the target:


The 3/10/20 ribbon is also 'Wide-Open' for silver, an indication of impulsive action.


------------------------------------------------------------------------------------

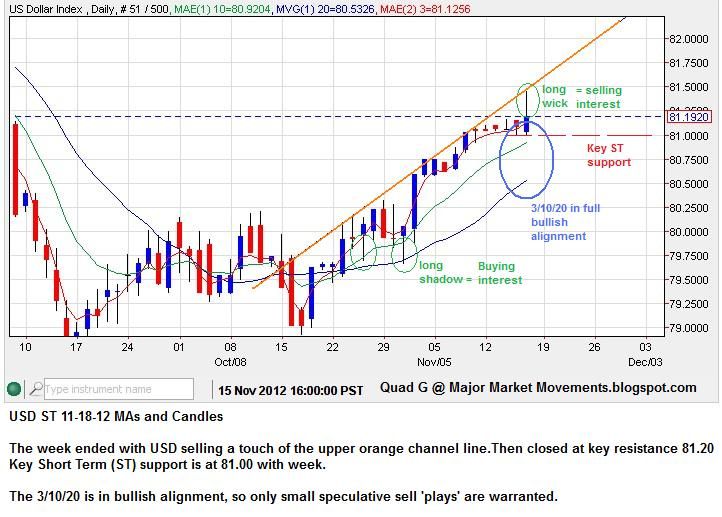
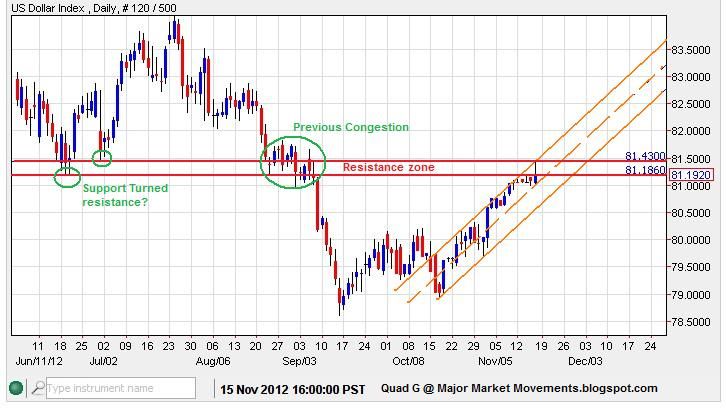
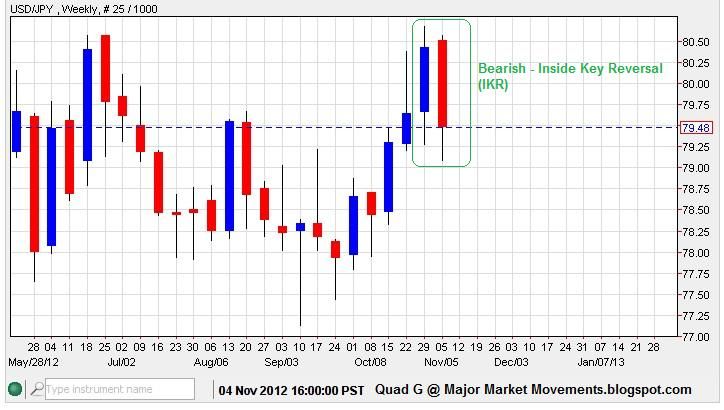
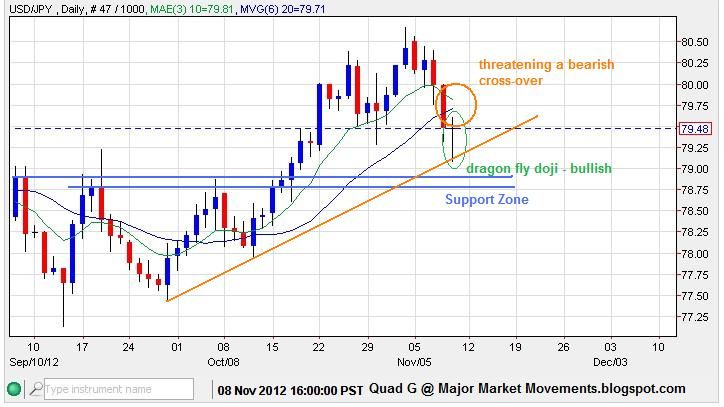
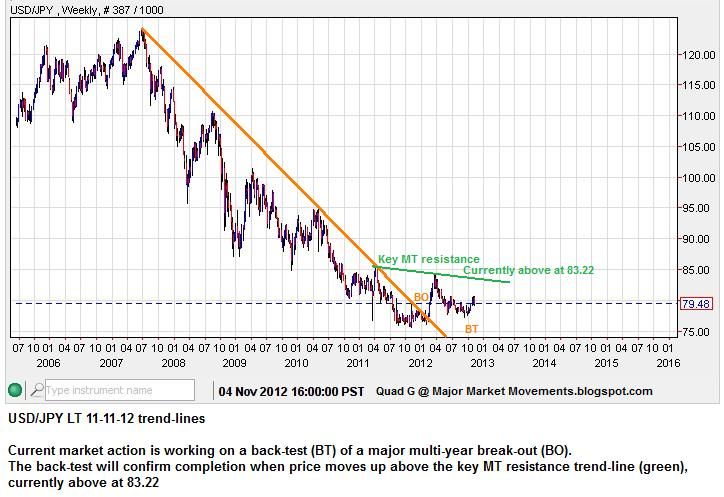
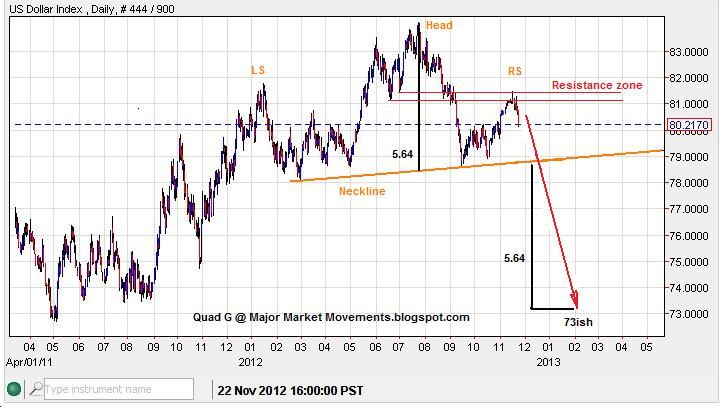
USD - I suggested last week that a top could be in place, a resultant slide took place this week. It's possible that a significant right shoulder of a bearish HnS could be finished. A break of the neckline near 78.80ish could create a tumble down to 73ish as an initial target.


------------------------------------------------------------------------------------

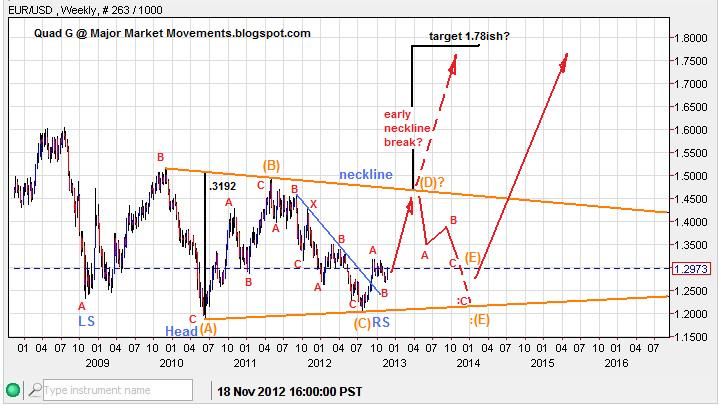
EUR/USD - I posted this chart back in May at Kitco. A bearish EW count mixed with a Bullish iHnS:


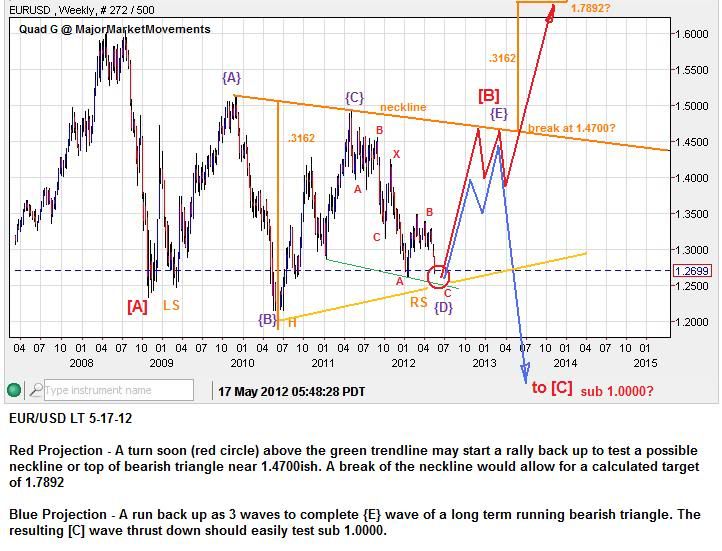
The Update adds an alternate bullish EW count. Critical Support for the Bull case is 1.2042, Critical Resistance for the Bear case is 1.4940. Both counts support an upward move over the next several weeks to test the upper triangle boundary.


------------------------------------------------------------------------------------

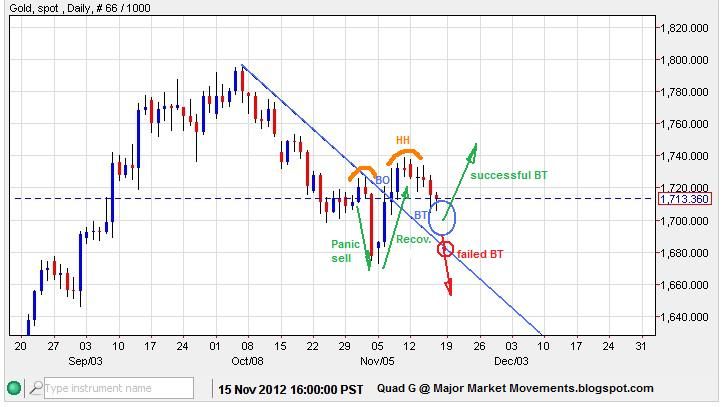
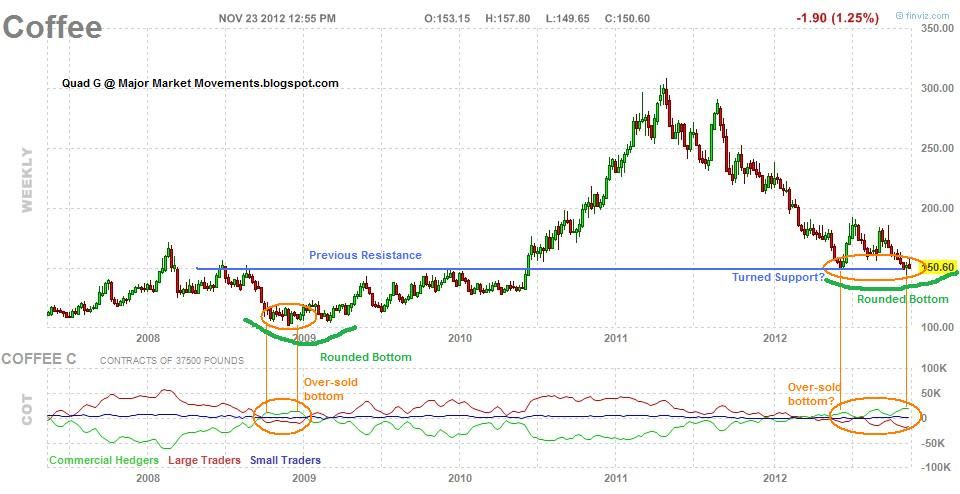
Coffee - I've been looking for some bottoming action is this market for some time. We may have seen it last week with a gap up and Break-Out (BO) followed by a choppy downward Back-Test (BT) and back-fill of the previous gap up. Price and volume are at odds, thus printing a +ve divergence.


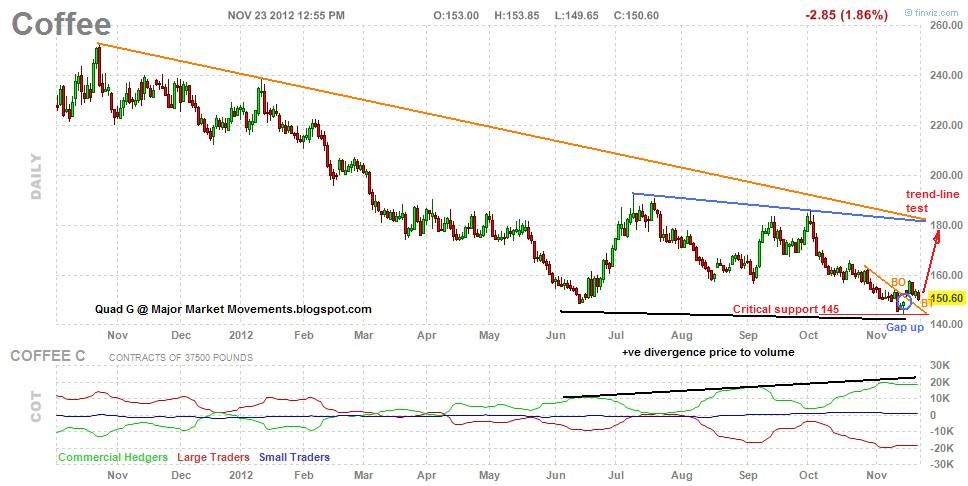
If 145 holds as support, I suspect that an upward move will test ST and MT resistive trend-lines above. Long term horizontal support is around 150ish. CoT data also suggests Coffee is in a long term over-sold condition.


------------------------------------------------------------------------------------

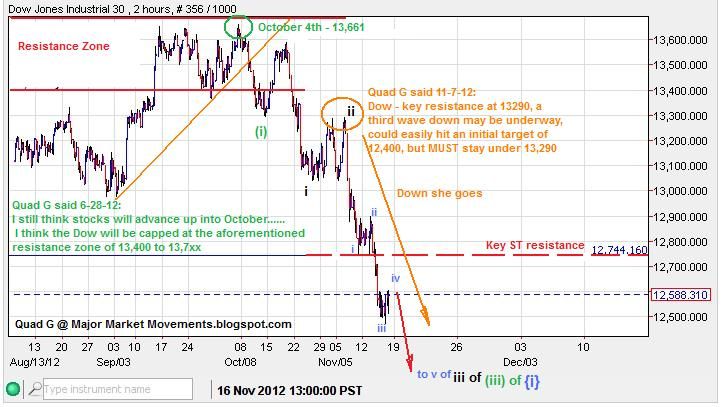
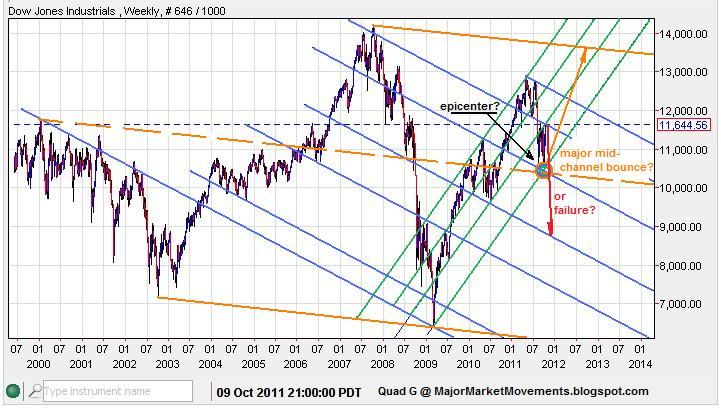
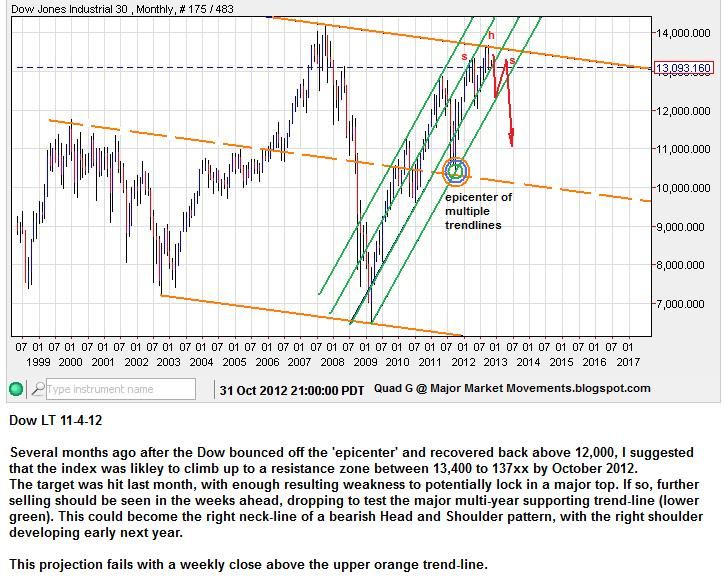
Dow - Broke above key ST resistance at 12,744 so the previous ST count is dead. Key ST resistance this week is 13,040, just a few points higher.

------------------------------------------------------------------------------------

Palladium - Key support moved up to 630.

Platinum - on a breakout last week, key support moved up to 1585.

Copper - Key support at 3.49

------------------------------------------------------------------------------------

A few of you expressed your support for my work here on this blog. Your gestures are certainly noticed and appreciated, Thanks.

Sunday, November 18, 2012

MMM Weekend Update 11-18-12

Gold - Last week posted an inside week for gold, appearing as a choppy corrective move to the downside.


PoG was likely working on the back test of the previous break-out:


This has occurred in the past with bullish results:


The 3/10/20 ribbon is currently in a 'neutral' position with the 3EMA moving back below the 10EMA:


The Short Term (ST) Elliot Wave (EW) picture still shows Bullish potential as price moves down in a choppy manner after a 5 wave impulse reversal:


Critical support is still 1672 to 1682. Moves below this level invites a test of a support zone between 1650 to 1666.

-------------------------------------------------------------------------------------

Silver - Has moved into a full bullish alignment of the 3/10/20 ribbon:


30.66 to 31.06 is critical support. I suspect that once 33.00 is breached, a pop up to 35+ is likely in the ST. All part of a MT move up to 45ish.

-------------------------------------------------------------------------------------

USD - Felt the effects of resistance near 81.20ish:


Zooming out, we see the USD tangling with previous support that has now formed resistance:


-------------------------------------------------------------------------------------

USD/JPY - The chart picture last week had some conflicting, bullish/bearish indicators. However the bull side come out on top:


-------------------------------------------------------------------------------------

Dow - 3rd wave down reached 'point of recognition':


The lower green trend-line is very probable target to finish the right neckline, below at 12,124ish:


-------------------------------------------------------------------------------------

Palladium - Has bullish potential above 600, could challenge 700+ fairly soon. In the ST, Pall becomes bearish below 600.

-------------------------------------------------------------------------------------

Wheat - Broke down through the triangle formation which is bullish and bearish. Bullish because the next wave higher is less likely to be 'terminal'. Bearish because price will have to seek out a lower level of support, $8.00 sticks out as very probable.

Corn - may have one more small leg lower to 670 to 700 finish this multi-month correction. Any move in the ST back above 755 confirms the end of this current correction.

Soybeans - Is done or nearly done with it's multi-month correction. A quick move higher back above 1430 should lock in a MT bottom with upside target of 1800+. Any further selling on strong volumes below 1310ish kills great sums of bullish potential.

-------------------------------------------------------------------------------------

That's all for now.

For free email updates, sign up in the right side column with the 'Follow by email' widget.


...


Sunday, November 11, 2012

MMM Weekend Update 11-11-12


Gold - Price gave a bullish MT signal with a Outside double Key Reversal on the weekly chart:


This is likely to cause additional MT bullishness in price as long as next week's close remains above 1682.26

Outside Key Reversals can be very strong signals, especially on a weekly time frame:


Though the week ended very bullish, the 3/10/20 ribbon has not made a bullish cross-over yet:


If PoG falls back this week, another opportunity for a speculative bid may present itself, using 1682 as an important back-stop to gauge risk.

-------------------------------------------------------------------------------------

Silver - Very similar to Gold with nearly identical moves:


-------------------------------------------------------------------------------------

USD/JPY - Weekly and daily indicators conflict with one another. On the weekly chart an Inside Key Reversal presents a bearish picture while price is below last week's open at 80.51


An IKR is not as strong as an OKR, but is still formidable.

The daily chart suggests price could be back testing some key support areas. The dragon-fly doji on Friday suggests a ST bottom may be forming:


The long term picture is still in the process of forming a major bottom while price remains below key MT resistance currently above at 83.22:


-------------------------------------------------------------------------------------

Wheat - Nearing the final stages of this multi-month correction. One more wave down may be seen this week completing the final wave (e) of a contracting triangle:


-------------------------------------------------------------------------------------

USD - At a crucial point sandwiched between key resistance at 81.20 and key support at 80.60

-------------------------------------------------------------------------------------

Ya'll have good week,
QG

Sunday, November 4, 2012

MMM Weekend Update 11-4-12


Gold - Stayed below the neckline of the iHnS that I posted last week, and then fell through key support at 1709 which I mentioned at Kitco. The break of support created a collapse in price. Though the sudden drop was scary looking, I do not yet see a reason to panic.

I need to point out a very bearish candle stick formation that reared it's ugly head on Thursday. Unfortunately I did not see it for myself until Friday:


A single outside key reversal is powerful enough to indicate a turn. But a triple key reversal is even more powerful as you can clearly see.

The October 30th-31st fibo turn window did indeed create a turn, but certainly not what I had anticipated.

Blister reminded me of the 144 daily moving average(DMA)that has served as support many times while gold was in a MT impulsive mood. That moving average may yet again play a role if gold is indeed making a major bottom with strong upward moves again. Currently the 144DMA is below at about 1650ish:


It's been a long while since I updated my long term wave count. I currently suspect that wave {4}blue is finished and wave {5}blue is about to take off. Because of the length of wave {4}blue in time, the count changes slightly, wave {5} may actually only complete larger wave [3]black in 2013. This means that after one more size-able correction for wave [4]black, one more parabolic run may occur to finish wave [5] black, possibly in 2015-2016:


Silver - Is likely working on one more leg to the downside to finish it's handle of the CnH I outlined last week, and the completion of wave {E} of wave {4} triangle:


Keep in mind the long term multi-year supporting trendline (red). If this trendline fails, price could collapse down to $18-22. If this is indeed a bullish market, buyers would likely be using this major trendline as a back stop to project prices higher. If the buyers do not show up, this trendline is likely to be trampled:


Corn - An anonymous poster asked about corn prices. I think one more leg down could be seen soon, to test a major support/resistance area. My probabilities suggest that a touch of 670ish could be a 'kiss good-bye'. A weekly close below that level would suggest that buyers are not in control, leading to further selling:

(click on chart for full view)

Dow - Luvtub asked for an update for the S&P500. I prefer to use the Dow at this time to depict my overall view of the stock market. The S&P movement can roughly be extrapolated. Over a year ago, I suggested that stocks were at a major cross-roads with a confluence of multiple trend-lines forming an 'epicenter'. A decisive bounce occurred back above 12,000, which led me to favor a move up to a resistance zone of 13,400 to 13,7xx to be hit in October 2012:


The updated outcome:


The target was hit in October as expected. Now, yet again, we face the potential for a major top in this market, but the index must remain below the upper orange trend-line.

All the best to you this week!


Sunday, October 28, 2012

Weekend Report - Gold and Silver


Hey All!

Back in the saddle again! I'm likely to have a good niche of time on the weekends to produce reports here on the blog, complete with charts. I'll still keep a presence over at www.kitcomm.com , chiefly at my thread Major Market Movements www.kitcomm.com/showthread.php?t=41880

You are welcome to leave questions and comments here, but I will not likely respond until the following weekend.

Gold and silver appear to be poised for a trend change soon. The past few weeks have shown some trepidation, possibly due to the uncertainties surrounding the upcoming elections. I suspect long term (LT) speculations will set in, producing a good sized trend after the elections are finalized.

Gold has a series of fibo turn dates coming up on the 30th and 31st this week, which also roughly correlates to a full moon on the 29th:


A turn this week could complete a bullish Cup and Handle (CnH) pattern with a projected target of 2066, which coincidentally, is also double the 2008 high of 1032:


In the short term (ST) gold may have formed a bullish iHnS, as part of a break out (BO) and back test (BT):


Even though Gold has some potential bullish behavior ahead, it's prudent to regard the 3/10/20 ribbon which is still in a bearish alignment:


------------------------------------------------------------------------------------

Silver of course is in the same boat as Gold for the most part, displaying some of it's own bullish patterns.

Silver is also posting a (CnH) as part of a break out and back test:


Which is all part of a very bullish rounded bottom that has formed over the last several months:


Candlesticks on the weekly silver chart shows a unique combination:


The 4hr MACD chart often provides some clues regarding mid term (MT) trend changes:


My primary focus will remain gold and silver, but I do enjoy watching other markets as well. If you have a particular interest in other markets please make a request known and I will do my best to comment and post related charts next week.

Have a good week folks!


Thursday, December 15, 2011

Gold and Silver - Update 12/15/11

Hello All! I caught a break and decided to furnish an update on my favorite markets - Gold and Silver. Life for me has changed significantly, for the better. However, in so doing, I don't have the time for this blog or other pursuits. I'll chime in from time to time, but such visits will likely be few, far between and limited in scope.

The blogging experience has been enjoyable. I can see that with all the content I would like to deliver, this endeavor could easily become a full time gig to do it right. However at this time, I have much more important and meaningful duties that demand my attention.

Gold - This latest sell-off was well anticipated. Using the technical tools that I have taught on these pages most certainly indicated a turn and coming weakness.
First the Fibonacci Time measurements did another terrific job! Spot on again!
The turn dates that I have mentioned previously Nov. 10th and Dec. 8th-9th both produced highs. Using the Fibonacci Time Zone tool on NetDania here is how I derived the two turn dates, it's easy to do, try it yourself.

Nov 10th:


Dec. 8th-9th:


Having worked with this tool for a few months I have established a some rules:
1) Must measure off at least TWO previous turns, the more turns that are connected the better the result.
2) A trend of at least 7 trading days must move up or down into the turn date.
3) The turn can be the top of the trend or back test of the trend.
4) Daily measures are generally less significant in strength than weekly. Measured turns on a daily chart may only produce a trend that lasts a few weeks, while measures on the weekly chart could initiate trends that last months.
5) Dates must be given a window of +/- 1 trading day.

I also noticed that the Nov. 10th and Dec. 8th turns fell on or near Full Moons, with Dec. 8th being a rare lunar eclipse. This may have influenced the strength of the turn dates. Recognition goes to Antimagnetic for his previous eclipse work and it's affects on the Gold market.

Another Fibo date I recently measured in the daily time frame is on the horizon:

Dec. 28th:


The 28th also coincides with a weekly fibo turn date that pointed to the last week of December. This could be a good place in time to watch for a potential major bottom.

I have also taught the 3/10/20 ribbon and Japanese candle sticks. If these two were being watched, a bearish warning would have been observed:


A channel line analysis also displayed bearish trouble:


Also a bearish Head and Shoulder pattern suggesting a top was near, giving a potential initial target of 1534:


With this information I sold some of my gold stack near the Nov. 10th date and the Dec. 8th date, averaging out between 1750 and 1800. I will now be looking to load up some silver on this dip over the next few weeks. I previously mentioned that I was looking for the GSR (Gold to Silver Ratio) to make a move higher toward 57-60. we reached 55.60ish on a intra-day basis yesterday. If the ratio stays above 52.37, I think the 57 to 60 zone could be reached soon:


Once 52.37 is broken, I think the top of the GSR with be locked in and the journey toward 16 will begin. Silver will obviously be the better performer, thus the reason that I am selling some of my gold stack to buoy the silver stack at this high GSR.

I think Gold could move down a bit more, possibly making a lower-low below 1532. I suspect that this correction is a large degree similar to 2008, but only a 4th wave. If PoG recovers impulsively back above 1666 anytime soon, I think a bottom could be locked in.

Silver - I think Silver could slip further to test 25ish and potentially 22. But at this time, if Silver recovers back above 33.70, I think a MT bottom will be locked in.

My long term view still has not changed: Gold to 2400+ and silver to 95+ possibly inside the next 8 months. I think this current move down is just pulling back the sling shot with 1920 gold and 50 silver as the pivot.

I also want to put in a plug for NetDania.com. They now have a fantastic smart phone app that is absolutely phenomenal. Go check it out!

Time has run out, gotta go. I am not 'back' by any means. I'll post again when I am able, but might be a few weeks. All the best to you! DYODD.


...