Many charts this weekend, much to consider because of last week's move. There is a fairly tight grouping of support that I'll show first:
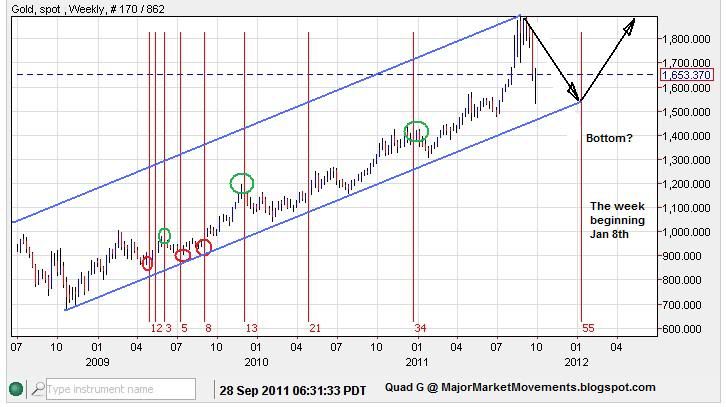
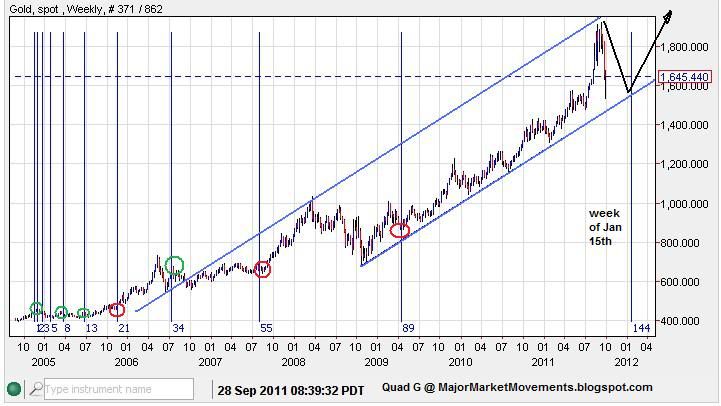
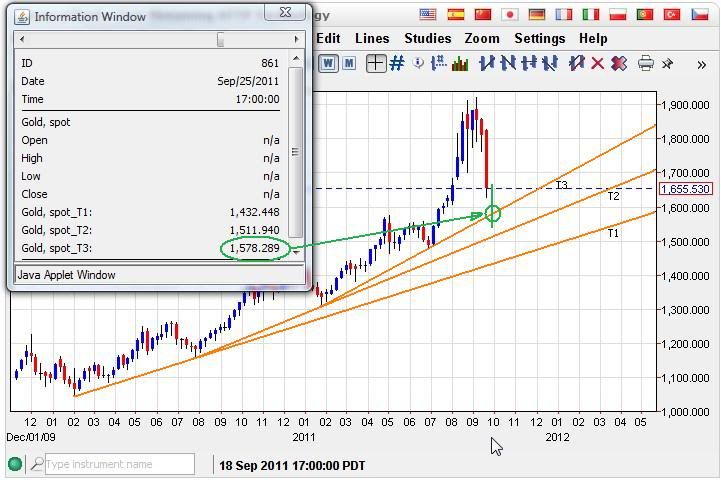
Previous charts have shown an increasing parabolic rise in supporting trend-lines. The foremost line is one to watch, which is near 1578 this week:
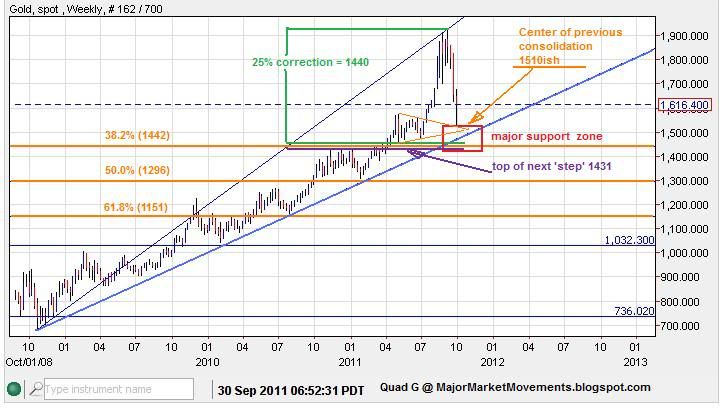
Gold has also produced a fairly consistent stair step in price from which investors have risked 2-3% above the previous step. Another test of the last step is likely underway. If investors are still in the mood to buy, they should be willing to risk another 1-3% above the previous step, providing a risk window of 1575 to 1622:
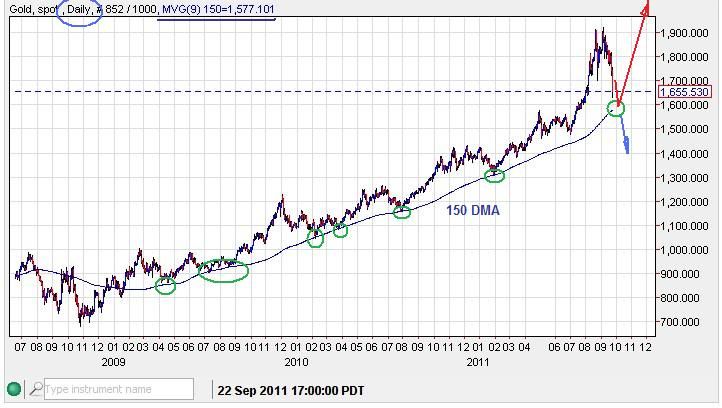
I have shown the long standing support at the 150DMA for the past couple years, which has now moved steadily upward to a support level of 1577:
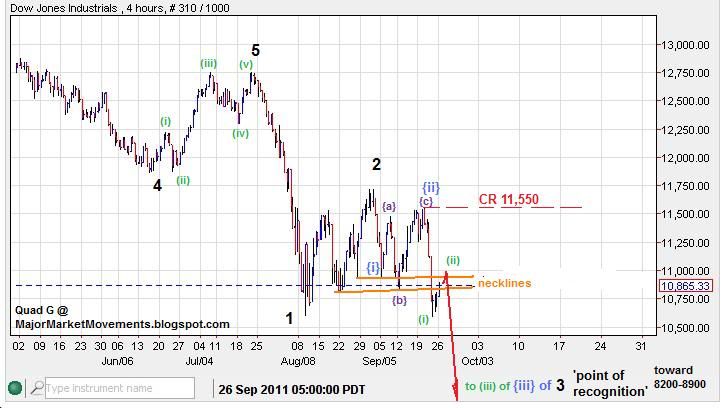
Looking at the MT EW count Wave (4)green can be counted as an irregular expanded flat which is filling in most of the 12-15% correction window for this degree of correction, same for wave(2) green. The bottom of the 15% range is at 1625ish:
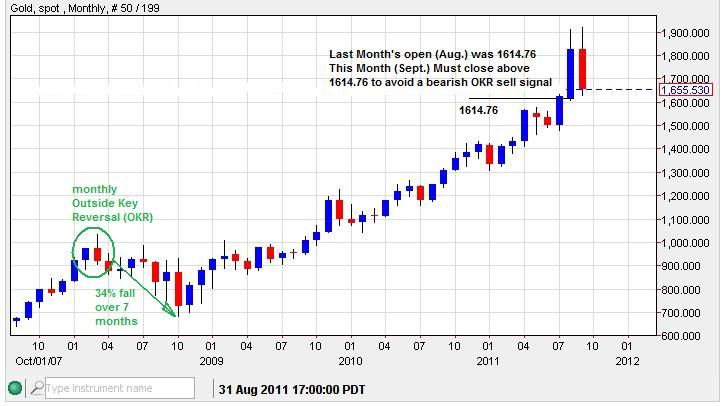
There is also a serious danger to further MT upside that could become obvious next week. If the Month of September closes below the Opening price in August (1614.76), a very bearish Outside Key Reversal (OKR) will be printed. The same occurred in 2008 which was followed by a 34% major correction for 7 months from the 1032 top in March 2008. Such a move would be a major sell signal for many investors. An intra-month fall through 1614.76 is acceptable this week, but the month MUST close above 1614.76, friday the 30th to avoid this bearish signal. Here is the chart:
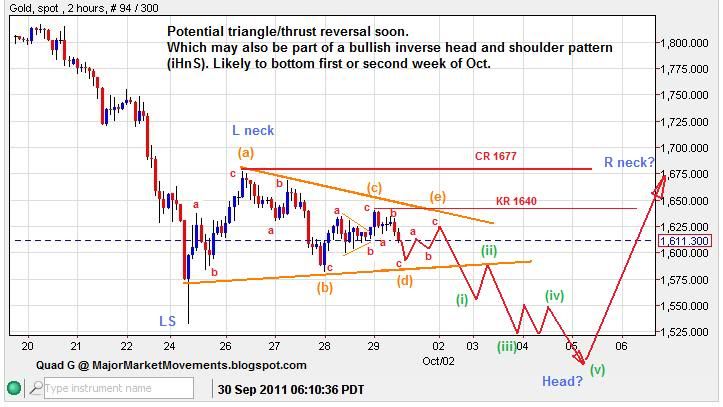
The action on Friday did see an end of day bounce after filling in a very thinly traded area between between 1632 and 1638, then finished the day back above the sloping trend-line connecting the previous 2 ST bottoms. This shows that there is some degree of buying interest at these levels:
Also, Friday closed the day about $55 below the lower Bollinger Band (BB). This was the second day of closing below the band. One more day is possible on Monday, then chances are very good that price will rise back into the BBs again for at least a ST bounce. The 3/10/20 clearly in a bearish alignment and will remain that way with daily closes below the 10EMA (currently 1770):
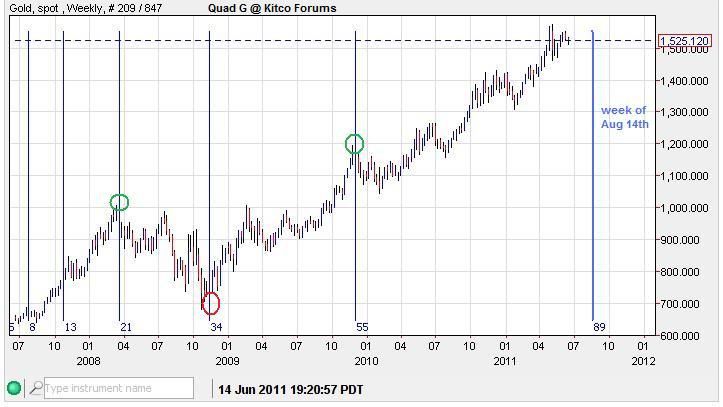
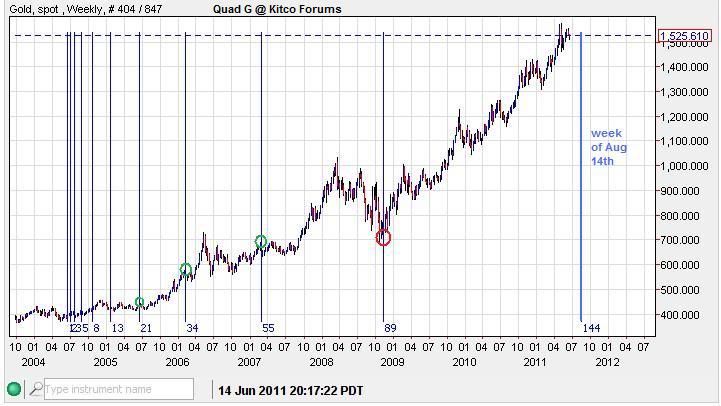
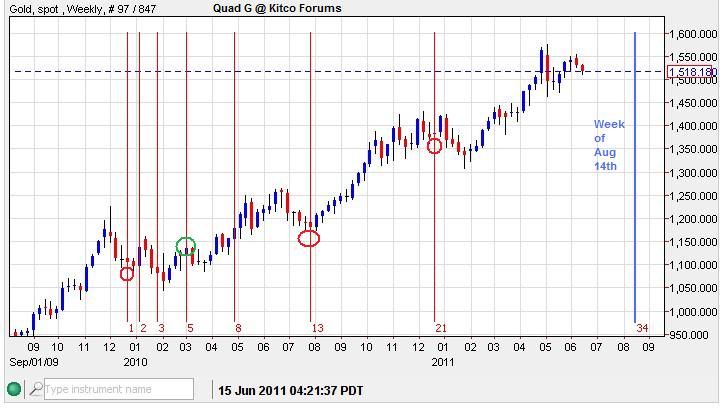
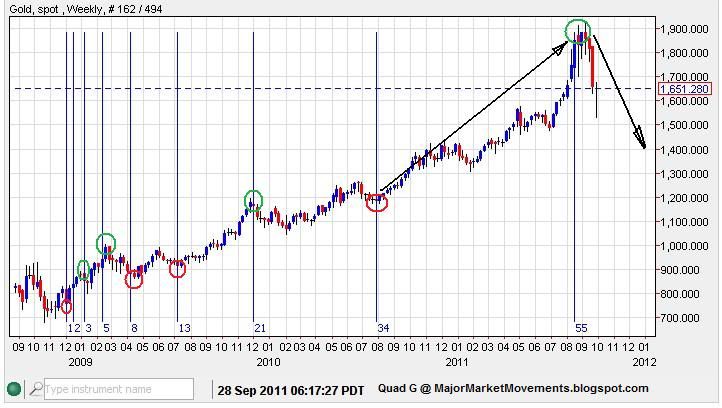
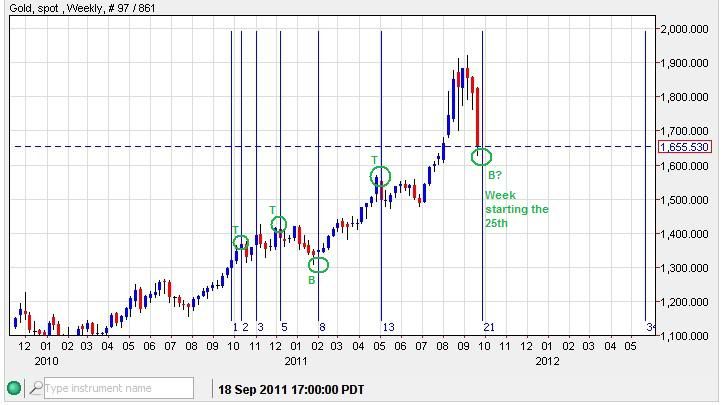
A weekly time fibo points to next week as a possible bottom. This would coincide with options expiry, futures expiry, a new moon and a minor Bradley turn date on the 26th:
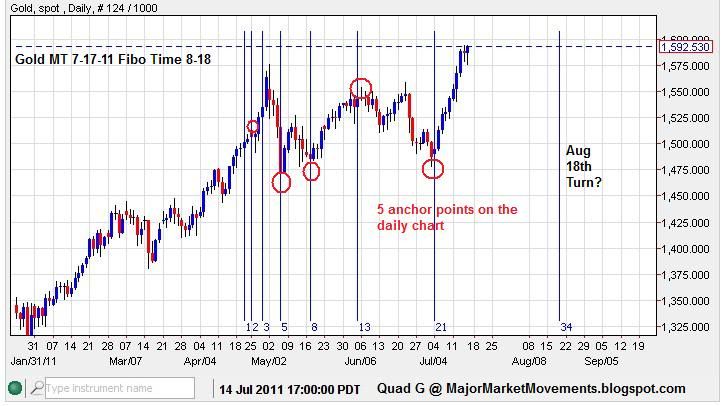
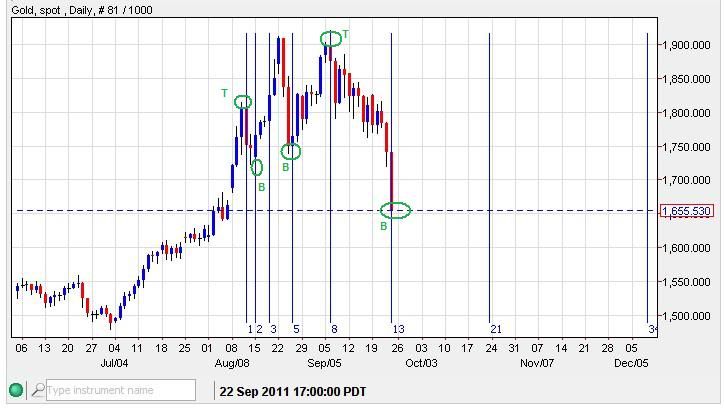
The daily time fibo also shows a potential turn early this week. A dead cat bounce as a minimum. Daily fibo turns are given +/- 1 day of window, end of day Monday the 26th should close the window:
In A Nut Shell:
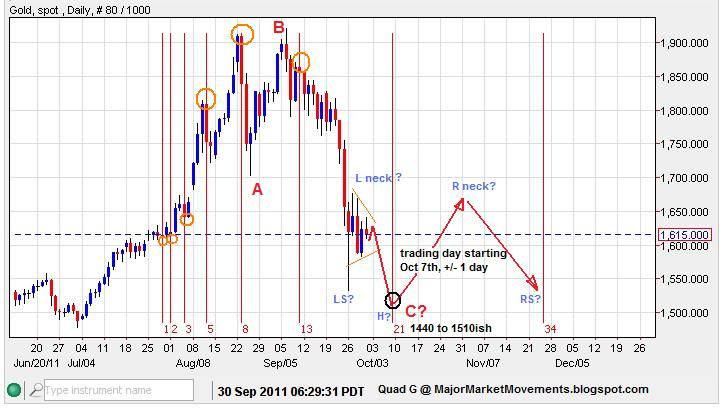
I suspect that PoG will see a bounce early next week back up into the BBs 1700ish from a support zone of 1614 to 1643. Then a retest of those lows looks possible in the first or second week of October. A group of significant support exists between 1575 and 1590. If this zone of support is broken below 1575, then a major top has likely formed, one which may take several months for PoG to surmount after dropping even further (1200s would be possible). This would also kill the MT EW count and prospects of a major parabolic run into the first quarter of 2012.
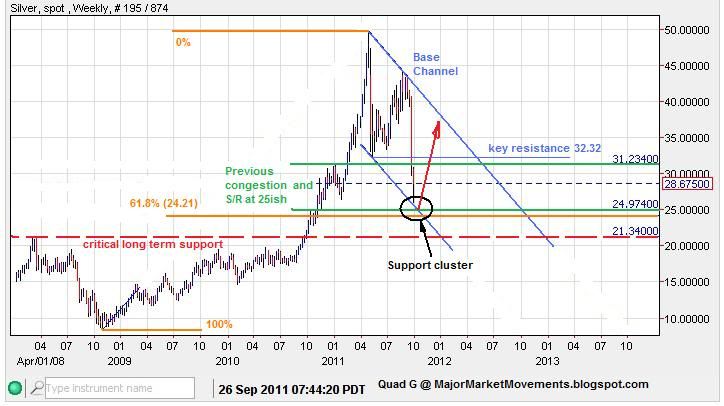
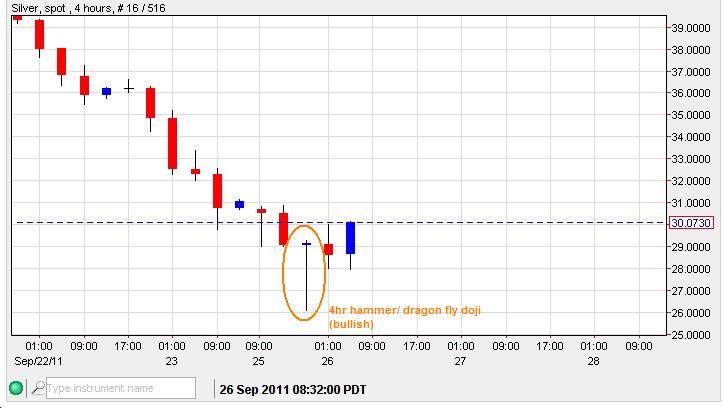
I will work on my Silver report next. I will get to your questions and comments as soon as I am able.
...