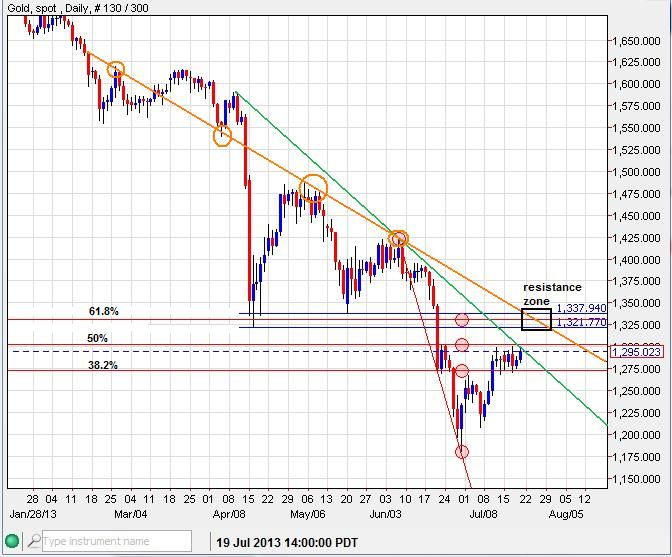
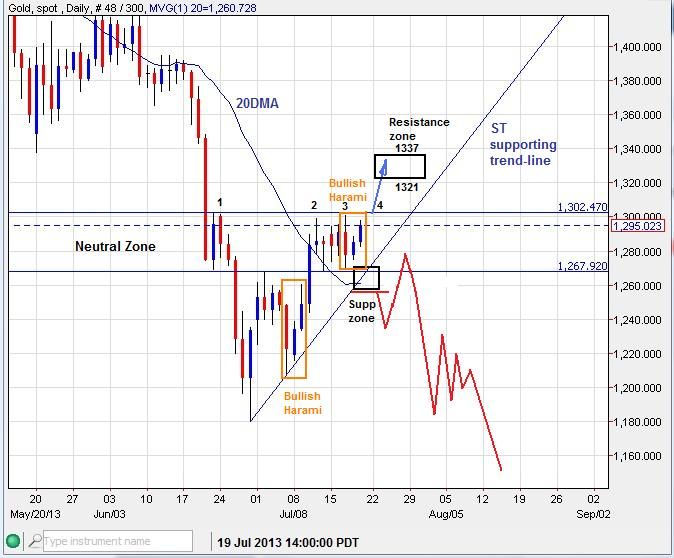
Here are the current ST support and resistance zones defined:
Gold and silver are developing positive (+ve) divergences in the MACD and RSI oscillators. However, it is important to understand the different modes that a bullish or bearish trend exhibits in the RSI.
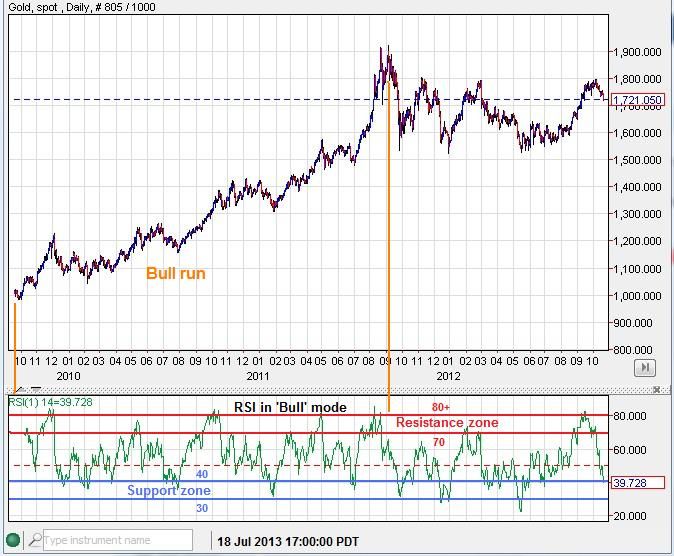
When a market is in a bull trend, the 30-40 line on the daily RSI usually act as support and the 70 to 80 line act as resistance, with 80+ an indication of severe over bought condition. Shown here:
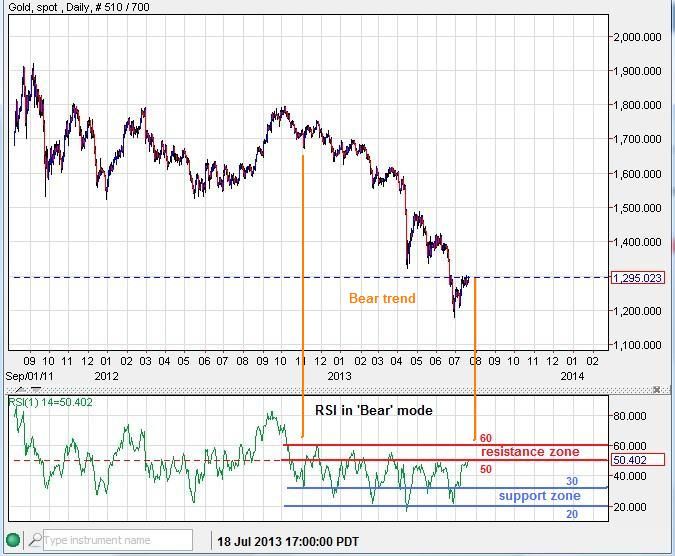
When a market is in a bear trend, the 50 to 60 line act as resistance and the 20 to 30 line act as support, with sub 20 an indication of severe over-sold condition. Shown here:
Once the 30-40 zone starts to become support again and we see incursions above 60 and into the 70-80 zone, it should be a good indication that the MT trend has changed to bullish. I expect to see this switch become evident by September at the latest.
---------------------------------------------------------------------------------------------------------------------------------------
Silver - There are multiple EW counts that I can see that fall within the rules, but this one in particular caught my eye as a possibility:
One more ST low into a support zone around 19.00ish then an impulse up should move above 20.29 in one shot. If the support zone doesn't hold, then another trend down to a lower-low than 18.20 could be realized.
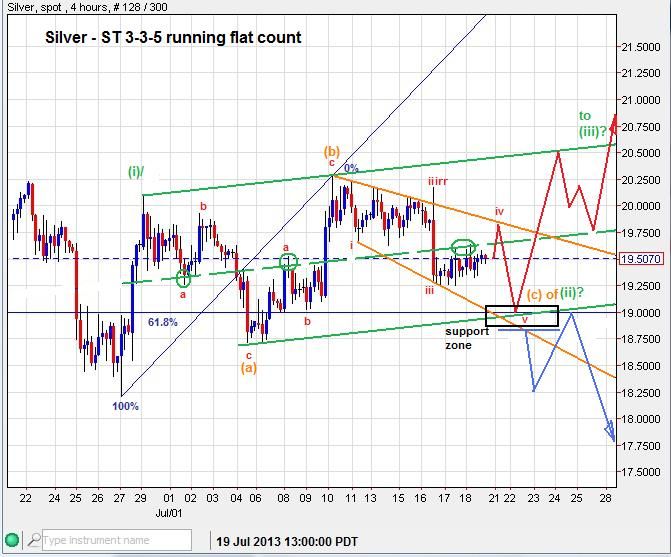
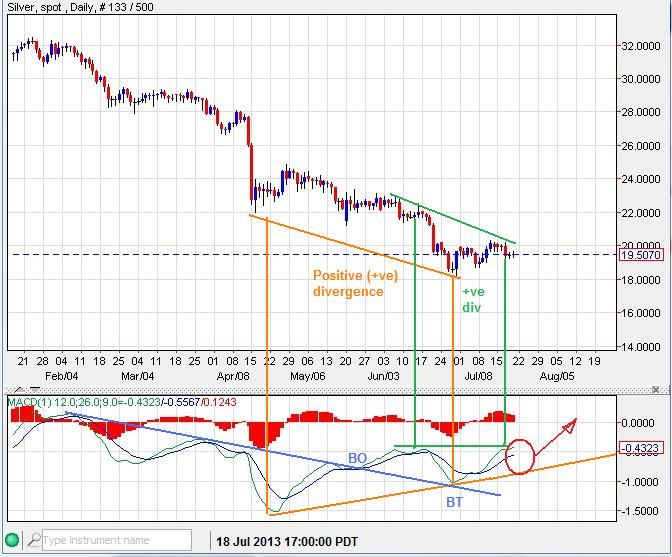
Positive divergences are building in silver, even another lower-low than 18.20 would likely only strengthen the bottoming pattern at this time.
MACD:
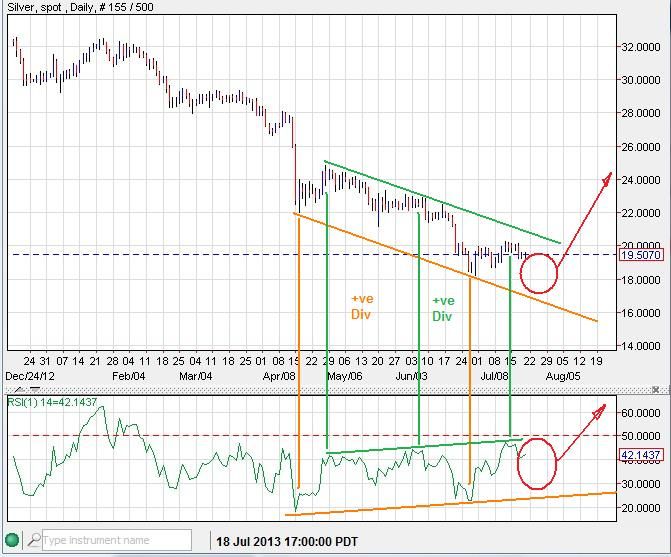
RSI:
--------------------------------------------------------------------------------------------------------------------------------------
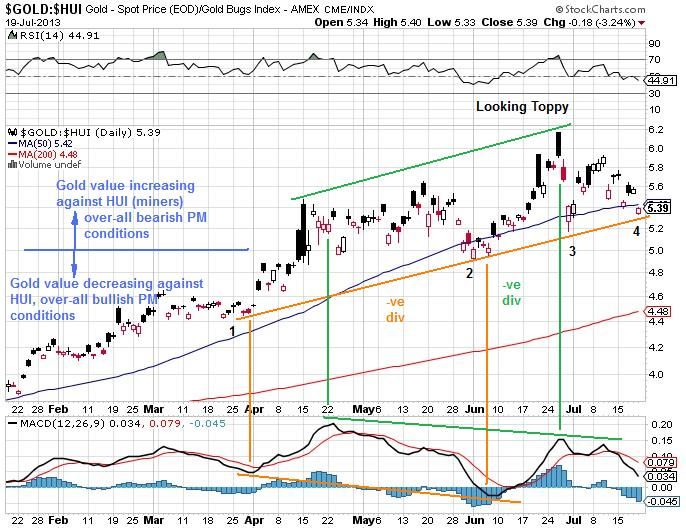
Gold/HUI ratio - This ratio is looking toppy, which means that a significant bottom in the PM complex (gold, silver miners) is very close.
Mining stocks generally anticipate forward price increases in gold and silver as investors attempt to add leverage with the purchase of over-sold mining shares.
Long term:

The current Mid-term trend is being supported by a multi-month trend-line. This trend-line is being tested for the 4th time, which suggests that a break of that support could come very soon. This would likely lead to an upward surge in mining stock prices outpacing any rise in gold prices. Over-all a bullish result for the PM complex.
GDX is also reflecting the same bullish rule of 4 break-out potential, as +ve divergences are built:

-------------------------------------------------------------------------------------------------------------------------------------
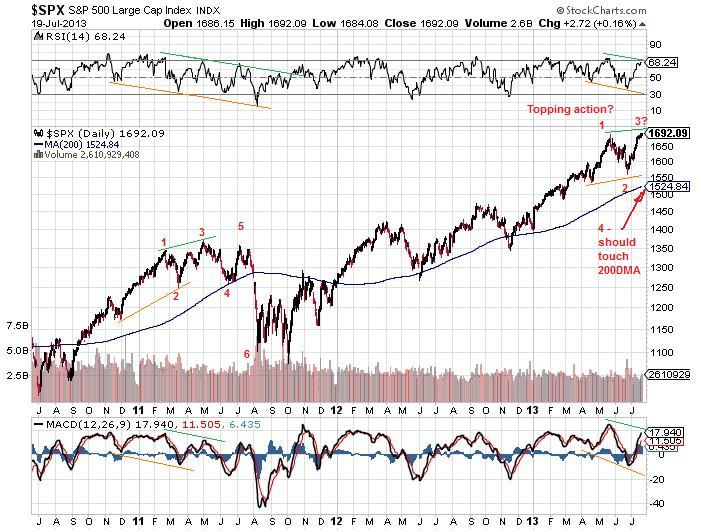
S&P 500 - I spotted this fractal top that could be playing out, currently on step 3 (up) before step 4 (down) to test the 200DMA in the weeks ahead. Topping action could be seen early this week.
The Nikkei and USD/JPY could be leading the way with their own topping action.
-------------------------------------------------------------------------------------------------------------------------------------
If you are interested in receiving my daily email updates you may sign up here:
http://majormarketmovements.blogspot.com/p/mmm-market-signal.html
Good Hunting,
QG