Sunday, October 28, 2012

Weekend Report - Gold and Silver


Hey All!

Back in the saddle again! I'm likely to have a good niche of time on the weekends to produce reports here on the blog, complete with charts. I'll still keep a presence over at www.kitcomm.com , chiefly at my thread Major Market Movements www.kitcomm.com/showthread.php?t=41880

You are welcome to leave questions and comments here, but I will not likely respond until the following weekend.

Gold and silver appear to be poised for a trend change soon. The past few weeks have shown some trepidation, possibly due to the uncertainties surrounding the upcoming elections. I suspect long term (LT) speculations will set in, producing a good sized trend after the elections are finalized.

Gold has a series of fibo turn dates coming up on the 30th and 31st this week, which also roughly correlates to a full moon on the 29th:


A turn this week could complete a bullish Cup and Handle (CnH) pattern with a projected target of 2066, which coincidentally, is also double the 2008 high of 1032:


In the short term (ST) gold may have formed a bullish iHnS, as part of a break out (BO) and back test (BT):


Even though Gold has some potential bullish behavior ahead, it's prudent to regard the 3/10/20 ribbon which is still in a bearish alignment:


------------------------------------------------------------------------------------

Silver of course is in the same boat as Gold for the most part, displaying some of it's own bullish patterns.

Silver is also posting a (CnH) as part of a break out and back test:


Which is all part of a very bullish rounded bottom that has formed over the last several months:


Candlesticks on the weekly silver chart shows a unique combination:


The 4hr MACD chart often provides some clues regarding mid term (MT) trend changes:


My primary focus will remain gold and silver, but I do enjoy watching other markets as well. If you have a particular interest in other markets please make a request known and I will do my best to comment and post related charts next week.

Have a good week folks!


Thursday, December 15, 2011

Gold and Silver - Update 12/15/11

Hello All! I caught a break and decided to furnish an update on my favorite markets - Gold and Silver. Life for me has changed significantly, for the better. However, in so doing, I don't have the time for this blog or other pursuits. I'll chime in from time to time, but such visits will likely be few, far between and limited in scope.

The blogging experience has been enjoyable. I can see that with all the content I would like to deliver, this endeavor could easily become a full time gig to do it right. However at this time, I have much more important and meaningful duties that demand my attention.

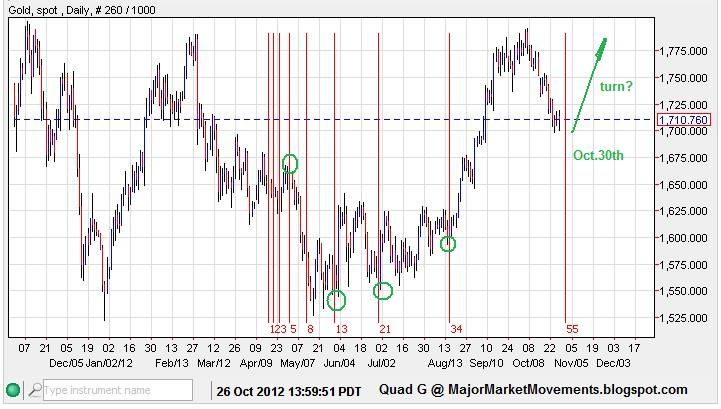
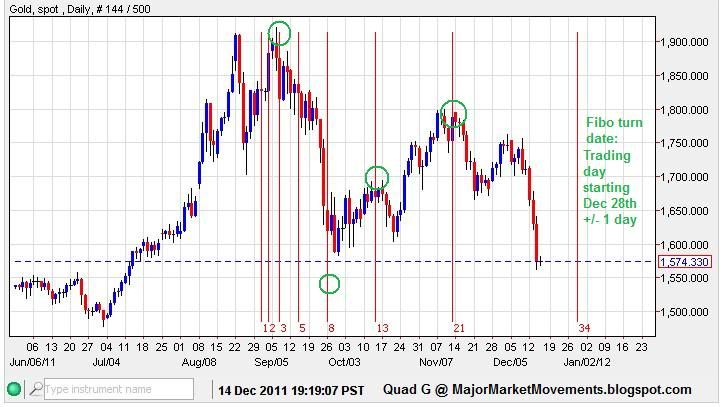
Gold - This latest sell-off was well anticipated. Using the technical tools that I have taught on these pages most certainly indicated a turn and coming weakness.
First the Fibonacci Time measurements did another terrific job! Spot on again!
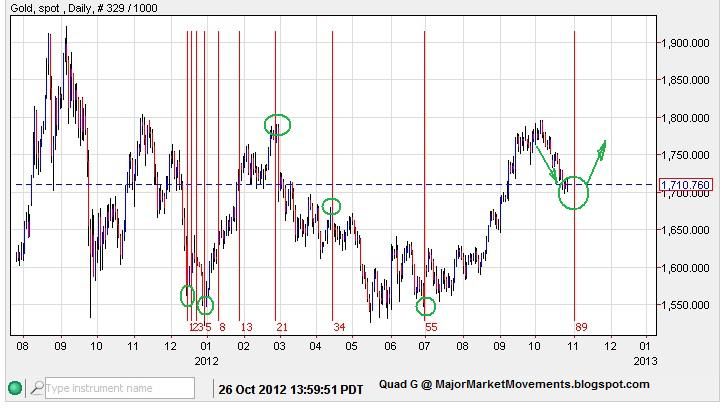
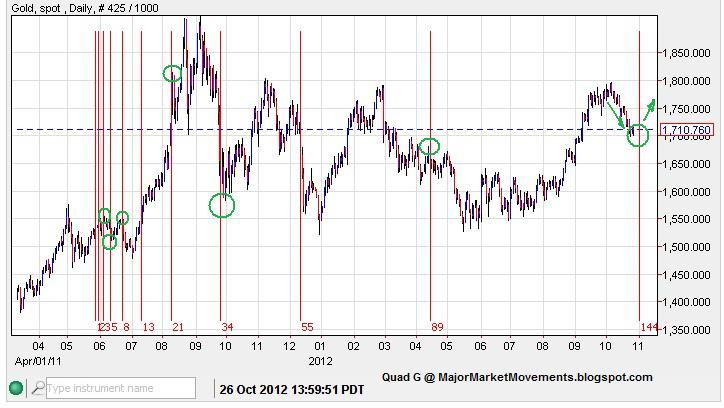
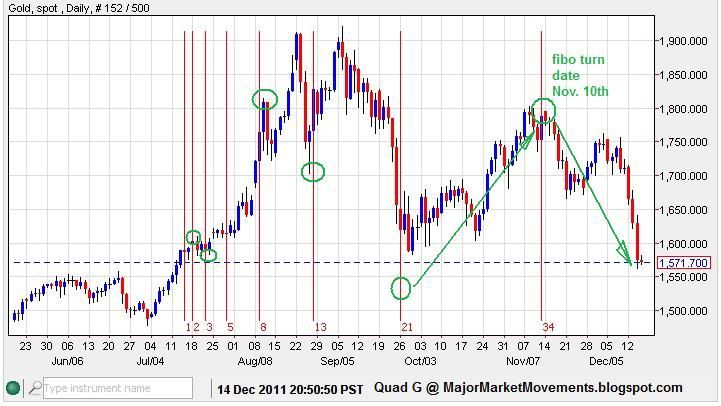
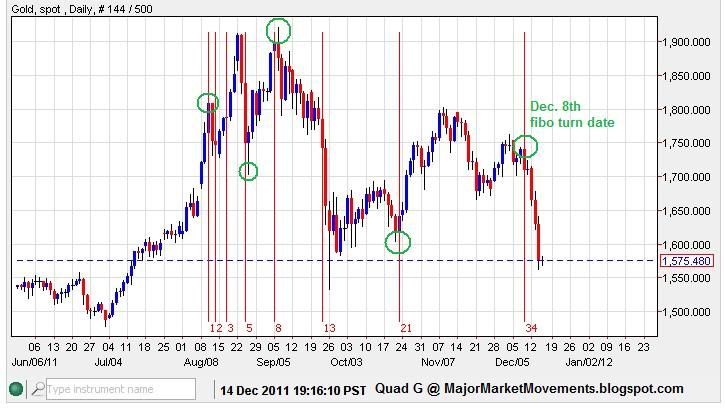
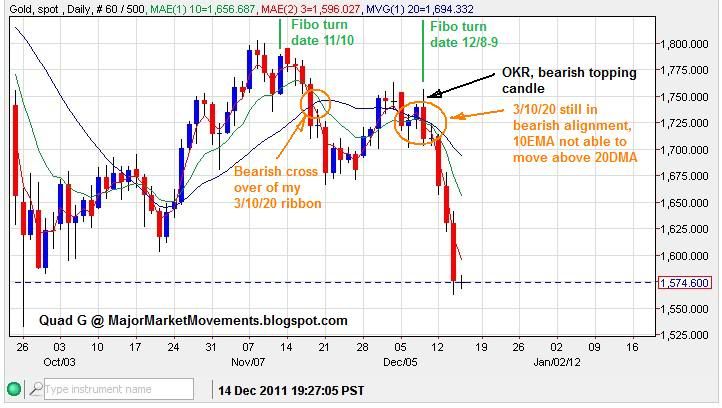
The turn dates that I have mentioned previously Nov. 10th and Dec. 8th-9th both produced highs. Using the Fibonacci Time Zone tool on NetDania here is how I derived the two turn dates, it's easy to do, try it yourself.

Nov 10th:


Dec. 8th-9th:


Having worked with this tool for a few months I have established a some rules:
1) Must measure off at least TWO previous turns, the more turns that are connected the better the result.
2) A trend of at least 7 trading days must move up or down into the turn date.
3) The turn can be the top of the trend or back test of the trend.
4) Daily measures are generally less significant in strength than weekly. Measured turns on a daily chart may only produce a trend that lasts a few weeks, while measures on the weekly chart could initiate trends that last months.
5) Dates must be given a window of +/- 1 trading day.

I also noticed that the Nov. 10th and Dec. 8th turns fell on or near Full Moons, with Dec. 8th being a rare lunar eclipse. This may have influenced the strength of the turn dates. Recognition goes to Antimagnetic for his previous eclipse work and it's affects on the Gold market.

Another Fibo date I recently measured in the daily time frame is on the horizon:

Dec. 28th:


The 28th also coincides with a weekly fibo turn date that pointed to the last week of December. This could be a good place in time to watch for a potential major bottom.

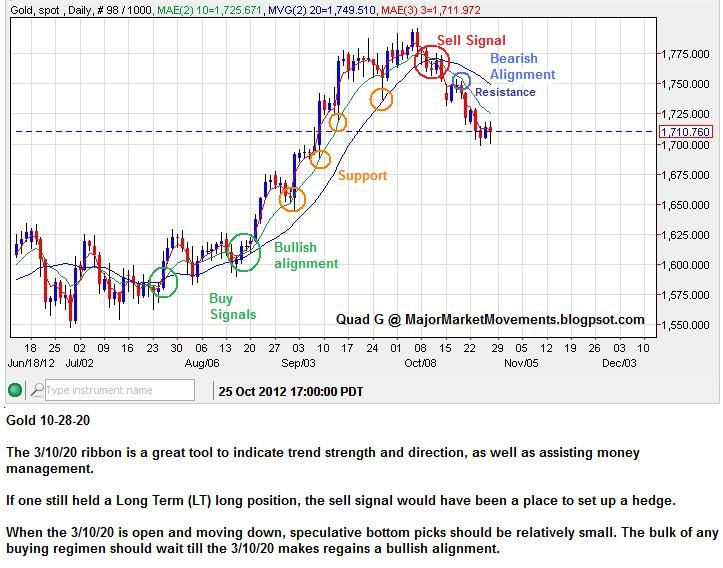
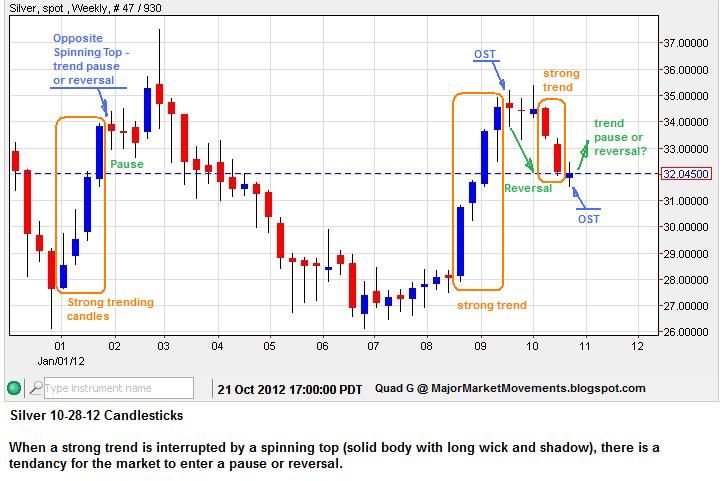
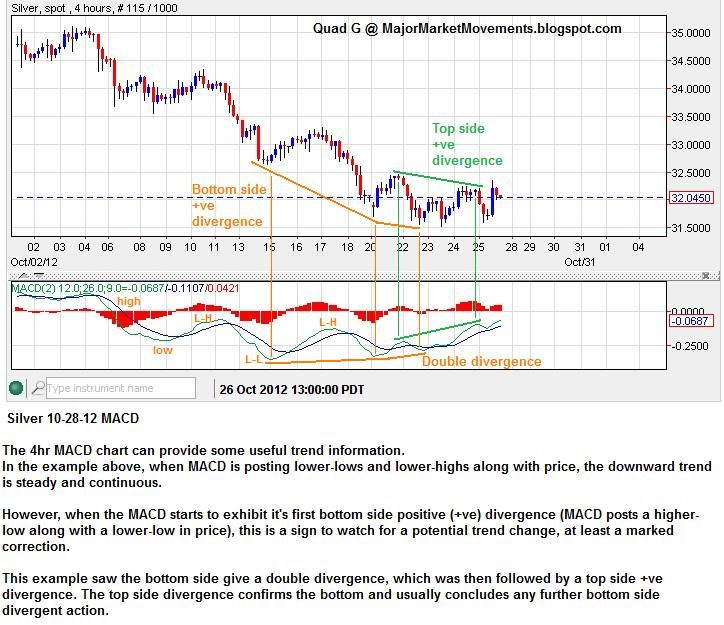
I have also taught the 3/10/20 ribbon and Japanese candle sticks. If these two were being watched, a bearish warning would have been observed:


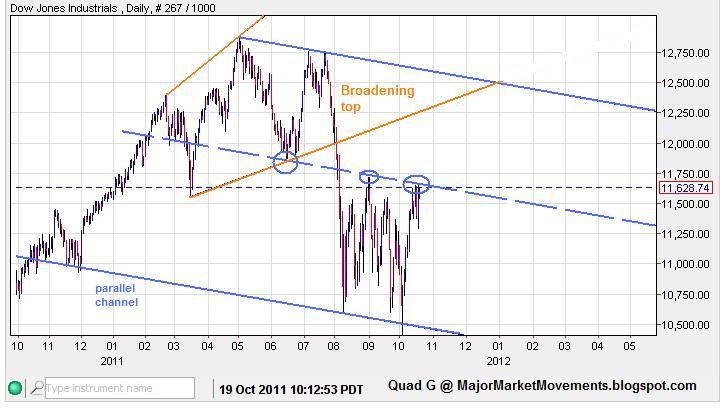
A channel line analysis also displayed bearish trouble:


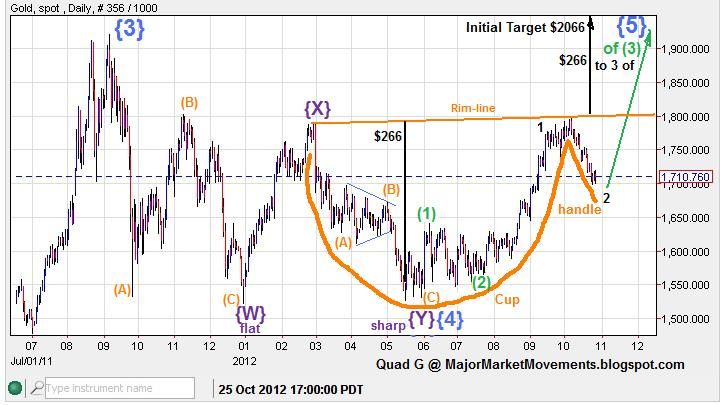
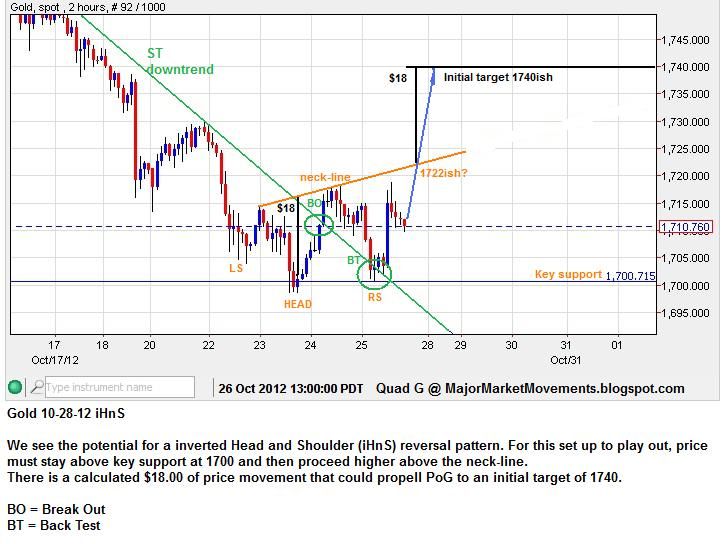
Also a bearish Head and Shoulder pattern suggesting a top was near, giving a potential initial target of 1534:


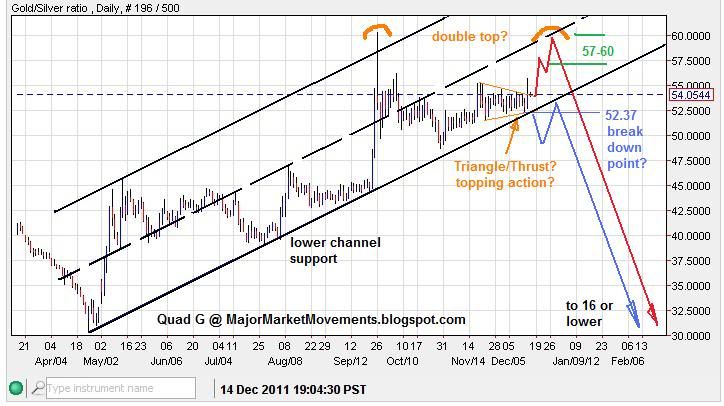
With this information I sold some of my gold stack near the Nov. 10th date and the Dec. 8th date, averaging out between 1750 and 1800. I will now be looking to load up some silver on this dip over the next few weeks. I previously mentioned that I was looking for the GSR (Gold to Silver Ratio) to make a move higher toward 57-60. we reached 55.60ish on a intra-day basis yesterday. If the ratio stays above 52.37, I think the 57 to 60 zone could be reached soon:


Once 52.37 is broken, I think the top of the GSR with be locked in and the journey toward 16 will begin. Silver will obviously be the better performer, thus the reason that I am selling some of my gold stack to buoy the silver stack at this high GSR.

I think Gold could move down a bit more, possibly making a lower-low below 1532. I suspect that this correction is a large degree similar to 2008, but only a 4th wave. If PoG recovers impulsively back above 1666 anytime soon, I think a bottom could be locked in.

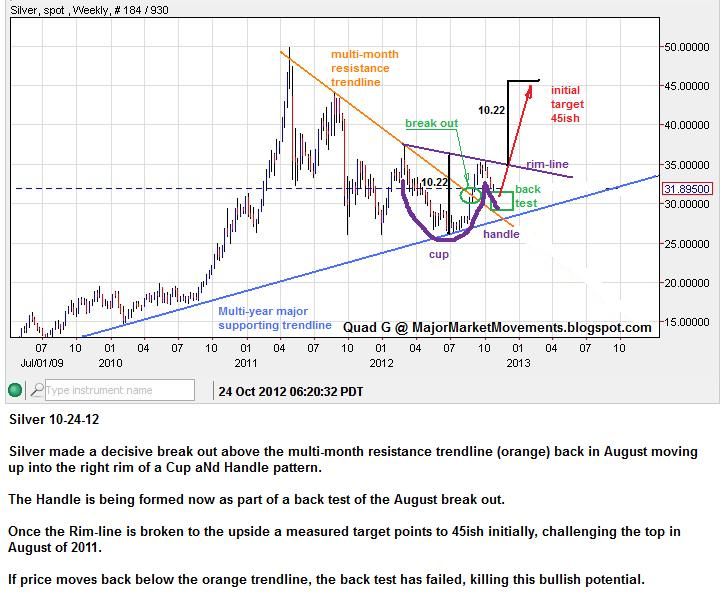
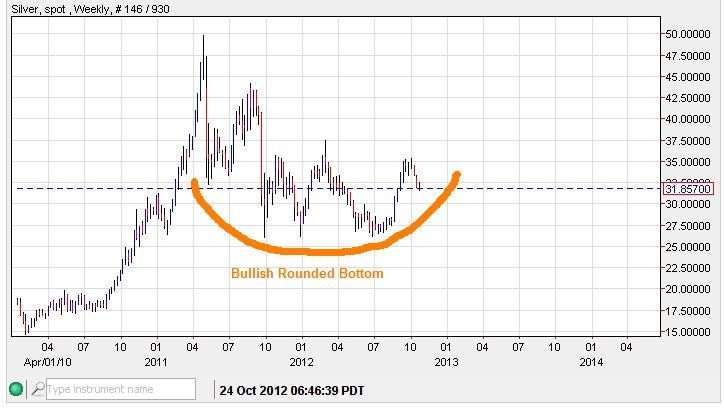
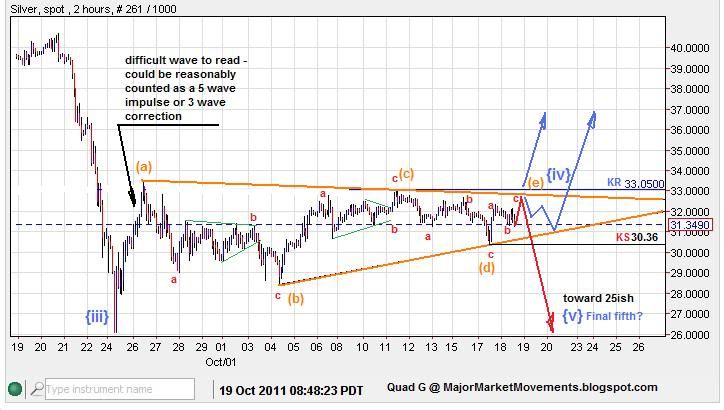
Silver - I think Silver could slip further to test 25ish and potentially 22. But at this time, if Silver recovers back above 33.70, I think a MT bottom will be locked in.

My long term view still has not changed: Gold to 2400+ and silver to 95+ possibly inside the next 8 months. I think this current move down is just pulling back the sling shot with 1920 gold and 50 silver as the pivot.

I also want to put in a plug for NetDania.com. They now have a fantastic smart phone app that is absolutely phenomenal. Go check it out!

Time has run out, gotta go. I am not 'back' by any means. I'll post again when I am able, but might be a few weeks. All the best to you! DYODD.


...

Sunday, October 23, 2011

MMM Weekend update 10/23/11

Dow - The EU mess is still the lead item that the market's are set to react to. So far the stock market appears to be buying the rumor of a EU fix, while climbing a wall of worry. Perhaps at some point they will sell the 'news'. The Eurozone 'leaders' have done a masterful job of keeping hope alive from one week to the next with pure jawboning.

The Dow technical picture in the MT is decisively bullish while above 11,391. Multiple measurements, trend lines and moving averages provide a net of all kinds of resistances from 11,860 to 12,350, with a semi-tight cluster spanning 11,930 to 12,070. Friday last week gave a solid break out on the daily and weekly chart. Barring a major reversal early this week back below 11,391, the Dow is likely to move higher challenging the resistance zone between 11,860 to 12,350, all part of an attempted back test of the previous HnS neckline (currently above at 12,262).

The end of this week ends the month of October, looking at the monthly chart a very bullish outside key reversal could be in the making if Friday this week closes the month above 11,613. Such a strong monthly candle would be a buy signal for many investors, likely spurring further buying into November and December.

Also interesting to note: the COT data on the E-mini S&P 500 futures (the most traded of stock market futures) is showing an even greater short side interest by large traders, at levels not seen since just a few weeks before the Oct 2007 top.

Gold - A weekly close below 1643 would be bearish, a weekly close at or above 1680 would be bullish. Some lateral resistance at 1655 to 1665. A move above 1702 would allow PoG to move up to 1770ish or better. 1595 appears to be set up as critical support in the short term, a break of which invites a move down to test 1440 to 1510.

Silver - Key ST resistance at 32.00 to 32.33. Key MT support still at 28.41. There is a bullish CnH formation present that could propel PoS to a calculated target of 37.55 if the rim line is breached at 32.70 this week. This bullish pattern will die if 28.41 is broken first and possibly produce a fall into the $25 range.

USD - Looks bearish under 77.20 for the ST. A cluster of support is present between 75.75 and 76.07. A break of that support would open a path back down to 74.00 and lower and could change the MT EW picture back to bearish, possibly very bearish.

...

MMM Weekly Round Table Discussion 10/23/11 to 10/30/11

Again this week I'll be pulled in every direction with little time for analysis and charting. I feel like a 'jack of all trades, but master of none'. Sometimes I kid that it would be nice to have a clone to take care of some of my duties. Unfortunately my analysis and charting fall behind, compared to my other priorities it ranks low on the list. From what I can see, this situation will likely last into the rest of the year. I will pop in to post some observations when I am able.

All the best to you,

Quad G


...

Wednesday, October 19, 2011

Morning Coffee with Quad G - 10/19/11

I know it's not morning in the states right now, but it's morning somewhere!

Much to cover today. Some of these charts were prepped yesterday but didn't have the time to post.

Dow - Not much has changed so far. The tops that I called recently are still good and the mid-channel that I mentioned is still holding as resistance:


The blue dashed line is what I call a mid-fork. It's often a point of resistance or support inside a larger channel. We are certainly seeing that line providing resistance.

I recently called two tops in the Dow and explained briefly why. Here is a chart to better explain:


The back to back gravestone dojis is a good ST indicator of topping action. And then a 5 wave move up to an incremental high (no break-out) is also suggesting a top.

That 5 wave move was also back-testing the previous channel that was broken to the downside:


Then yesterday and today we see the Dow attempting a 3rd time to break resistance:


Be wary of a potential 'fake out' today or tomorrow. That probability will likely die with a move below 11,430. The gap at 11,140 and the lower orange trend-line may give some support. I didn't mark it on the chart, but if that support holds and a 4th attempt is made to the upside and breaks the higher orange trend-line, then the 'rule of 4' would suggest that such a move will likely break out strongly to the upside. However, a solid break of that lower orange trend line and 11,104 should keep the selling moving along strongly.

AAPL (Apple Inc.) I suggested that one may want to 'sell the news' on AAPL. Their numbers were strong but they still 'missed' guidance, investors are unforgiving. In the wake, AAPL has put in an 'Island Reversal' at the end of a 'gap happy' streak, often a very strong reversal pattern:


IBM also displaying some topping action:


Overall, the market is looking close to confirming another significant turn, Dow down impulsively another 100pts since I started this post.

Silver - Close to filling out a convincing triangle wave {iv} with a wave {v} down to come which is likely a final fifth:


If this triangle is complete, then Key Support (KS) should be taken out soon, inviting a final thrust to the downside. The end of a final fifth would likely give an excellent buying opportunity, preferably $25ish. I think Gold will likely follow silver down and challenge 1500-1510, with an off chance at 1440ish. I would like to see the GSR (Gold/Silver ratio) not exceed 60ish. If Key resistance is exceeded (33.05), then the triangle denies the dowside potenial and allows for a move up to 36+.

Euro - And the USD, Displayed some good structure indicating a turn, Here is how it looked at the Euro end:


First clue was an (OKR) in the 2hr time frame at the end of a 5 wave structure on the back side of a trend-line that was once support but now resistance.......all coming together to suggest a top, at least ST, was likely.

Then the 4hr time frame added to the signal:


EW counting suggests a 5th wave is finished, a well formed 5 wave impulse, text book example:


The daily BBs were also provinding resistance:


And the larger picture shows the move was inside the multi-month support/resistance zone:


Using mutiple tools at the same time can help hone in on market turns.
Key resistance for the Euro is now at 1.3914. The move down so far could be corrective or something more substantial, not sure yet, but the move looks somewhat choppy. A move below 1.3440 would likely lock in the current top at 1.3914.


...

Sunday, October 16, 2011

MMM Weekly Round Table Discussion 10/16//11 to 10/23/11

I'm still on a busy schedule so updates will still be infrequent and irregular.

You'll notice that the ads are gone. Google AdSense has disabled the account due to 'invalid activity'. They didn't give me any details, just cut off. An appeal was immediately rejected. I can only assume at this time that some 'click-a-holics' out there thinking they are 'being generous' with clicking on my ads a lot have generated this 'invalid activity'. I requested that the hyper active clickers be banned from registering clicks, but it was ignored are is not possible, not sure.

I find it amazing that perhaps 1 or 2 clickers can shut down a whole AdSense account. No warning, just boom done..........Ridiculous.

Ads or not, I'm still here.


...

Dow - Update 10/16/11

The recent stellar run up in the Dow is amazing, not seen since the march 2009 bottom with regards to intensity. This has caused me to pause and take a look at the long term weekly charts to do a trend line study. What I found was very interesting:


We are seeing a bounce off what looks like a major epicenter of trend lines. Which sets up a major cross road.

Zooming out:


If the orange mid-fork is going to be respected with a strong surge, then I think it's entirely possible that the SM could attempt another higher-high. However, such a move is dependent on the recent low of 10,404 holding as support. Failure at that point would suggest a major channel break is occurring, allowing a drop to 8700ish and lower.

I imagine that the PTB are aware of this situation and are doing their utter best to keep the market afloat. With short interest at a high level, climbing a 'wall of worry' is entirely possible with a little help. The trades going forward are not going to come easily, likely plagued with a great roller coaster of volatility.


...