Fibo/lunar turn date windows and their results:
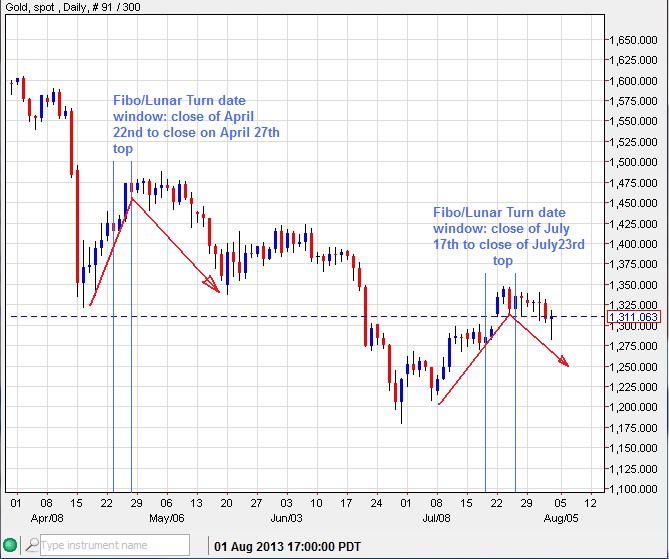
Here is the Previous ST chart showing the lunar turn date progression so far:
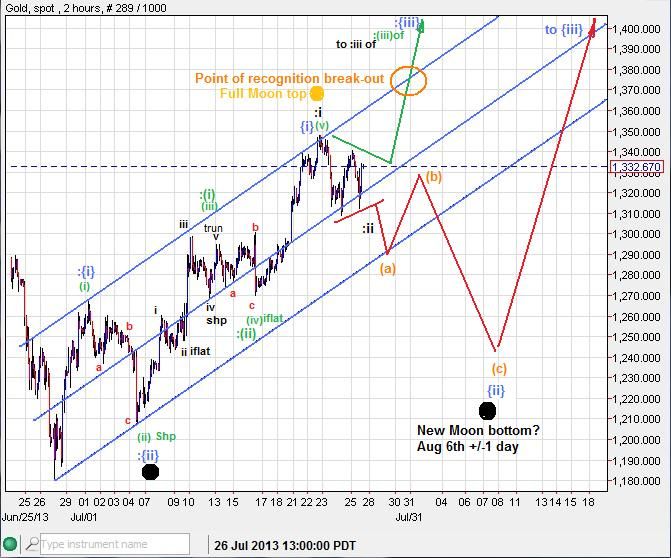
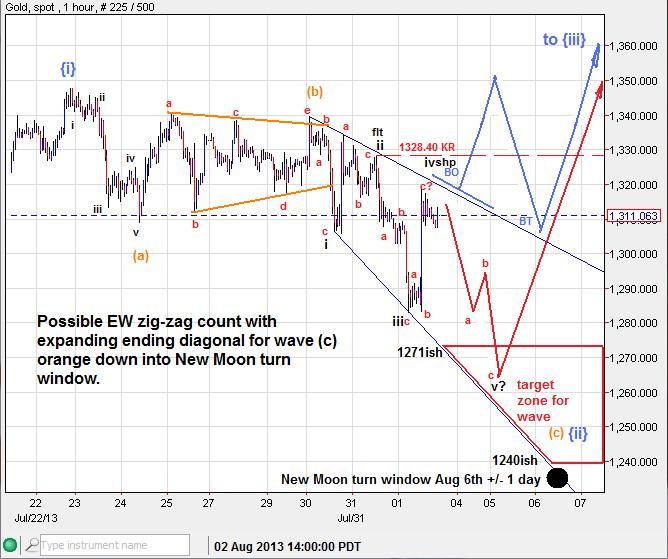
This is a ST EW update:
The 38.2% fibo retrace level at 1283 was key support for last week:
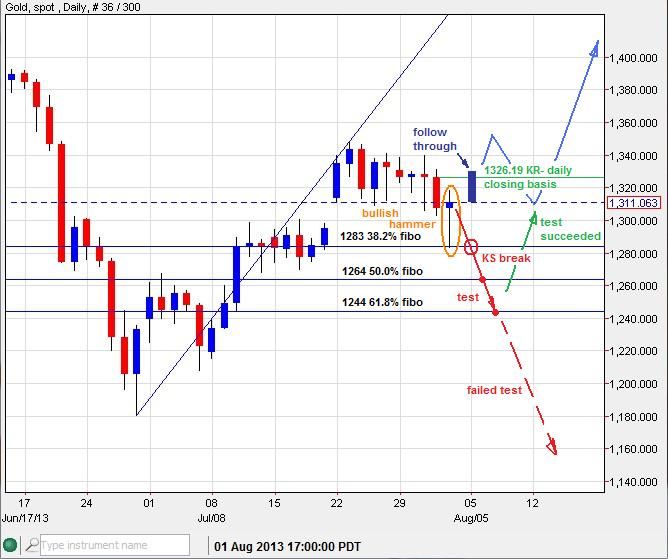
My subscribers were keyed in on this important 38.2% fibo level as well outlining the previous congestion support zone which was nailed just before the bounce last Friday, which provided a nice $50+ ST pay day on a short play:
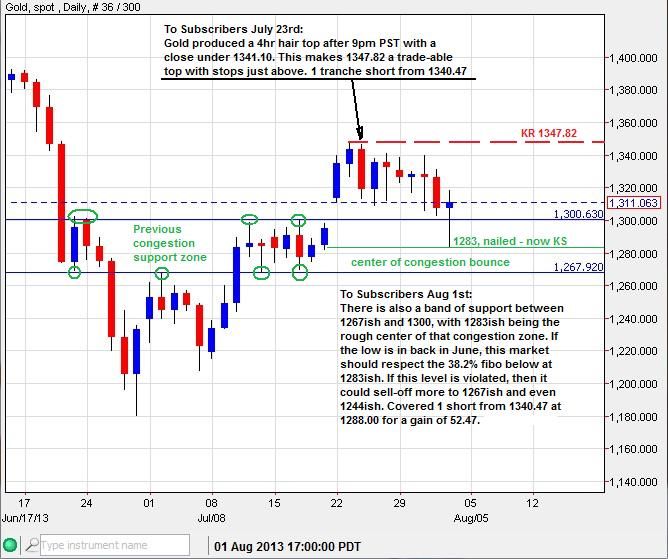
In a nutshell - While Gold is below 1328.40 on an intra-day basis, the ST bias is still down for the next few days. The downside target range is 1271ish to 1240ish. 1240ish is also a key spot for percentage pickers, as a customary bullish pullback of 8% would be realized at 1239ish and a 5% risk off the bottom (1180.20) points to 1239ish. If 1240ish is broken as support, then further downside momentum could be fostered, eventually leading gold down to test 1180 and lower. However, an intra-day breach and daily close above 1326.19 should provide the follow-through necessary to allow a jump up test key resistance at 1347 and eventually break-out into a wave {iii} advance to the upside. Many downward trends into August have seen significant bottoms born in this key seasonal time frame.
-------------------------------------------------------------------------------------------------------------------------------------
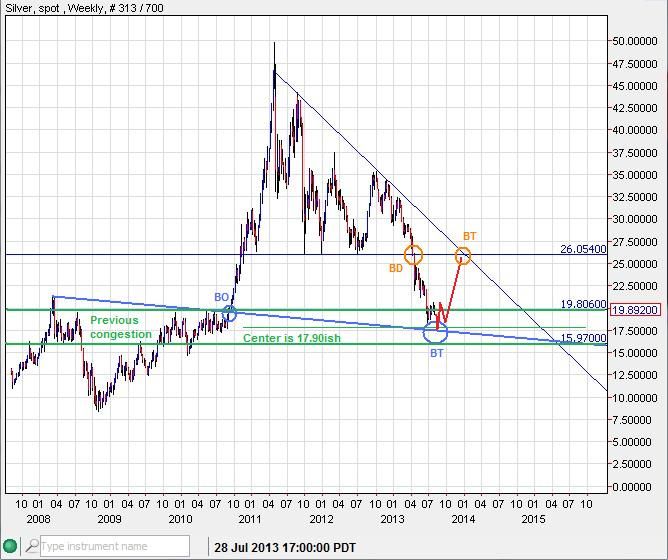
Silver - Based on recent action, it looks to me that Silver is also prepping to confirm a bottom or make one more final low. Either way, the action looks MT bullish with any dips or lower-low buys likely being rewarded into the rest of the year.
A MT trend-line that has posed resistance for many weeks now has had it's first intra-day breach on Friday. This action weakens that trend-line as resistance. A daily close above that trend-line this week would trump it all together. No doubt many shorts that have depended on that line for guidance may cover their positions with a solid breach.

Friday's intra-day low could have tested a neckline of a bearish HnS pattern. If this neckline is broken next week, the projected initial target is 17.86ish. A breach of the top of the Head would have the opposite effect, Possibly spurring on a rise toward 21.96ish for starters.

In my opinion another sell-off to sub 18 would be welcome. As I look at the LT picture I see the MT downward trend coming to rest inside a LT congestion zone between 16 and 19.80, the center of which is about 17.90. This is prime territory for a recovery bounce up to back-test (BT) the previous break-down (BD) at 26 in the weeks and months ahead.
------------------------------------------------------------------------------------------------------------------------------------
USD - The USDollar long term count is finally getting an update.
Here is the old count from December 2010:
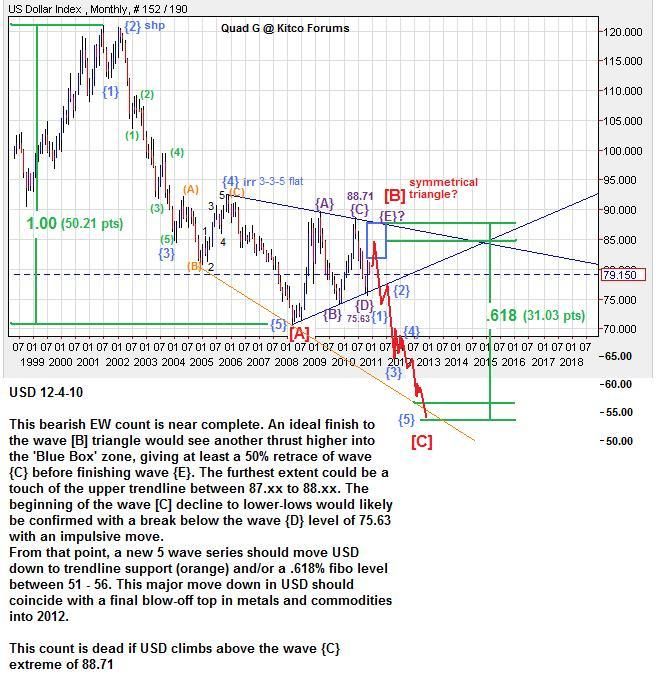
Wave {C} could be cooked as the 27-28 monthly cycle comes to a close. This could lead (at a minimum) to wave {D} down to test at LT trend-line below (currently at 74ish and rising). However, a breach of the foremost upper trend-line (currently above at 86ish and falling) could create a Rule of 4 break-out run to the upside, targeting 93 to 100 initially.

------------------------------------------------------------------------------------------------------------------------------------
If you are interested in receiving my daily email updates, you can try my subscription service for free for 15days.
Sign-up here: http://majormarketmovements.blogspot.com/p/mmm-market-signal.html
Good Hunting this week, could be very exciting,
Quad G