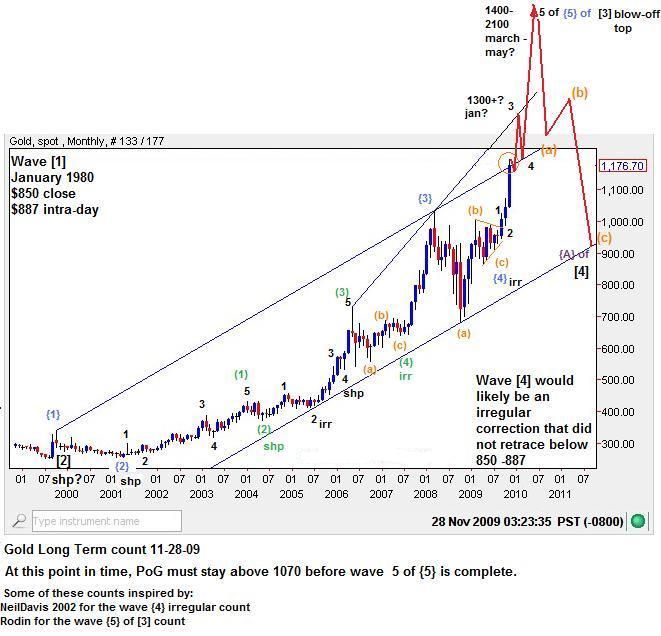
Here is the old EW LT count from 2009:
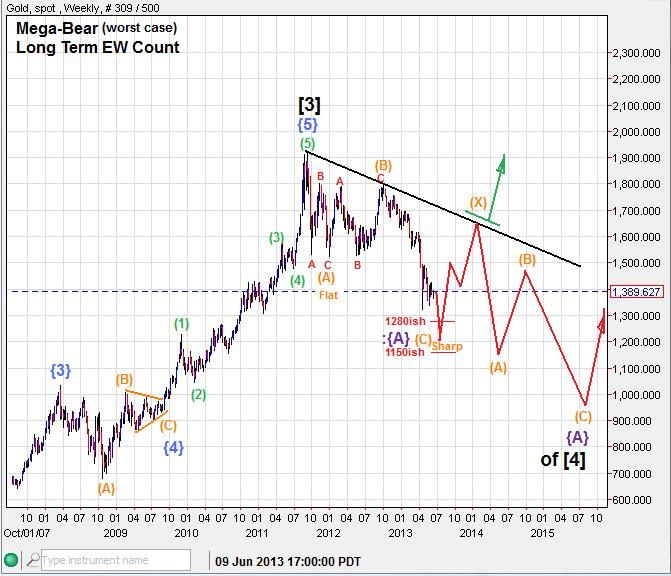
Update for 2013:

Zoomed in:
MT view of (C)orange leg down, counted as a sharp double-zig-zag which is alternate to wave (A) which was counted as a flat correction:
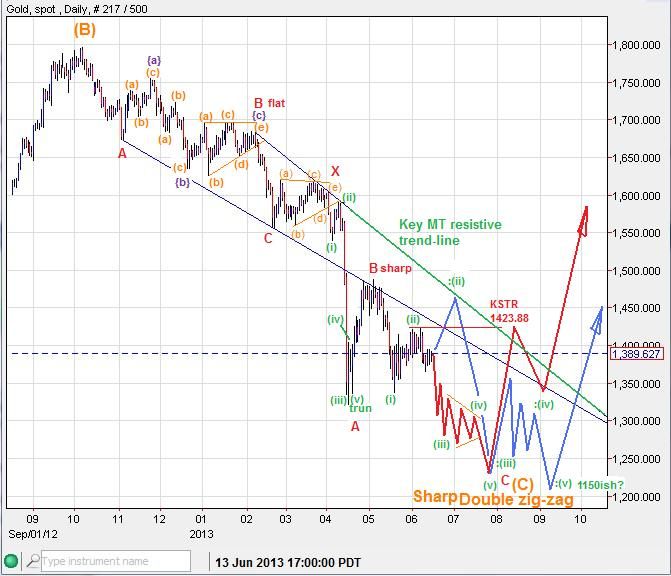
The Mid-Term in a nut shell: We should be seeing some bottoming action take place between now and no later than September, seasonal bullishness should be evident by that time. An ending diagonal pattern, choppy and down into the the summer months would be an obvious sign of a market that was set to rally in the later half of the year. That rally should easily back-test April's break-down from 1520 to 1540, and could even go the distance to hit the center of the previous wave (B)orange congestion (resistance zone) between 1660 and 1700. How the price tangles with the the major multi-year 'Thick Black Line', will be the key determinant whether further upside will be realized (green breach) or not (red rejection down).
For LT stackers, a long, drawn out, deeper bottom would be very welcome.
------------------------------------------------------------------------------------------------------------------------------------------
If you are interested in receiving my daily email updates covering multiple markets using various analytical tools such as Elliot Wave Theory, Candlesticks and the QG3, sign-up here:
http://majormarketmovements.blogspot.com/p/mmm-market-signal.html
All the best to you this trading week,
Quad G