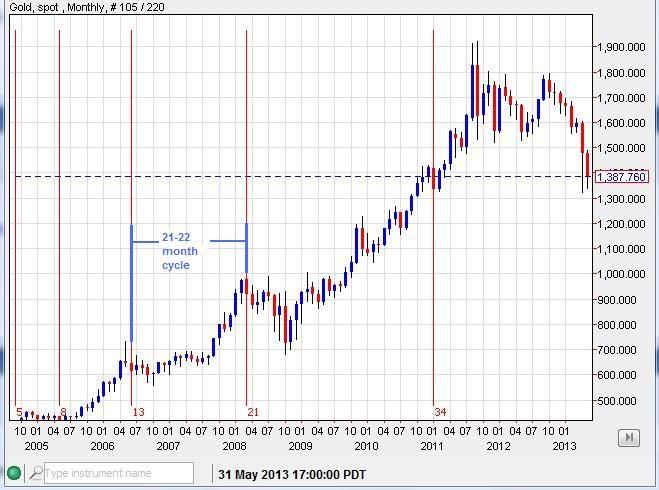
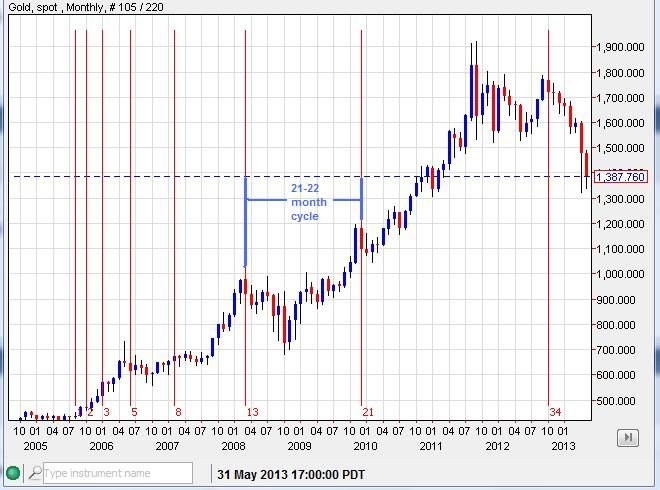
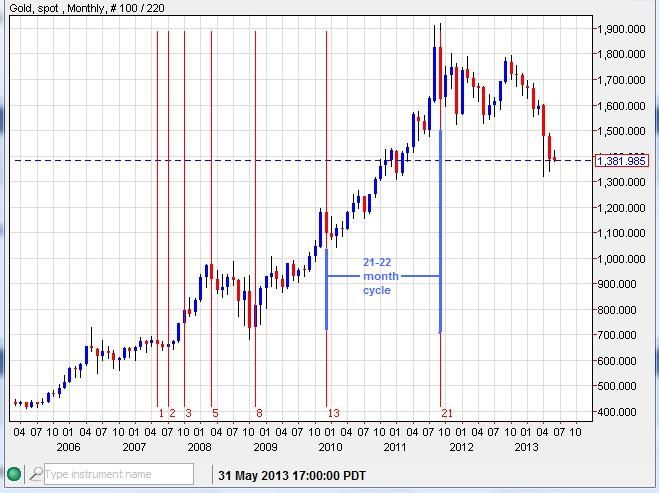
I have done some recent time cycle and work and found some interesting measures.
The 21-22 month cycle has accounted for a few peak to peak spans. That same cycle is about to be hit again in June/July, this time as a potential peak to trough cycle.
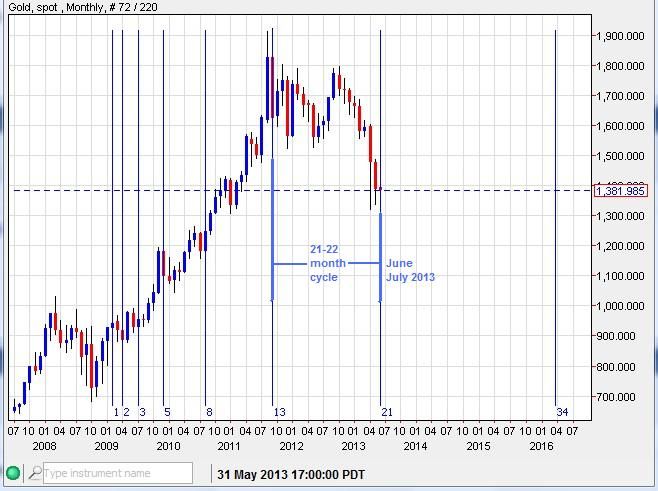
June/July is a wide area of time. After sweeping for weekly time Fibos, the week starting July 14th and possibly 21st was hit with a few sweeps:
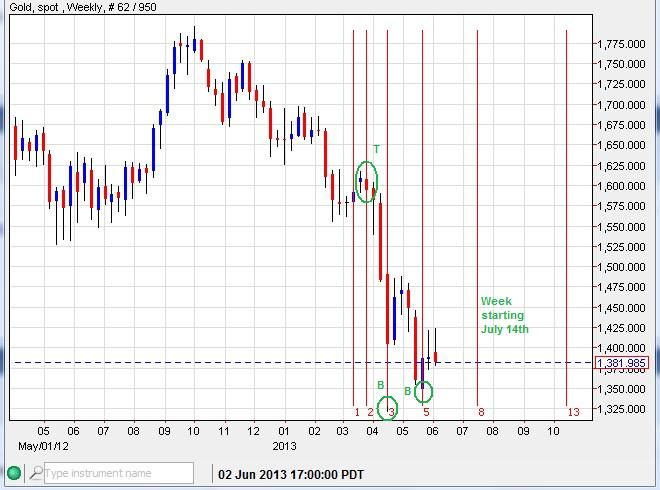

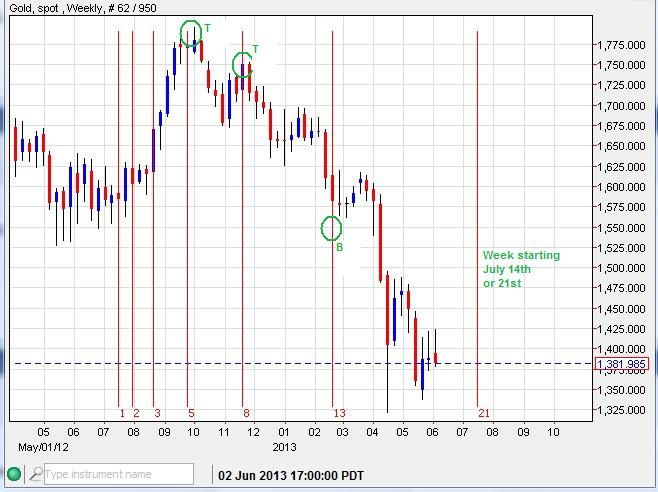
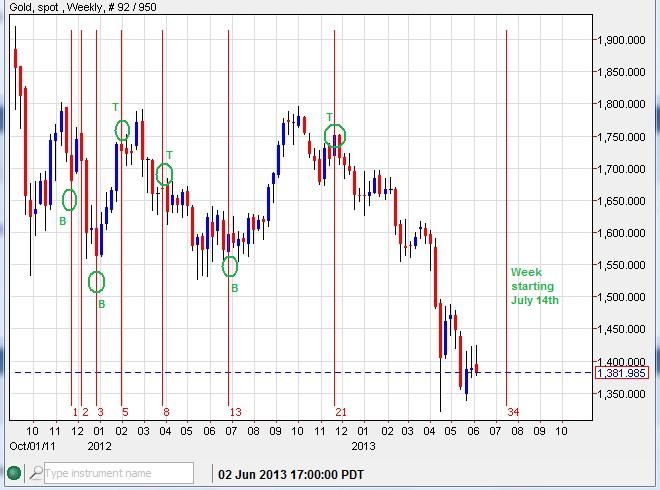
There is also a Full Moon on July 22nd. As we approach that July 14th and 21st weekly turn date window, I may be able to hone down the turn to a specific 3 day window after we get a little closer.
-------------------------------------------------------------------------------------------
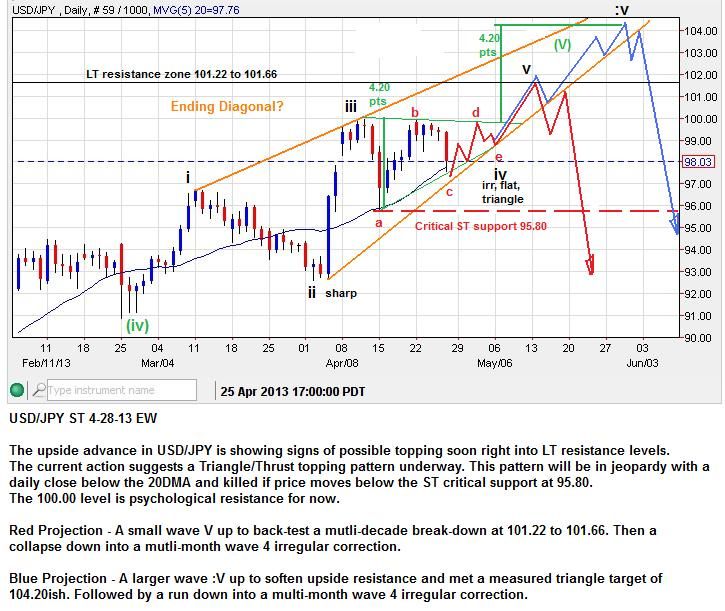
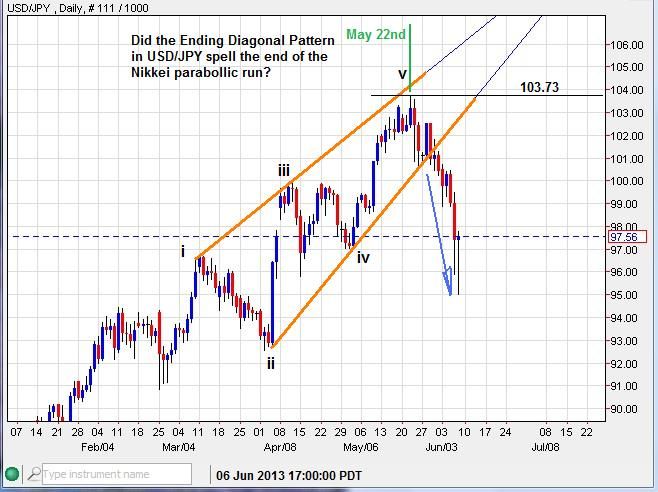
Yen, Nikkei and SPX - Was the May 22nd top in equities easy to spot? I think so, here is how:
First, I posted this Ending Diagonal pattern back on April 28th:
On May 22 the topping process was deemed complete:
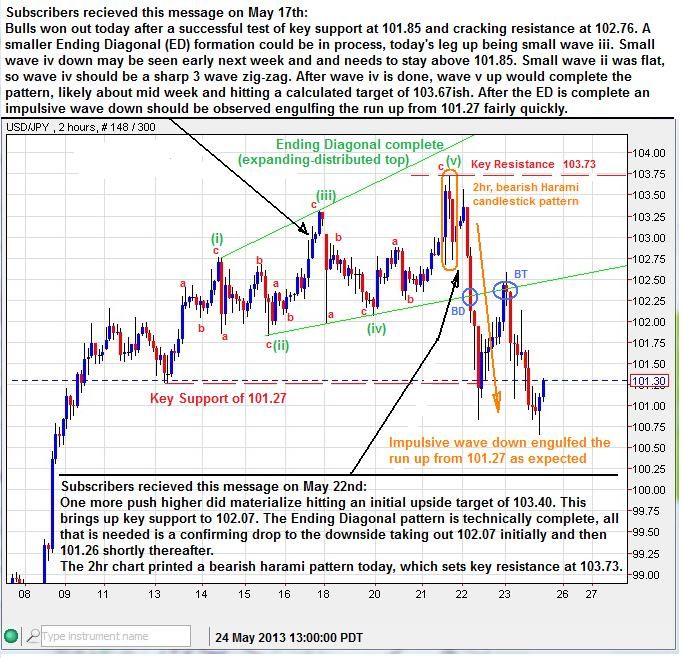
The pattern played out as expected:
The very night right after my May 22nd report to subscribers this happened in the Nikkei:
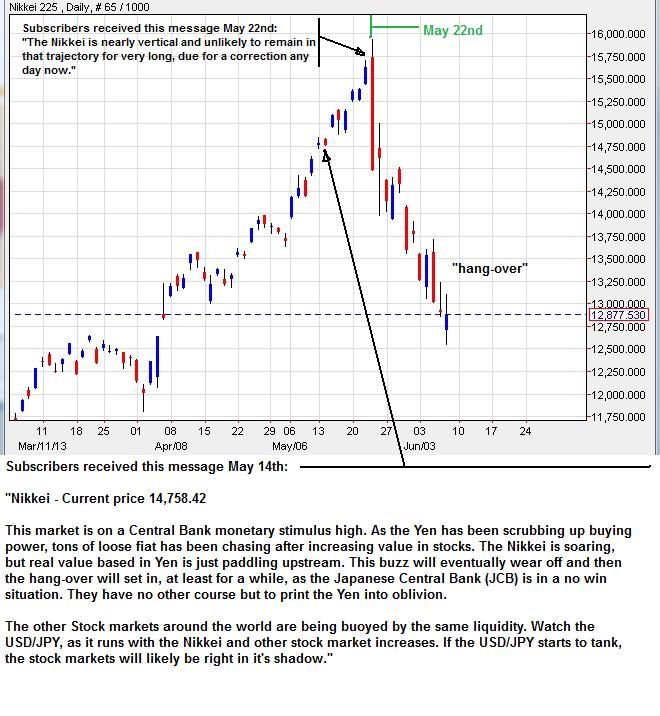
The SPX (S&P500) also posted a warning of a top and correction on May 22nd:

Using only the Elliot Wave theory and candlesticks, a significant top in USD/JPY and equity markets were able to be spotted and acted upon.
-------------------------------------------------------------------------------------------
If you are interested is receiving my daily email updates, you may sign-up for a free 15 day trial here:
http://majormarketmovements.blogspot.com/p/mmm-market-signal.html
All the best to you,
Quad G