
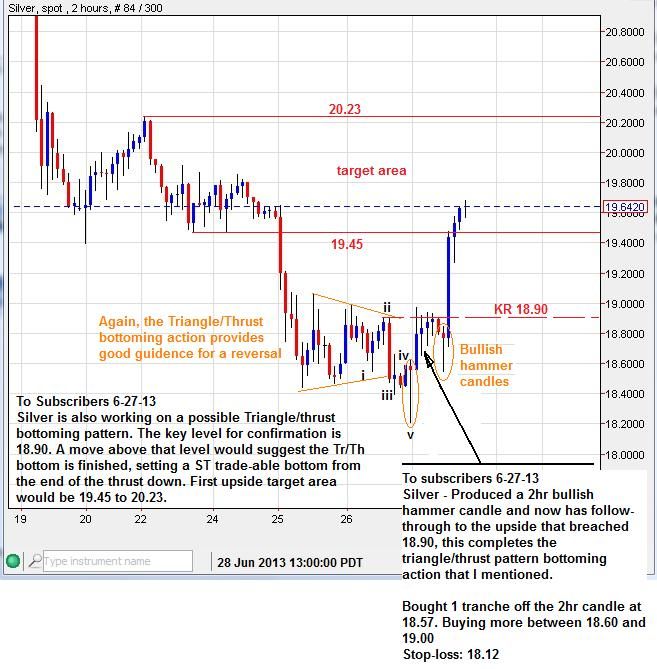
Silver also added to the chorus with it's Triangle/thrust bottoming action:
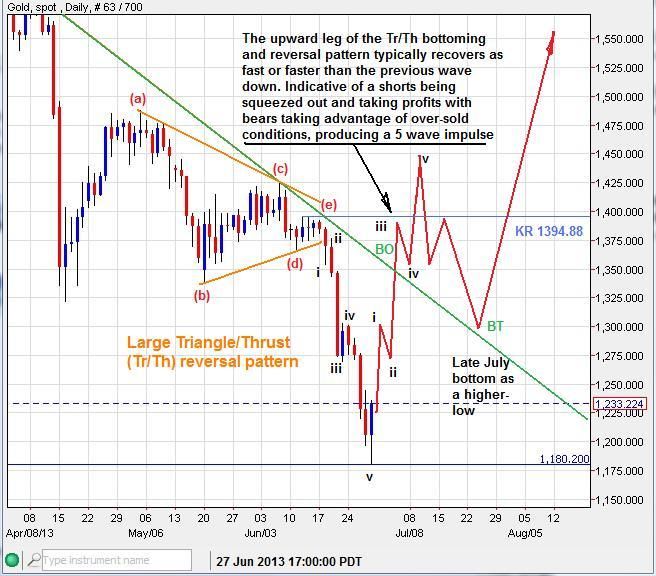
On the near term horizon with successful follow-through this coming week, The attitude of the next wave up is key in determining how the MT may continue to unfold.
A quick 5 wave impulse up that confirms the larger triangle/thrust (Tr/Th) count needs to breach the MT down trend-line (green) and 1337.94 as a 'point of recognition', then take out the top of the previous wave (e) 1394.88. A subsequent back-test and higher-low could be seen in late July before another thrust up.
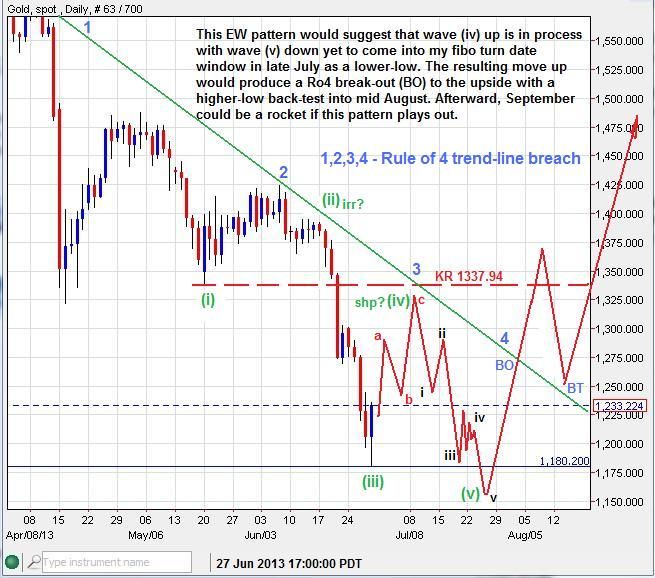
The alternative suggests that 3 corrective waves up(red-abc) that stays below 1337.94 will foster yet another 5 wave impulse down to a lower-low in late July. The resulting move up may produce a Ro4 breach to the upside and a higher-low back-test in mid August. This could be the final low to finish the MT count down from 1795ish.
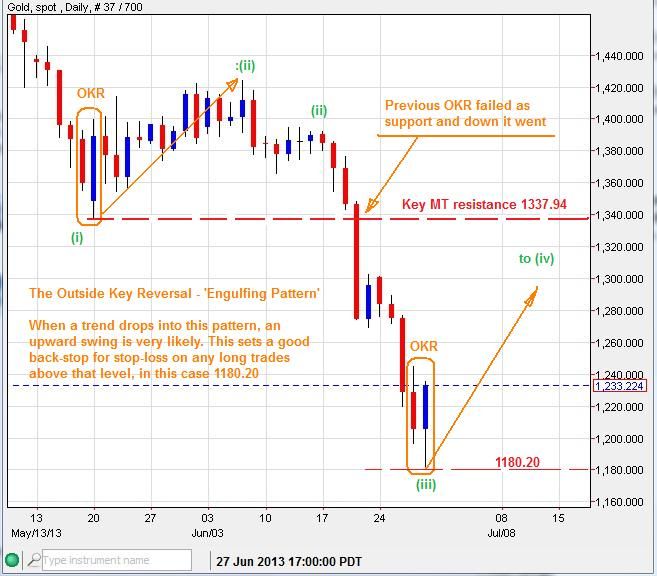
The daily OKR on Friday is a good start for a multi-day run while above MT key support at 1180.20
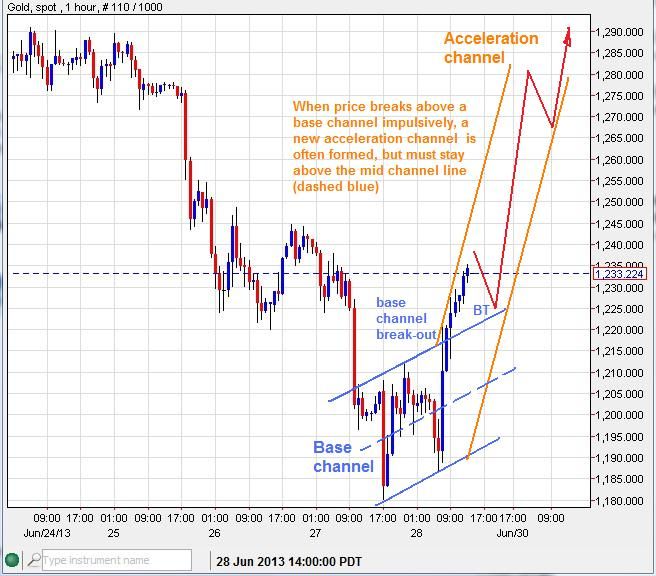
On the 1hr chart, a base channel break-out is evident, which suggest that an acceleration channel is in progress while above 1212 and the mid-channel (blue dashed).
----------------------------------------------------------------------------------------------------------------------------------------
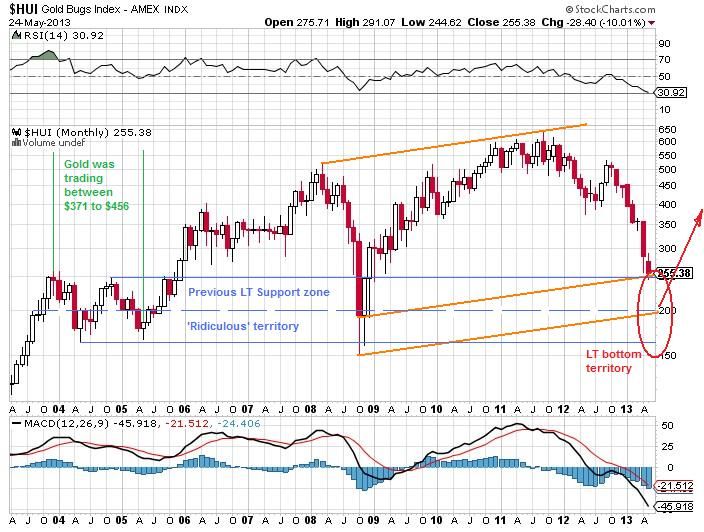
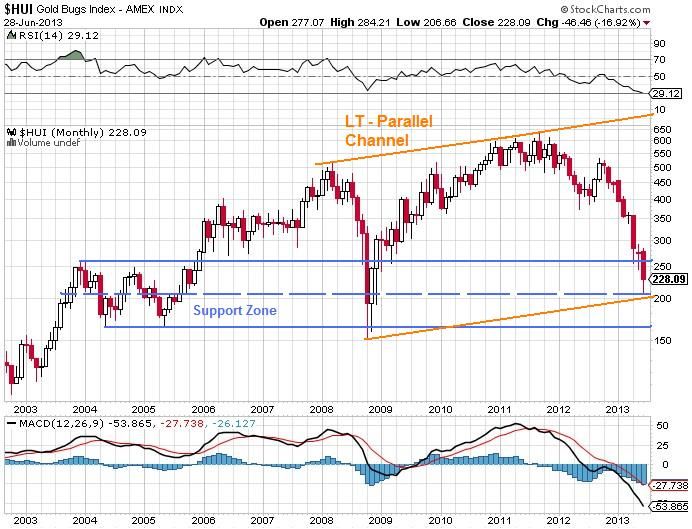
HUI mining index - I've been eying a reversal in this market also. With GDX hitting my target of 22ish as part of a 'roll-out' recovery pattern, everything came together nicely for a bottom and trend change.
Here is the previous chart defining the support area:
Updated:
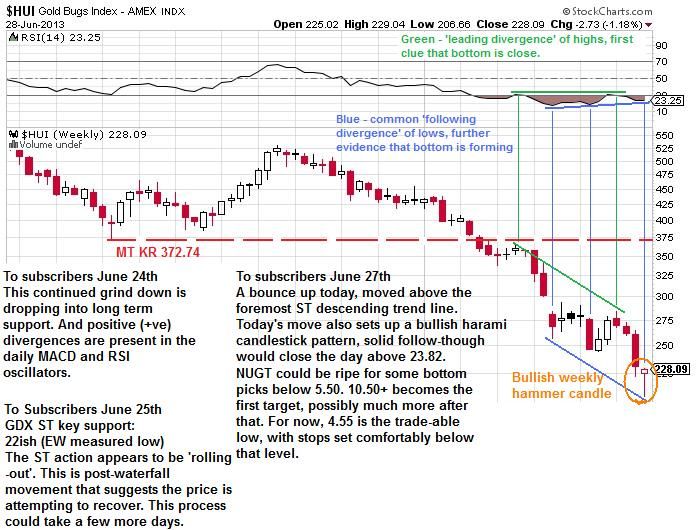
The weekly chart was showing some positive divergences in the RSI, which was confirmed with last week's bullish hammer candle.
--------------------------------------------------------------------------------------------------------------------------------------
If you are interested in receiving my daily email updates on the PM, Forex and other markets, you may subscribe here:
All the best to you,
Quad G